
Abstract
Aerosols exhibit periodic or cyclic variations depending on natural and anthropogenic sources over a region, which can become modulated by synoptic meteorological parameters such as winds, rainfall and relative humidity, and long-range transport. Information on periodicity and phase in aerosol properties assumes significance in prediction as well as examining the radiative and climate effects of aerosols including their association with changes in cloud properties and rainfall. Periodicity in aerosol optical depth, which is a columnar measure of aerosol distribution, is determined using continuous wavelet transform over 35 locations (capitals of states and union territories) in India. Continuous wavelet transform is used in the study because continuous wavelet transform is better suited to the extraction of the periodic and local modulations present in various frequency ranges when compared to Fourier transform. Monthly mean aerosol optical depths (AODs) from the Moderate Resolution Imaging Spectroradiometer (MODIS) on board the Terra satellite at 1° × 1° resolution from January 2001 to December 2012 are used. Annual and quasi-biennial oscillations (QBOs) in AOD are evident in addition to the weak semi-annual (5–6 months) and quasi-triennial oscillations (∼40 months). The semi-annual and annual oscillations are consistent with the seasonal and yearly cycle of variations in AODs. The QBO type periodicity in AOD is found to be non-stationary while the annual period is stationary. The 40 month periodicity indicates the presence of long term correlations in AOD. The observed periodicities in MODIS Terra AODs are also evident in the ground-based AOD measurements made over Kanpur in the Indo-Gangetic Plain. The phase of the periodicity in AOD is stable in the mid-frequency range, while local disturbances in the high-frequency range and long term changes in the atmospheric composition give rise to unstable phases in the low-frequency range. The presence of phase relations among different locations reveals that modulations in AOD over a location/region can influence aerosol characteristics over other locations/regions.
Export citation and abstract BibTeX RIS

Content from this work may be used under the terms of the Creative Commons Attribution 3.0 licence. Any further distribution of this work must maintain attribution to the author(s) and the title of the work, journal citation and DOI.
1. Introduction
Atmospheric aerosols exert a cooling effect on the Earth's climate through direct and indirect effects which partially offset the warming caused due to greenhouse gases. The sources of aerosols can be natural (dust, sea salt, biogenic and volcanic) and anthropogenic (combustion of fossil fuel from urban/industrial processes and biomass burning). Dust, sea salt and sulfate produced over the ocean surfaces dominate the natural global aerosol abundance; however, a fraction of the dust in the atmosphere could be due to anthropogenic activities (Habib et al 2006, Prospero et al 2002). Similarly, smoke from natural burning such as that due to forest fires is treated as a natural component of biomass burning, while the burning of fuel wood or dung cake and crop waste burning are anthropogenic processes. Atmospheric aerosols modify the earth–atmosphere radiation budget by scattering and absorbing the incoming solar radiation (direct effect), and the processes of formation of clouds and precipitation (indirect effect). The direct and indirect aerosol radiative effects remain a significant uncertainty in climate studies (Solomon et al 2007).
Scattering (sulfate) and absorbing (black carbon) particles cool the Earth's surface; however, their radiative effects in the atmosphere vary with altitude. For scattering particles, the top of the atmosphere forcing is almost the same as the surface forcing, while for absorbing aerosol species, the surface forcing is about 2–3 times larger than the top of the atmosphere forcing, which gives rise to a large atmospheric warming. The greenhouse gases are longer lived and globally well mixed and their radiative effects are homogeneous and are of warming throughout the atmosphere starting from the surface. In contrast, aerosols reside in the atmosphere for about a week, exhibit regional signatures and can either warm or cool the atmosphere. Although aerosols are abundant near source regions, they impact the global climate as aerosols and their radiative influence can be transported to other regions due to atmospheric circulation. On temporal scales, the forcing due to aerosols is greatest during daytime and in summer. In contrast, the greenhouse gas forcing acts over the full diurnal and seasonal cycles. Thus, aerosols perturb the earth–atmosphere radiation budget differently from greenhouse gases.
The most important characteristics required to estimate the radiative influence of aerosols are aerosol optical depth (AOD), single scattering albedo (SSA) and asymmetry parameter. Aerosol optical depth is the most crucial parameter to study aerosol–climate interaction among the three, because aerosol radiative forcing changes due to increase in AODs overwhelm the forcing changes due to the increases in single scattering albedo and the asymmetry parameter values (Ramachandran 2005). SSA (ratio of scattering to extinction) values can range from 0 (absorber) to 1 (scatterer). The aerosol radiative forcing at the surface is nearly linearly related to AODs. For the same AOD value when the SSA is lower, the surface forcing is higher and the atmospheric forcing also becomes larger. In addition, the radiative forcing at the top of the atmosphere due to a lower SSA can become positive when the surface albedo is higher (Solomon et al 2007). Thus, it is clear that though aerosols with lower SSAs have the potential to change the sign of the forcing at the top of the atmosphere, AOD is more crucial in aerosol–climate impact investigations owing to its linear dependence on radiative forcing.
AOD is dependent on a number of factors including the aerosol burden throughout the atmospheric column, the aerosol size distribution and the chemical composition (as it relates to water uptake and refractive index). AOD from the Moderate Resolution Imaging Spectroradiometer (MODIS) satellite is found to exhibit seasonal variations. Biomass burning aerosol is significant over the Gulf of Guinea region during January–March, and shifts to southern Africa during August–October (Solomon et al 2007). Transport of mineral dust from Africa to south America occurs during January–March while mineral dust gets transported over the West Indies and central America during August–October. AODs are found to show a minimum in winter (January) and a maximum during summer (April–July) (Jin et al 2005, Ramachandran and Cherian 2008). This indicates that AODs can exhibit periodic or cyclic variations depending on natural and anthropogenic sources over a region, which can become modulated by the synoptic meteorological parameters such as winds, rainfall and relative humidity. Transport of dust and sea salt from the adjacent source regions during different seasons can also modulate the periodic nature of AODs (Prospero et al 2002, Kaufman et al 2002). Knowledge of the periodicity of aerosol characteristics will be useful in statistical forecasting of visibility and air quality. In addition, information on the periodical nature of aerosol properties along with knowledge of the causes of their periodicity will be useful in the prediction of climate impact due to aerosols.
Wavelet transform has emerged as a powerful tool to study transient and time varying phenomena (Daubechies 1992, Mallat 1999). It is an ideal tool for identifying variations at multiple scales. In particular, the continuous Morlet wavelet has optimal sensitivity, making it a good choice for observation of long term periodicities. The optimal sensitivity of wavelets to both high and low scale variations has already found application in the merging of different proxy data for establishing weather variations on the millennial scale (Moberg et al 2005). In this study, for the first time, the periodicities in AODs and their phase over a large spatial domain (India) governed by different aerosol sources and long-range transport are derived. Wavelet transforms are used to probe both the high- and the low-frequency periodic components in AOD over different regions of India, and their phase relationships.
2. Study region
Asia accounts for about 60% of the world's population, and faces serious environmental threats in terms of air pollution, monsoon floods, droughts and associated climate change. Increases in aerosol loading due to growing population and industrialization in recent decades have resulted in an increase in health-related problems, and impacted air quality, agriculture and water resources in Asia (Lau et al 2008). Anthropogenic aerosols over south and east Asia can significantly change the energy balance of the Earth-atmosphere system (Lau et al 2008, Solomon et al 2007). Accumulation of absorbing aerosols (dust and black carbon) during the pre-monsoon season over the Tibetan Plateau can influence the Asian and Indian summer monsoon rainfall (Lau and Kim 2006). India is densely populated (population>1 billion), industrialized and in recent years has witnessed impressive economic development. Seven-year (2000–2006) analysis of MODIS AODs showed that on annual mean scale AODs over India were the highest (Remer et al 2008, table 2) when compared to the rest of the world. With increase in urbanization the usage pattern of fossil and bio-fuels can change leading to changes in aerosol properties, which may influence precipitation and can spin down the hydrological cycle (Lau et al 2008, Solomon et al 2007).
Biofuels such as fuel wood, dung cake and crop waste are used in rural areas, the emissions of which predominantly contribute to aerosol formation (Habib et al 2006). Aerosol emissions from fossil fuels such as coal, petrol and diesel oil dominate the urban areas. These fossil fuels are used in electrical power generation, iron and steel production, oil refining and petrochemical processes, domestic usages and transportation. The Indian subcontinent, apart from being a source region for aerosols, is bordered by densely populated and industrialized areas on the eastern and western sides from where different aerosol species such as mineral dust, black and organic carbon, nitrates, sulfate particles and organics are produced and transported, and therefore is one of the regional aerosol hot spots. The Indian landmass comprises coastal regions, inland plains, semiarid regions, mountains and plateau regions. The Indian subcontinent experiences tropical and subtropical climatic conditions resulting in extreme temperatures, rainfall and relative humidity. These features introduce large variabilities in aerosol characteristics on spatial and temporal scales over India (Ramachandran and Cherian 2008, Habib et al 2006). In this context, it is important to determine the periodicities in aerosol characteristics over a regional aerosol hot spot which can be helpful not only on the regional scale, but also in global air quality and climate.
3. Data
The Moderate Resolution Imaging Spectroradiometer (MODIS) is a remote sensor on board the Earth Observing System (EOS) Terra and Aqua satellites. The MODIS Terra and Aqua satellites operate at an altitude of 705 km with the Terra spacecraft crossing the equator at about 1030 LST (ascending northward) while the Aqua spacecraft crosses the equator at around 1330 LST (descending southward) (King et al 2003, Remer et al 2008). AOD data are available from Terra since March 2000, while AOD data are available from Aqua starting from July 2002. Level 3 MODIS Terra Collection 5.1 quality assured (QA) monthly average 0.55 μm AOD at 1° × 1° data from January 2001 to December 2012 are utilized in this study, to maintain uniformity and because a greater number of data points on a temporal scale are available from Terra. Validation and comparison of AODs retrieved from Terra and Aqua with ground-based Aerosol Robotic Network (AERONET) sun/sky radiometer measured AODs (Holben et al 2001) over the globe revealed that the AODs from Terra and Aqua show only small differences and agree very well over ocean and land (Remer et al 2008). MODIS level 3 atmospheric products are sorted into 1° × 1° cells on an equal-angle global grid from level 2 atmospheric products that span over a 24 h period (King et al 2003). MODIS retrieval algorithms attempt to match the MODIS observed surface reflectances to a look-up table of precomputed reflectances for a wide variety of commonly observed aerosol conditions (King et al 1999) over land and ocean. The predicted retrieval uncertainty of MODIS derived AODs over land is ± (0.05 + 0.15AOD) (Remer et al 2008).
MODIS AOD data corresponding to the capitals of 28 states and seven union territories in India divided into seven regions are analyzed and discussed (Ramachandran and Cherian 2008 table 1). The division is based on geography and meteorological conditions, and within the context of urban and rural development patterns. The capitals of the states and union territories are chosen because most of these locations are urban centers and have medium to dense populations (based on the 2001 Indian census). The capitals across different regions are governed by different aerosol sources. For example, Delhi and Mumbai, in addition to being densely populated, are also the largest commercial centers in India. The metro cities (population>10 million) such as Delhi, Mumbai, Kolkata and Chennai are sources of urban/industrial and automobile emissions. In contrast, northeast India is sparsely populated and is rich in natural resources of oil and gas.
Seasonal mean climatology of aerosol optical depth distribution over India, calculated from the 12-year (2000–2012) MODIS Terra AOD data, and synoptic wind patterns is plotted in figure 1. The mean synoptic surface winds vary as a function of season (figure 1). During winter (December–January–February), the winds are calm, north/northeasterly and are from the northern hemisphere. During the southwest summer monsoon (June–July–August–September), the winds are stronger, moist and come from the marine and western regions surrounding India (figure 1). The winds are in a transitory phase and start shifting in direction during post-monsoon (October–November) from southwest to northeast. During the pre-monsoon season (March–April–May), the winds originate and travel from the west of the Indian subcontinent. AOD exhibits significant regional and seasonal variations across India (figure 1). AODs are higher in monsoon when compared to post-monsoon. AODs are higher over the Indo-Gangetic Plain throughout the year when compared to the rest of India. AODs are higher over the Indo-Gangetic Plain during winter and post-monsoon because of the dominance of fine mode aerosols from fossil fuel and biomass burning, while the higher AODs during pre-monsoon and monsoon are attributed to the dominance of coarse mode dust and sea salt particles.
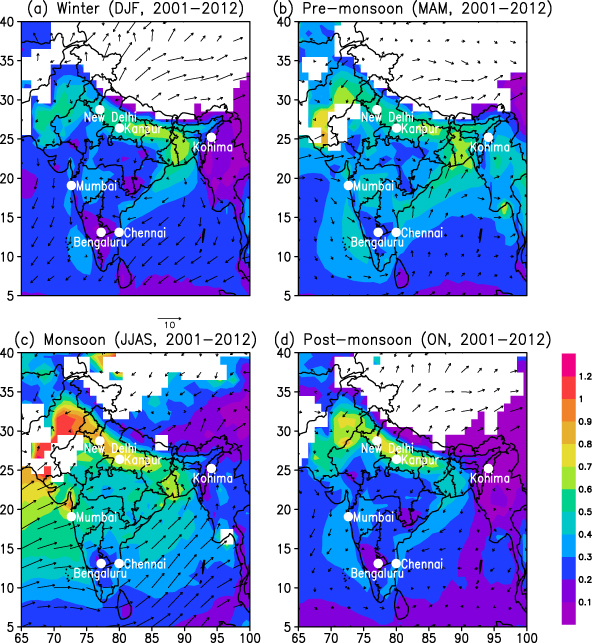
Figure 1. Seasonal mean climatology (2000–2012) of aerosol optical depths and surface winds over India during (a) winter (December–January–February, DJF), (b) pre-monsoon (March–April–May, MAM), (c) monsoon (June–July–August–September, JJAS) and (d) post-monsoon (October–November, ON). The shaded contours correspond to 0.55 μm aerosol optical depths, on which surface winds (ms−1) represented by arrows are overlaid.
Download figure:
Standard imageSeasonal variations in AOD are found to be significant over northwest, north and east India (Ramachandran and Cherian 2008). Annual mean AOD over northeast India is lowest (0.3) and the contribution of fine mode aerosols (aerosols of size<1 μm) to the optical depth is higher (0.95) (Ramachandran and Cherian 2008). Northeast India is sparsely populated, and aerosols from natural burning of forest fires and biomass burning dominate. Annual mean AOD over western India is higher while the fine mode fraction is lower (∼0.6) (Ramachandran and Cherian 2008). Over western India the fine mode contribution to the aerosol optical depth is lower as the region is influenced by both natural (transport of mineral dust and sea salt) and anthropogenic sources (fossil fuel and biomass burning combustion). An analysis of aerosol optical depth and its periodicities over locations governed by different aerosol sources is expected to provide information on the spatial and temporal variations of aerosol sources and their influence on AOD, which are key inputs when examining the radiative and climatic effects of aerosols.
4. Methodology
In this section details about continuous wavelet transform (CWT) and the phase information obtained from the complex continuous wavelet transform are outlined. Wavelet transform, since its advent, has been a valuable tool for signal processing (Daubechies 1992, Torrence and Compo 1998). It has been applied to analyze signals in different fields of science including geophysics, for example to study El Niño Southern Oscillations (Torrence and Compo 1998) and tropical convection over the western Pacific (Weng and Lau 1994) among others. A detailed description of the use of wavelet transforms in geophysics can be found in Foufoula-Georgiou and Kumar (1995). The CWT of a data set X = {xi}, i∈Z+, is given by
where s is the scale and N is the data length. ψ(s) is a well localized (in both physical and Fourier domains), zero mean and integrable function and is called the mother wavelet. Equation (1) represents a convolution equation, where the wavelet coefficients are calculated by convolving the scaled and translated versions of ψ(n) with xi. Thus, it is clear that s is the scaling parameter and j is the translation parameter. In this analysis, the Morlet wavelet is utilized, whose real form is given by

where C is a normalization constant. This function has a wide support and allows one to obtain more accurate results from a computationally performed convolution. Since this function is real it can be used to retrieve periodic structures from the AOD data. In order to obtain the phase relationships between various stations, the complex Morlet function is used. The complex Morlet function is expressed as

where Fb = 1 and Fc = 1.5 are the bandwidth parameter and wavelet center frequencies respectively (see Teolis 1998). The phase angle is given by

Since the data length is 12 years (144 months), the analysis is limited to a scale of 32. As shown in figure 2, the cone of influence is large enough to make the wavelet coefficients significant and reliable at this scale. The finite length of the data brings in boundary effects when wavelet filter coefficients are convoluted with the data sets when determining the wavelet coefficients. As the scale increases, the larger size of the wavelet implies that the boundary effects affect a greater number of wavelet coefficients, making them unphysical. This is captured by the above mentioned cone of influence, within which the wavelet coefficients are physically meaningful. The results obtained from the real Morlet wavelet (equation (2)) are used to extract the multiscale periodicities in the aerosol optical depths, while the complex Morlet function is used to establish the phase relations, if any, between the study locations. Periodicity in atmospheric/geophysical parameters can provide information on the cyclic/periodical behavior and local modulations of the parameters, while the phase relation can be used to understand the influence that aerosols on the local scale exert on a regional scale and/or surrounding locations.
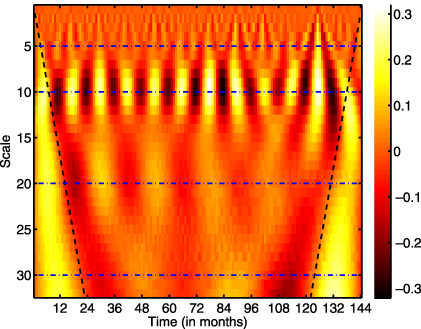
Figure 2. The scalogram for Kohima up to scale 32. The cone of influence (black dotted line) is shown. The semi-annual oscillations (at scale 5), annual oscillations (at scale 10), quasi-biennial oscillations (QBOs) (at scale 20) and 40 month oscillations (at scale 30), shown by blue dotted lines, are clearly visible.
Download figure:
Standard image5. Results and discussion
Results pertaining to four locations in India are highlighted in the study for a comparative study. Mumbai and Chennai represent the western and eastern coastal regions with Bengaluru lying between them (figure 1). These three locations are interesting because of high urbanization and industrialization, which allows one to observe the anthropogenic influence on aerosol characteristics, in conjunction with their vastly different ambient environments (Mumbai and Chennai are urban cities located near the coast, while Bengaluru is a continental location) and climatic conditions (figure 1). Kohima is chosen because it is less industrialized and its atmosphere is dominated by fine mode aerosols produced by natural biomass burning (forest fires). The Kohima and Chennai AODs are lower than the Bengaluru and Mumbai ones (figure 3). Three dominant periods in the signal can be seen, one corresponding to 12 months and the others corresponding to approximately 24 and 40 months. A period of approximately 5–6 months is observed at all the locations, though it is not as significant as the other periodicities. This is indicative of an external influence (over the natural cycle) in AODs. The 5–6 and 12 month periods are consistent with the seasonal (summer high, winter low) and annual patterns seen in AODs (Jin et al 2005, Ramachandran and Cherian 2008). These dominant periods are observed in all the other study locations also (not shown).
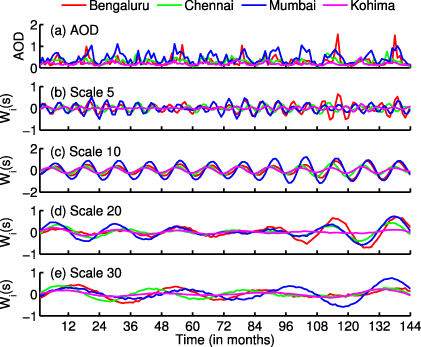
Figure 3. (a) Monthly mean aerosol optical depths over Bengaluru, Chennai, Mumbai and Kohima from January 2001 to December 2012. Wavelet coefficients over Bengaluru, Chennai, Mumbai and Kohima at (b) scale 5, (c) scale 10, (d) scale 20 and (e) scale 30.
Download figure:
Standard imageFigure 3 shows the monthly averaged AOD data and the local variation in various geographical regions, obtained using the Morlet wavelet technique, for Chennai (south India), Mumbai (west India), Bengaluru (south India) and Kohima (northeast India). Although the 12 month period is a stationary period (i.e., it does not vary over time), the 24 month period is non-stationary. The 24 month non-stationary periodicity can be associated with the quasi-biennial oscillation (QBO). The quasi-biennial oscillation refers to downward propagating easterly or westerly winds in the equatorial stratosphere (∼16–50 km). This non-stationary periodic nature in AOD is consistent with QBO variation because the periodicity of QBO itself varies from 22 to 34 months.
QBO is primarily a stratospheric phenomenon and its influence on columnar AODs is expected to be less. However, it has been shown that columnar AODs can be influenced by the different phases of QBO (Beegum et al 2009) over low latitudes or around the equator. The meridional circulation induced by the QBO in winds accompanied by convection (subsidence) over the equator during the east (west) phase with a cooler and higher tropopause (warmer and lower tropopause), and the associated vertical and horizontal mixing of mass flux can modulate the AODs (Beegum et al 2009). This suggests that the QBO, despite primarily being a stratospheric feature, can play a role in influencing the constituents in the troposphere including aerosols. Aerosols in the upper troposphere–lower stratosphere altitude region (10–30 km) over tropical latitudes contribute an average of ∼12% to the columnar AOD (Kulkarni et al 2008). It has also been found that the contribution of aerosols in the 10–30 km region exhibits seasonal variations, and their contribution to the columnar AODs can vary between 10 and 20% (Kulkarni et al 2008), consistent with the finding on increase/decrease in AODs during the different phases of the QBO. A 40 month cycle in AOD is also seen, which appears only after sufficient averaging (figure 3). This implies the presence of long term correlations in AOD over the study locations. The results from the present study on the QBO and 40 month periodicities in AODs agree with Beegum et al (2009).
An analysis of the monthly mean 0.50 μm AODs during 2001–2012 from Kanpur (26.5°N, 80.2°E, 123 m above mean sea level (AMSL)), measured using ground-based AERONET sun/sky radiometers (Holben et al 2001), is undertaken in order to examine whether the observed periodicities are evident in ground-based measurements of columnar AOD as well. Kanpur is an urban, industrial and densely populated city with a population of more than 4 million and is located ∼250 km east of the megacity, New Delhi (figure 1). Kanpur AODs are mostly in the range of 0.5–1 (figure 4). The analysis reveals that the AODs obtained between 2001 and 2012 over Kanpur also exhibit ∼5–6, ∼ 12, ∼ 24 and ∼40 month periodicities (figure 4) consistent with periodicities derived using remote sensing AODs over different locations in India.
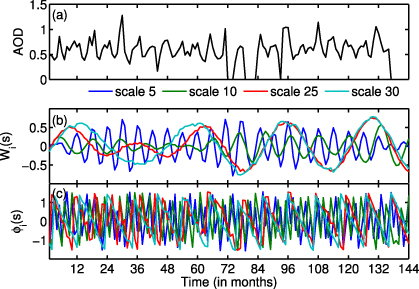
Figure 4. (a) Monthly mean aerosol optical depths over Kanpur during 2001–2012. (b) Wavelet coefficients of aerosol optical depths obtained over Kanpur at different scales. (c) Phase relation of aerosol optical depths over Kanpur.
Download figure:
Standard imageIn figure 5, the phase relations obtained using equation (4) are plotted. It is interesting to see a stationarity in the phases at scale 20. In contrast, at scale 10, which is the high-frequency range, non-stationarity in the phases is observed. All the stations undergo a phase variation around month 35 (at scale 30). The phase relations also provide a measure of the recovery time to their original phases at various locations; Chennai recovers the fastest while the other stations take longer to recover. The low-frequency range is also non-stationary. This makes analysis of the phase differences important. In figure 6 the phase differences between the various stations are depicted. At scale 20 (mid-frequency range) the AODs at the study locations are periodically in and out of phase, while Chennai stays in phase with Mumbai and Bengaluru most of the time. It should be noted that Δϕ = 0 means zero phase lag, while Δϕ > 0 means that the first station leads the phase and Δϕ < 0 means that the second station leads the phase. The observation about the recovery time in figure 5 is corroborated by figure 6. As the individual phases take a long time to recover, the phase differences also take a long time to recover. This long recovery time could be due to an external modulation/forcing from the urban/industrial emissions in these locations, which is a constant source and whose intensity can exhibit variations.
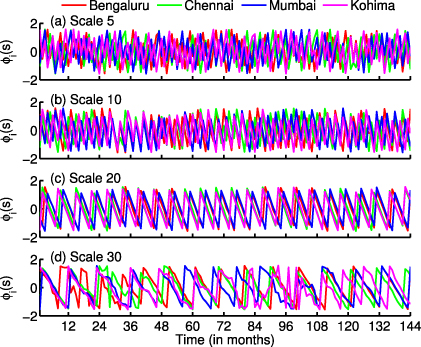
Figure 5. The phase relation at different scales in Bengaluru, Chennai, Mumbai and Kohima: (a) scale 5, (b) scale 10, (c) scale 20 and (d) scale 30.
Download figure:
Standard image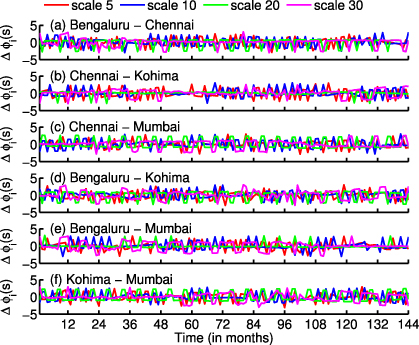
Figure 6. The phase differences between the four major locations at different scales ranging from 5 to 30. A positive phase difference, Δϕ ≡ ϕA − ϕB > 0, indicates that location A is leading location B, while Δϕ < 0 indicates that location A is lagging behind location B.
Download figure:
Standard image6. Conclusions
Multiscale periodicities and phases in aerosol optical depths are determined by performing an analysis over 35 locations (capitals of states and union territories) in India. Continuous wavelet transform is chosen over the conventional method of Fourier transform in the study to extract the periodic and local modulations present at various frequency ranges. Monthly mean aerosol optical depths from MODIS on board the Terra satellite at 1° × 1° resolution from January 2001 to December 2012 are used.
The major findings of the study are as follows.
The study reveals the presence of 5–6 and 40 month periods in AOD, in addition to the annual and quasi-biennial oscillations over the study locations. The semi-annual and annual oscillations are consistent with the seasonal and yearly cycles of variation in AODs. The QBO type periodicity in the AOD is non-stationary, consistent with the variation in the temporal occurrence of the QBO. The 40 month periodicity suggests the presence of long term correlations in the AOD.
AODs obtained from ground-based measurements over Kanpur, an urban, densely populated location in the Indo-Gangetic Plain, also showed semi-annual, annual, QBO and 40 month periodicities consistent with the periodicities observed in MODIS Terra AODs.
The phase of the periodical behavior is stable in the mid-frequency range, while in the high- and low-frequency ranges the phases are unstable, implying time-local disturbances in the high-frequency range. The instability in the low-frequency range could be attributed to long term changes in the atmospheric composition and structure over the locations due to various factors such as industrial emissions and changes in forest cover for example.
The presence of phase relations among different locations signifies that modulations in the AOD over a location/region can affect other regions.
The results from this study on the quantitative determination of the periodic nature of aerosol characteristics over a large spatial domain governed by a variety of aerosol sources will be useful when conducting visibility and air quality studies, and in global climate simulations and/or predictions of aerosols and their radiative effects.
This study should be extended to other regions of the globe to ascertain and correlate the natural and anthropogenic sources/processes contributing to the cyclic behavior of aerosol characteristics.
Acknowledgments
Monthly mean MODIS Terra aerosol optical depths were downloaded from the GES-DISC, NASA. Winds were downloaded from www.cdc.noaa.gov. Thanks are due to Sumita Kedia, CDAC, Pune for her help in drawing figure 1. We thank B N Holben, R P Singh and S N Tripathi for their efforts in establishing and maintaining the AERONET sun/sky radiometers at Kanpur, from which monthly mean aerosol optical depth values at 0.5 μm were taken for this study.