
Abstract
Diffusion of microgeneration technologies, particularly rooftop photovoltaic (PV), represents a key option in reducing emissions in the residential sector. We use a uniquely rich dataset from the burgeoning residential PV market in Texas to study the nature of the consumer's decision-making process in the adoption of these technologies. In particular, focusing on the financial metrics and the information decision-makers use to base their decisions upon, we study how the leasing and buying models affect individual choices and, thereby, the adoption of capital-intensive energy technologies. Overall, our findings suggest that the leasing model more effectively addresses consumers' informational requirements and that, contrary to some other studies, buyers and lessees of PV do not necessarily differ significantly along socio-demographic variables. Instead, we find that the leasing model has opened up the residential PV market to a new, and potentially very large, consumer segment—those with a tight cash-flow situation.
Export citation and abstract BibTeX RIS

Content from this work may be used under the terms of the Creative Commons Attribution-NonCommercial-ShareAlike 3.0 licence. Any further distribution of this work must maintain attribution to the author(s) and the title of the work, journal citation and DOI.
1. Introduction
Two questions prompted the work in this paper. First, what can be learned from the diffusion of solar photovoltaics (PV) for improving existing solar programs and the design of others in newer markets? As policy support for these technologies is waning, this increases the pressure for incentive programs to become more efficient (US DOE 2008, 2012). Second, what lessons can the residential PV market shed on the individual decision-making process? The scale of capital investment for solar PV is quite high relative to most other household investments. So, presumably, the choice to adopt PV forces individuals to consider the (alternative) options more carefully than most investment decisions (Jager 2006). Unpacking the decision to adopt PV, then, might provide insights into the nature of the individual decision-making process.
Understanding the nature of the decision-making process has important practical implications for the design of mechanisms that incentivize reduction of greenhouse gas (GHG) emissions from energy use. With 22.2% consumption of primary energy and 21.4% of the total GHG emissions (EIA 2010) the residential sector is a key target for reducing energy demand and GHG emissions. Diffusion of microgeneration technologies, particularly rooftop PV, represents a key option in meeting demand and emissions reductions in the residential sector (US DOE 2012). As different actors have tried to design programs and incentives to spread the adoption of more efficient and environmentally-friendly consumption and generation devices (Taylor 2008), the nature of the individual's decision-making process has come to sharper focus (Allcott and Mullainathan 2010, Dietz 2010, Drury et al 2011, Jager 2006, Keirstead 2007, Bollinger and Gillingham 2012). Therefore, the last few years of experience with residential PV provides an early and unique opportunity to refine our understanding of how individual decision-making impacts technology diffusion.
Three lines of theory are relevant to this work. First, decision-making at the individual level. While the neoclassical microeconomic theory presumes that individual decision-makers are rational and information-prescient, there is increasing evidence that individual decision-makers depart significantly from the neoclassical model (Camerer et al 2004, Frederick et al 2002, Gintis 2000, Todd and Gigerenzer 2003, Wilson and Dowlatabadi 2007).
Second, empirical evidence of the use of high discount rates for future returns from energy-saving technologies (Gately 1980, Hausman 1979, Meier and Whittier 1983, Ruderman et al 1987). Expectations of rapid technological change, information barriers, and other non-monetary costs are some of the factors that give rise to the use of high implicit discount rates (Hassett and Metcalft 1993, Howarth and Sanstad 1995). In general, this phenomenon discourages the adoption of technologies whose benefits are spread over a long time horizon. The use of upfront capital subsidies have been proposed as a way to overcome this adoption barrier (Guidolin and Mortarino 2009, Hart 2010, Jager 2006, Johnson et al 2012, Timilsina et al 2011).
Third, business models for accelerating the deployment of technologies by addressing market barriers (Gallagher and Muehlegger 2011, Margolis and Zuboy 2006, Sidiras and Koukios 2004) facing individual decision makers—in particular the leasing model. Several researchers suggest that the option to lease a technology effectively addresses the high discount rate problem (Coughlin and Cory 2009, Drury et al 2011)—as well as some of the information failures associated with new technologies (Faiers and Neame 2006, Shih and Chou 2011).
2. Data
Our analysis uses a new household-level dataset built through two complementary data streams: (i) a survey of residents who have adopted PV and (ii) program data for the same adopters obtained from utilities that administer PV rebate programs. The survey, among other factors, explores why PV adopters made the financial choices they did (say, buy versus lease), and their own assessment of the attractiveness of their investment (Rai and McAndrews 2012). The survey was administered electronically in Texas during August–November 2011 and received 365 responses from the 922 PV owners contacted.
All survey respondents reported residing in areas of retail electricity choice in Texas (see supplementary information for spatial distribution available at stacks.iop.org/ERL/8/014022/mmedia). The mean size of the PV system installed was 5.85 kW-DC and the average age of respondents was 52 yr old. The mean household income was between $85 000 and $149 999 and 84.9% reported that at least one member of the household had achieved a college degree or higher level of education. Each of the prior demographics is significantly different from state-wide averages. That is, the survey population was wealthier, older, and better-educated than the average Texas resident. No significant difference was found between lessees and buyers of PV on any demographic variable.
Of the 365 responses, we matched complementary program data for 210 respondents. The program data provides several data points, including (i) installed cost of the system, (ii) price and structure of lease payments if the system was leased, (iii) system capacity (kW, DC and AC), (iv) amount of rebates disbursed, (v) aggregate household electricity consumption from the prior year, (vi) retail electricity provider (REP), electric plan, and marginal cost of electricity consumption just prior to PV installation, and (vii) projected annual electricity generated by the system based on orientation, derating factor, and geography.
3. Methodology
Our strategy is to compare the financial metrics that PV adopters used to evaluate their investment decision (reported metrics) obtained through survey (above) with an 'objective' assessment of those same metrics (modeled metrics). To enable the comparison, we built a financial model that calculates the expected lifecycle costs and revenues of PV system ownership for the residential buying and leasing business models (NREL 2009, Kollins et al 2010). Our model is distinct in two ways. First, our uniquely comprehensive dataset allows detailed cost and revenue calculations for each respondent (decision maker). Second, it includes detailed features of household-level electricity consumption, electricity rates, and PV-based electricity generation, including time-of-day and monthly variations. Next, we provide an overview of our methodology; however a more thorough description is provided in the supplemental information.
3.1. Cash-flow model
For each PV adopter we calculate a series of monthly expected costs (Ck) and revenues (Rk) accrued over the lifetime of the PV system, where k is the number of months since the PV system was installed. Therefore, cash flows (CFk) of the investment are:

Using these cash flows we calculate the net present value (NPV) using a 10% annual discount rate, NPV per DC-kW, payback period for each household's investment, and estimate each individual's implicit discount rate.
3.2. System costs
Costs (Ck) have three monthly components: (a) system payments (Csystemk)—either lease payments or loan payments when financed and a down payment as appropriate, (b) operations and maintenance costs (CO&Mk), and (c) cost of inverter replacement (CInverterk) where:

System payments for buyers comprise a down payment in the first period and loan payments if the system was financed. The net system cost is the installed cost less the utility rebate reported in the program data less applicable federal tax credits. We assume that: (i) buyers will make periodic operation and maintenance-related (O & M) expenses equivalent to 0–0.75% yr−1 of the system's installed cost; these O&M costs are expensed equally each month, and (ii) inverters require replacement after 15 yr of use and cost $0.7–0.95 per DC-Watt. In section 3.4 we present a set of scenarios that systematically vary these parameters.
Lessees are not obligated to pay O&M or inverter replacement costs as this is a value-adding service provided by the lessor (Mont 2004). Therefore, the only costs of ownership incurred are lease payments (upfront payment and monthly lease payments). Within the sample, 69% of lessees paid for their lease entirely through a 'prepaid' down payment, 26% through only monthly payments, and 4% through a combination of monthly payments and a down payment. For all leased systems analyzed, we use the actual lease payments being made by the lessees.
3.3. System revenue
PV systems generate value by reducing owners' electricity-bill expenses during the life of the system. Therefore, the difference between electric bills the owner would have incurred without the system (BAU bill) and those with the PV system (PV bill) is effectively a monthly stream of revenues (Rk). The value of these revenues depends on the structure and rates of both bills. Our model forecasts these revenues over the system's lifetime.
3.3.1. Electricity consumption and generation profiles.
Two central factors in the PV value proposition are seasonal and hourly variations in the system's generation and the household's consumption of electricity. For both factors, we use each respondent's historic annual consumption and expected annual system production (kWh) as reported in the program data, but not individual consumption or generation patterns. To simulate these hourly and seasonal variations we used load profiles published by the Electricity Reliability Council of Texas (ERCOT) of average residential consumption patterns in north-central Texas in 2010 (ERCOT 2010) and a PV generation profile for the Dallas-Ft. Worth area taken from the PVWATTS model created by the US National Renewable Energy Laboratory (NREL 2011).
Furthermore, we assume that patterns and quantities of electricity consumption are invariant over the lifetime of the PV system. This is not a robust assumption per se, since we do not capture household-level patterns of consumption that differ from the ERCOT profile or that evolve over time. But, since the goal is to compare the objective and reported financial metrics, this assumption is robust enough for our analysis because any variations in consumption profiles will largely cancel out in the revenue calculations.
3.3.2. Electricity rates.
Within the ERCOT deregulated electricity market customers freely choose retail electricity service among providers with varying rates and bill structures (TECEP 2012). An important factor is whether their Retail Electricity Provider (REP) offers a plan that credits any moment-to-moment excesses of PV generation over consumption outflowed to the grid (Darghouth et al 2011, Mills et al 2008). Unlike many retail choice states, the ERCOT market does not mandate that REPs provide credits for these 'outflows' (PUCT 2012). Current practice is for REPs to credit outflows at a rate below the marginal price of electricity.
While it is tempting to assume that consumers will select electricity plans which offer the highest value for their PV system, it is not obvious what depth of information finding and analysis decision-makers go through to determine which REP provides this greatest value (Conlisk 1996, Fuchs and Arentsen 2002, Gigerenzer and Todd 1999, Goett et al 2000, Roe et al 2001, Tversky and Kahneman 1974). We account for this dilemma through a set of scenarios, discussed next.
3.4. Scenarios
To account for uncertainty in the model's parameters (Bergmann et al 2006, Laitner et al 2003), calculations are structured as a series of five scenarios—Very Conservative, Conservative, Baseline, Optimistic, and Very Optimistic (table 1). Scenarios employ progressively more optimistic assumptions that increase the value of solar to the consumer. Parameters varied were: (i) the annual growth rate in nominal retail electricity price (0–5%) (ii) if bought, lifetime of the system (20 or 25 yr) (iii) system loss rate (0.75–0.25% yr−1) (iii) O&M costs as a percentage of installed costs incurred per year (0.5–0% yr−1), and (iv) inverter replacement cost ($0.95 W−1–$0 W−1). Note that these scenarios are not intended to represent likely or unlikely outcomes, but to explore how consumers' differing assumptions would affect their evaluation of PV's value.
Table 1. Description of the scenarios.
| Scenario | (1) V. Conservative | (2) Conservative | (3) Baseline | (4) Optimistic | (5) V. Optimistic |
|---|---|---|---|---|---|
| Elec. cost growth | 0.0% yr−1 | 2.6% yr−1 | 2.6% yr−1 | 3.3% yr−1 | 5.0% yr−1 |
| System life | 20 yr | 20 yr | 25 yr | 25 yr | 25 yr |
| System loss rate | 0.75% yr−1 | 0.5% yr−1 | 0.5% yr−1 | 0.5% yr−1 | 0.25% yr−1 |
| Maintenance costs | 0.5% yr−1 | 0.25% | 0.25% yr−1 | 0.15% yr−1 | 0% yr−1 |
| Inv. replace. cost | $ 0.95 W−1 | $ 0.95 W−1 | $ 0.7 W−1 | $ 0.7 W−1 | None |
| Electricity plan after PV adoption | Keeps same REP and plan post-installation; no outflows | Adopts solar plan if offered by current REP | Adopts solar plan if offered by current REP; min. 7.5 ¢ kWh−1 outflow | Adopts plan with max. value among current market solar plans or BAU plan | Same as scenario 4 |
Scenarios also vary the customer's retail electricity plan post-installation. The most conservative scenario (scenario 1) assumes that consumers remain on their pre-PV plan for the lifetime of the system, whereas the most optimistic scenario (scenarios 4 and 5) assumes that the consumer actively researches and selects plans that minimize their electricity bill. The baseline scenario (scenario 3) assumes that consumers will adopt a 'solar' plan if offered by their REP, but will not transfer REPs. In addition, the consumer is credited 7.5 ¢ kWh−1 for outflows if their current REP does not offer a solar plan—since we believe that nearly all REPs will offer an outflow credit in the future. Indeed, most major REPs do so already.
4. Results
We present here the results of our analysis. Framing this analysis are the differences between buying and leasing consumers. Contrary to Drury et al (2011), we found no statistically significant differences between the two groups on demographic factors including income, age, education, and race as well as contextual factors such as the size of their system, annual electricity consumed, or electricity rates. Based on these results and those that follow, our conclusion is that at this stage in the diffusion of residential PV buyers and leasers do not represent different demographic groups, but rather different consumer segments within the residential PV market.
4.1. Installed cost and cost of ownership
Installed costs ($W−1) of leased systems (Mean = 8.3, Std. dev. = 0.53) were significantly more than those of bough systems (Mean = 6.2, Std. dev. = 1.4) and the mean differences were highly significant (t(201) = 16.08; p < 0.001). This corroborates similar installed cost differences for bought and leased systems nationally (Barbose et al 2012). As discussed in section 3.2, recall that while buyers' cost of ownership is the installed cost less applicable rebates, the installed cost is generally not reflective of the lessees' cost of ownership, which are only their lease payments. Surprisingly, the mean lessees' cost of ownership ($0.70 W−1) were substantially less than those of buyers ($2.64 W−1)4. Accordingly, we found that lessees had a statistically significant greater NPV per capacity ratio (NPV/DC-kW) than buyers in all but scenario 5 (figure 1; only baseline scenario shown).
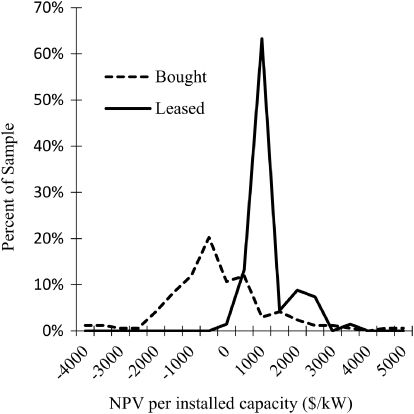
Figure 1. Distribution of modeled NPV kW−1 assuming baseline model parameters.
Download figure:
Standard imageHow is it possible that leased systems are installed at higher costs than bought systems, but that lessees face a lower cost of ownership than the equivalent bought system? As others have noted (for example see, Barbose et al 2012), the installed cost reported to state and utility PV incentive programs is often the 'fair market value', or the appraised value, reported when applying for the 1603 Treasury Cash Grant or Federal ITC. Since the benefits of both the 1603 Treasury Cash Grant and tax benefits from MACRS increase with the appraised value of the system, it is plausible that some leasing companies might be inflating the appraised value—at least the incentive to do so clearly exists. Indeed the SEC and IRS recently began an investigation of several leading leasing firms to determine if the true fair market value of installed PV systems were materially lower than what the firms had historically claimed (SEC 2012). If proven true, one implication of this financial strategy would be that since additional system costs and company profits are recouped through the tax structure, leasing companies adopting such strategies would be able to offer lower rates to their customers (the lessees). The fact that we indeed find the cost of leasing PV systems (by the lessees) to be much lower than the cost of buying PV systems lends some support to the hypothesis that some leasing companies might be employing such financial strategies.
Therefore, we tentatively explain lower lessees' costs of ownership through the following mechanisms: (i) maximization of federal tax benefits by leasing companies (lessors) through the financial strategy described above; (ii) in the current policy environment, lessors are able to access additional financial incentives that buyers cannot access, particularly, accelerated depreciation (Bolinger 2009, Coughlin and Cory 2009); (iii) economies of scale present in the operation of a larger fleet of leased systems; (iv) ability for lessors to raise capital at a lower cost, which would increase their leveraged return on capital; and (v) since the lease contracts are typically only 15–20 yr as compared to the generally reported lifetime of PV panels of 20–25 yr, leased systems will likely have some residual value; in theory, the lessors could recoup the residual value at a later date, which would allow them to offer the leased systems at lower rates today. All of these mechanism would lower costs faced by lessors, and therefore reduce the size of the lease payments required to achieve a given rate of return. In a competitive leasing market, then, these mechanisms would translate into lower costs faced by lessees—just as we find. A deeper explanation of these aspects would require financial analysis of the leasing companies' balance sheets, which is beyond the scope of this paper.
If leasing is financially more attractive, why don't more adopters choose to lease? For many the option did not exist—73% of buyers reported not having the option to lease when making their decision. There is also evidence in the literature of conspicuous consumption for novel 'green' technologies (Dastrop et al 2011, Sexton 2011); under this paradigm, consumers could derive additional utility from the status gained by owning, rather than leasing, their system. Residence uncertainty was not a factor, as each group reported a similar (10–15 yr) period that they expected to continue living in their homes. Finally, a majority of PV adopters who had the option to either buy or lease a PV system, but chose to buy report concerns about potential difficulties with the leasing contract as a factor in their decision to buy5. Considering all these factors, we conclude that buyers who did have the option to lease, but chose to buy, had adequate cash-flow such that they preferred the contractually simple buying option, even though the leasing option is nominally cheaper.
4.2. Payback period comparison
Consistent with previous research (Camerer et al 2004, Kempton and Montgomery 1982, Kirchler et al 2008), the majority of respondents (66%) reported using payback period to evaluate the financial attractiveness of their investment as opposed to NPV (7%), internal rate of return (27%), net monthly savings (25%), or other metrics (6%). 10% made no estimate of the financial attractiveness. Respondents also reported the values of the metrics they used. These responses allow us to compare reported metric values (reported) to the values individually generated from the financial model (modeled) (figure 2; only baseline scenario shown).

Figure 2. Comparison of reported and modeled payback period in scenario 3. Mean difference between modeled and consumer payback period: buyers = 7.1 yr−1;leasers = 1.1 yr.
Download figure:
Standard imageFor buyers, scenario 4 minimized the average absolute difference between reported and modeled payback period (M = 2.6 yr,SD = 2.4), followed by scenario 5 (M = 3.1,SD = 1.9). For lessees, scenario 3 (M = 1.1,SD = 0.7) was the best fit, followed by scenario 2 (M = 1.296,SD = 0.704). Scenario 1 was a poor fit overall. This suggests that buyers assumed parameters similar to those of scenario 4 when evaluating their investment. That is, buyers were optimistic when assessing the likely revenues and costs associated with their investment decision. By the same argument, lessees were more realistic and precise when making their investment decision. This is consistent with the fact that lessees receive much of this financial information from leasing companies, who use very detailed and sophisticated financial models.
4.3. Implied discount rate
For all calculations of NPV reported above a 10% annual discount rate was assumed. In this section we present discount rates calculated separately for each individual respondent. Specifically, we first determine each respondent's implied NPV and then back-calculate their discount rate using the implied NPV and their modeled cash flows. To determine the implied NPV, respondents were asked on a 5-point Likert-scale how strongly they agreed with the following five statements: (i) 'I would not have installed the PV system if it had cost me $1000 more'...(v) 'I would not have installed the PV system if it had cost me $5000 more'. One expects respondents to increasingly agree that they would not have installed the PV system as the price increased. The above question estimates the respondent's implied NPV by extrapolating how much more the respondent would have paid before becoming indifferent to purchasing the system or forgoing the investment (figure 3).
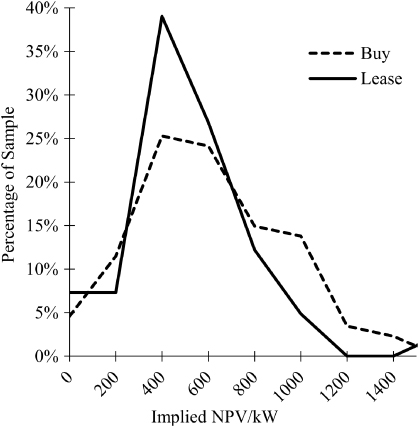
Figure 3. Distribution of implied NPV kW−1 for buyers and leasers; difference of mean is not significantly different than zero.
Download figure:
Standard imageOf the 210 respondents in our dataset, 92 responses were excluded from these calculations—69 whose implied NPV was outside the range tested ($0–$5000), 7 responses which implied an increasing willingness to pay, and 16 non-responses. Of the excluded respondents, 55 respondents indicated they would have been willing to pay at least $5000 more for their system—of which 76% were buyers and 24% leasers. That is, a significant per cent of the sample (26.2%) did assign a positive value to their investment, yet were not captured within this calculation because of insufficient data. In the end, there are 81 buyers and 37 lessees remaining for the discount rate analysis reported in this section.
Using the implied NPV, we solve for the monthly discount rate (rm), required to equate the respondent's implied NPV with the cash flows modeled earlier.:

The monthly discount rate is then annualized using (4):

Thus, r represents each respondent's discount rate implied by their willingness to pay and their modeled cash flows. As the cash flows vary with each scenario, implied discount rates also vary with scenarios.
Using baseline (scenario 3) parameters, the mean discount rate for buyers was 7 ± 5% and for lessees was 21 ± 14% (±1σ) (tables 2 and 3). The calculated implied discount rates are higher in the optimistic scenarios since cash flows increase as the scenarios become more optimistic. Across all scenarios and income levels lessees' implied discount rates are significantly higher than buyers by 8–21%.
Table 2. Mean implied discount rate for buyers along income and scenarios with ±1σ.
| Buyers | All incomes | $0–$85k | $85k–$150k | $150k+ |
|---|---|---|---|---|
| N | 81 | 22 | 37 | 22 |
| Scen 2: conservative | 6% ± 6% | 6% ± 5% | 6% ± 8% | 7% ± 6% |
| Scen 3: baseline | 7% ± 5% | 7% ± 4% | 6% ± 6% | 7% ± 6% |
| Scen 4: optimistic | 13% ± 6% | 12% ± 5% | 13% ± 6% | 13% ± 7% |
| Scen 5: V. Optimistic | 18% ± 7% | 17% ± 5% | 18% ± 7% | 17% ± 8% |
Table 3. Mean implied discount rate for leasers along income and scenarios with ±1σ.
| Leasers | All incomes | $0–$85k | $85k–$150k | $150k+ |
|---|---|---|---|---|
| N | 37 | 13 | 13 | 11 |
| Scen 2: conservative | 20% ± 15% | 22% ± 19% | 20% ± 14% | 18% ± 12% |
| Scen 3: baseline | 21% ± 14% | 23% ± 18% | 22% ± 13% | 19% ± 12% |
| Scen 4: optimistic | 32% ± 17% | 33% ± 22% | 35% ± 15% | 30% ± 14% |
| Scen 5: V. Optimistic | 35% ± 13% | 29% ± 9% | 38% ± 13% | 36% ± 16% |
It is important to note a similarity in the timing of leased and bought payments—the majority (69%) of lessee respondents chose to structure their leases as a single 'prepaid' down payment, which is similar to the financial structure of a bought system, but significantly smaller in the scale of investment. After taking all incentives into account, for lessees the upfront payment is on the order of $4000 and for buyers it is $15 000 for a 6 kW-DC system. Yet, each group expects to receive a similar (normalized) NPV for their investment. That is possible only when these groups have differing cash urgencies. Indeed, in open-ended survey questions, 66.2% of lessees agreed or strongly agreed that tight cash availability was one of the key factors in their decision to lease, whereas buyers generally did not have this problem. Given that there are little, if any, demographic differences between buyers and lessees, then, we infer that at this stage in the residential PV market buyers and lessees represent different consumer segments within a similar socio-demographic makeup. Put differently, compared to the average buyer the average lessee is not lower income per se—the majority of the lessees have some cash availability, just not enough to outright buy their PV system.
In general, our point is that within populations with similar demographics it is possible that there are variations in disposable income, and those variations are a key factor in ownership model choices6. Consistent with a large body of work in the diffusion of innovations tradition (Rogers 2003), our results suggest that there is a hierarchy within the population regarding the adoption of technologies. In early stages of technology diffusion, as is the case with PV now, information (awareness of products, interest in energy, etc) is the precursor, which is more likely to be found in higher income, more educated segments of the population. Within those segments, those with tighter cash flows opt for leasing, if that option is available. Thus, the leasing model appears to be especially effective in the early stages of a technology's diffusion, as it unlocks the cash-strapped but information-aware segments of the market. Put differently, the leasing model accelerates the early adoption stage of a technology's diffusion, thereby quickly establishing a wider base on which later adoption can build upon.
4.3.1. Discount rate and income.
Previous literature starting with Hausman (1979) suggests that an inverse relationship exists between household income and consumer discount rate. That is, poorer consumers have more urgent needs for their cash than wealthy ones. At higher incomes, where one has a greater degree of spare income, the rate of return of investments (and hence, their discount rate) should converge to market returns. Our results are mixed in regard to these earlier findings.
A one-tailed t-test comparing the difference in mean discount rate among income groups for the baseline scenario was performed using the hypotheses Ho: DR1 = DR2,Ha: DR1 ≥ DR2, and Ho: DR2 = DR3,Ha: DR2 ≥ DR3, where DR1 is the mean implied discount rate for income group 1 and so on7. This test was performed for both income pairs (DR1 ≥ DR2,DR2 ≥ DR3) since we expect the implied discount rate to monotonically decrease with income.
Even with a 90% confidence interval, we did not find a statistically significant relationship between income and discount rate for either buyers or lessees. We explain this discrepancy with two reasons. First, small sample size, particularly in the leasing sample, reduced our test's statistical power. Second, both groups exhibit characteristics typical of early adopters—wealthier, more educated, etc. These characteristics could negate the relationship between income and discount rate for products in settled markets as early adopters typically derive additional utility from adopting new technologies beyond financial benefits (Faiers et al 2007, Labay and Kinnear 1981, Rogers 2003). In agreement with previous literature, we do find that discount rates for buyers in the conservative, baseline, and optimistic scenarios (scenarios 2–4) ranges between 7 and 13%, which is close to market returns. This also supports our finding that buyers of PV systems are in a relatively comfortable cash-flow position.
5. Conclusion
We have studied the economics of the decision-process of individual consumers, particularly their decision to buy or lease a residential PV system. Consistent with several other studies, we find that a majority of PV adopters used payback period—not net present value (NPV)—as the decision-making criterion. We also find that owing to the peculiarities of financing and incentive mechanisms, the pre-rebate installed costs of leased PV systems are significantly higher than the bought systems, yet lessees end up paying nominally much lower amounts than buyers of PV. We calculate individual-level discount rates across a range of scenarios, finding that buyers employ discount rates 8–21% lower than lessees. Those who lease typically have a tighter cash-flow situation, which, in addition to less uncertainty about technological performance, are the main reasons for them to lease. As we do not find any significant variation between buyers and lessees on any socio-demographic dimension (income, age, etc) this suggests that the leasing model is making PV adoption possible for a new consumer segment—those with a tight cash-flow situation. As the diffusion of PV spreads to lower-income households, who generally experience tighter cash-flow than wealthier households, this implies that, ceteris paribus, moving forward the leasing model will likely be the predominant form of PV adoption. From this perspective, the leasing model has opened a new market segment at existing prices and supply chain conditions—and represents a business model innovation.
Acknowledgments
VR would like to acknowledge support from the Elspeth Rostow Memorial Fellowship and from the Center for International Energy and Environmental Policy (CIEEP) at the University of Texas at Austin. BS would like to acknowledge support from the LBJ School of Public Affairs and the Energy & Earth Resources Program at UT Austin. The LBJ School of Public Affairs at UT Austin helped meet the publication charges for this letter. Any remaining errors are ours alone.
Footnotes
- 4
Note that the upfront cost of ownership does not reflect the operational life of PV systems or their performance over that lifetime. In general, most analyses assume an operational life for PV systems of 20–25 yr, which is applicable to buyers of PV systems. Lease contracts typically terminate after 15–20 yr. So the difference in the upfront cost of ownership of bought versus leased systems should be put in this context. However, as discussed below, NPV calculations incorporate this difference in the length of cash flows.
- 5
There were 44 respondents in our sample who had the option to either lease or buy a PV system, but chose to buy. Of those 24 responded to a 5-point Likert-scale question on how strongly they agreed with the statement, 'I was concerned about potential difficulties related to the leasing contract'. 50% agreed or strongly agreed with the statement, while only 8.5% disagreed or strongly disagreed with the statement.
- 6
We note, however, there are several factors besides cash availability that can guide ownership choices—priority of environmental value over financial concerns, intended length of residence, financial security, and so on.
- 7
Income groups were: income 1: $0–$84 999 year−1; income 2: $85 000–$149 999 year−1; income 3:$150 000 +year−1.