

Abstract
We use time- and frequency-domain techniques to quantify the extent to which long-distance interconnection of wind plants in the United States would reduce the variability of wind power output. Previous work has shown that interconnection of just a few wind plants across moderate distances could greatly reduce the ratio of fast- to slow-ramping generators in the balancing portfolio. We find that interconnection of aggregate regional wind plants would not reduce this ratio further but would reduce variability at all frequencies examined. Further, interconnection of just a few wind plants reduces the average hourly change in power output, but interconnection across regions provides little further reduction. Interconnection also reduces the magnitude of low-probability step changes and doubles firm power output (capacity available at least 92% of the time) compared with a single region. First-order analysis indicates that balancing wind and providing firm power with local natural gas turbines would be more cost-effective than with transmission interconnection. For net load, increased wind capacity would require more balancing resources but in the same proportions by frequency as currently, justifying the practice of treating wind as negative load.
Export citation and abstract BibTeX RIS

Content from this work may be used under the terms of the Creative Commons Attribution-NonCommercial-ShareAlike 3.0 licence. Any further distribution of this work must maintain attribution to the author(s) and the title of the work, journal citation and DOI.
1. Introduction
Wind power is among the least costly and most developed renewable energy technologies, which renders it well suited to fulfilling the renewable energy targets currently implemented in most US states. Between 2005 and 2010, installed wind capacity in the US increased by a factor of 4.4 and net wind generation by a factor of 5.3 (Wiser and Bolinger 2011). As wind capacity continues to grow, the variability and intermittency of wind power can create challenges for grid operators. High-frequency, second-to-second fluctuations can increase the need for frequency regulation, and lower-frequency (hourly to seasonal) fluctuations can change the capacity factors of baseload generators and in severe cases affect reliability. Wind integration studies have suggested that building transmission capacity to interconnect wind power plants could greatly smooth wind power output (Zavadil 2006, IEA 2005, EnerNex 2011, GE Energy 2010, EERE 2008), but few explicitly account for the frequency at which the variability occurs.
Katzenstein et al (2010) performed the first frequency-dependent analysis of the smoothing effect of interconnecting wind plants. Using 15 min energy output data from 20 wind plants in the Electric Reliability Council of Texas (ERCOT), Katzenstein et al (2010) find that at a frequency of (1 h)−1 (2.8 × 10⁻⁴ Hz) interconnecting just four wind plants reduces the ratio of high- to low-frequency variability by 87% compared with a single wind plant, but that connecting additional wind plants yields diminishing returns. At a frequency of (12 h)−1, interconnecting four wind plants reduces this ratio by only 30% compared with a single plant. Variability reduction was found to depend on factors such as size and location of wind plants as well as the number interconnected.
This result highlights the importance of time scale in characterizing wind power smoothing and suggests that interconnecting a relatively small number of wind plants could achieve most of the reduction in the ratio of high- to low-frequency variability that would result from interconnecting many more. This ratio is one determinant of the relative requirements for fast- and slow-ramping sources required to compensate for wind's variability. Katzenstein et al (2010) limited their study to west-central Texas, where there may be a correlation of weather and wind patterns, and did not examine the effect of wind plant interconnection on the variability of net load (electricity load minus wind power output). Building upon Katzenstein et al (2010), our work uses frequency-domain analysis to examine both the smoothing effect of interconnecting wind plants across greater distances and the variability of net load under greater wind power penetration (see supporting information S2 available at stacks.iop.org/ERL/7/034017/mmedia).
Sørensen et al (2008) use frequency-domain techniques to analyze the reduction in wind power output variability due to interconnecting individual wind turbines within a single offshore wind plant. The smoothing effect is modeled at time scales from minutes to hours and found to be strongest at high frequencies. The analysis and results of Sørensen et al (2008) are similar to ours despite the difference in scale, highlighting the fractal property of wind energy.
Wind power variability studies utilizing exclusively the time domain include Giebel (2000), Ernst et al (1999) and Sinden (2007). These studies find that correlation of wind power output decreases predictably as the distance between the wind plants increases but is still slightly positive even for widely separated plants.
Further characterizing geographic smoothing, Degeilh and Singh (2011) introduce a method for selecting from a set of geographically separated wind sites to minimize wind power output variance and show that achieving this objective yields the smallest loss of load probability (LOLP) as well. Kempton et al (2010) use offshore meteorological buoy data from 2500 km along the US east coast to analyze the effect of interconnecting 11 wind sites and find that interconnection reduces the variance of simulated power output, slows the rate of change, and eliminates hours of zero production during the five-year study period. Kempton et al (2010) conclude that the cost of mitigating wind variability with long-distance transmission interconnection has a cost on par with current methods of balancing wind. Dvorak et al (2012) use mesoscale wind data to find the best locations for four offshore wind plants near the US east coast to reduce variability, hourly ramp rates, and hours of zero power. The latter two studies approximate wind power output using wind speed measurements taken significantly below turbine hub height. Though buoy data are the best available until hub height met masts become widespread and generate an extensive record, they are often of poor quality and can exaggerate estimated wind power variability (Holttinen 2005).
In this letter, we analyze the extent to which interconnecting wind plants over broad geographical regions of the United States will reduce variability of wind power output. We use simultaneous wind energy data from four regions (the Bonneville Power Authority (BPA), the Electric Reliability Council of Texas (ERCOT), the Midwest ISO (MISO) and the California ISO (CAISO)) and apply methods suggested in Katzenstein et al (2010) and Sørensen et al (2007). The analysis informs the question of whether increasing inter-regional transmission capacity is an effective means of smoothing wind power output. Section 2 describes the data and methods, section 3 presents results, and section 4 discusses implications and concludes.
The observed data show that interconnection of regional wind resources increases the percentage of firm wind power capacity, reduces the coefficient of variation of wind power output, and reduces the likelihood of extreme step changes. Although step changes are one metric for evaluating variability, frequency-domain analysis can help establish the portfolio of generation needed to compensate for variability. If the amplitude of high-frequency variations is the same as that of low-frequency variations, as much fast-ramping generation must be available as slow-ramping generation. On the other hand, if interconnection is able to reduce the fast fluctuations, much less fast-ramping generation will be required. Katzenstein et al (2010) found that interconnecting 4 or 5 wind plants achieves the majority of the reduction in the ratio of high- to low-frequency fluctuations. Because an asymptote is quickly reached, it is not surprising that we find large scale interconnection does not further reduce this ratio, and that variability reduction at the relevant frequencies could be achieved as effectively by interconnection within regions as between regions. Likewise, inter-regional interconnection does not significantly affect mean step changes in hourly wind power output; the majority of the reduction in mean step changes is achievable through interconnection of wind plants within single regions.
2. Data and methods
We use wind energy output and load data from BPA, CAISO, ERCOT and MISO (see supporting information S1.1 available at stacks.iop.org/ERL/7/034017/mmedia). Throughout the analysis, 2009 is emphasized since it was the only year for which data from all four regions were available. When analyzing multiple regions simultaneously, higher-frequency data are summed to hourly, the highest common frequency, and data are adjusted by time zone to coincide. Single missing hourly data points were approximated as the mean of the preceding and following values, and longer gaps were excised. When feasible, analysis of a single region across years characterizes interyear variability. Figure 1 shows a map of the four control regions with wind plant locations and supporting information S1.1 (available at stacks.iop.org/ERL/7/034017/mmedia) contains relevant wind and load statistics.
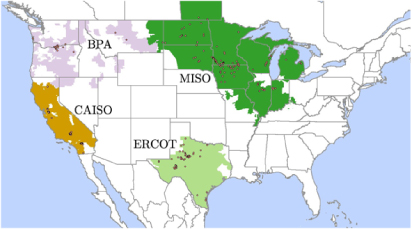
Figure 1. The area spanned by each region and the wind plants it contains.
Download figure:
Standard imageThe principal analytical tool we use is the power spectral density (PSD), which gives a quantitative measure of the strength of wind power fluctuations across a range of frequencies. PSDs of wind power output often contain a peak at (24 h)−1, reflecting daily periodicity (see supporting information figure S1 available at stacks.iop.org/ERL/7/034017/mmedia). At higher frequencies, wind power PSDs have a negative slope in log–log space: power fluctuations at frequencies corresponding to 10 min, for example, are at least a factor of a thousand smaller than those at periods of 12 h. This property has important practical consequences: if the PSD of wind were flat (white noise), large amounts of very fast-ramping sources would be required to buffer the fluctuations of wind power. The negative slope of the PSD implies that slow-ramping resources such as coal or combined-cycle gas plants can compensate for most of wind power's variability, with less reliance on fast-ramping resources such as batteries and peaker gas plants. The Kaimal spectrum, with a slope of − 5/3 at frequencies above 24 h−1 in log–log space, has been shown to approximate the PSD of power output from a single wind plant (Katzenstein et al 2010) (see supporting information S1.2 available at stacks.iop.org/ERL/7/034017/mmedia).
The absolute values of the PSDs, especially at higher frequencies, cannot be directly translated into the wind-balancing resources required at those frequencies. Rare but steep rises or falls in wind power output can increase PSD values at high frequencies such that they no longer reflect general variability patterns. To gain insight into the ideal composition of a wind-balancing portfolio, we observe that the power spectrum for a single, linear ramping generator would be proportional to f−2 (Apt 2007). A generator such as a natural gas plant, sized so that its ramp rate matches wind's hourly variability, would therefore have nearly twice the capacity necessary to compensate for wind fluctuations observed at daily frequencies. Balancing wind with a portfolio containing fast-ramping resources such as batteries, fuel cells and supercapacitors, in addition to slower-ramping resources, would avoid the unnecessary expense incurred by building a single type of linear ramp rate generator that would have excess capacity at low frequencies (Apt 2007).
We analyze PSDs of wind energy output of single regions as well as the summed output of two to four regions, representing interconnection by increased transmission capacity. The inertial subrange is the range of frequencies above the corner frequency, where the power spectrum transitions from zero to negative slope at roughly (24 h)−1 (see supporting information S2 available at stacks.iop.org/ERL/7/034017/mmedia). The PSD slope in the inertial subrange reflects the relative proportion of fast- and slow-ramping units required to balance wind power output. A slope steeper than − 5/3 implies that high-frequency fluctuations are weaker relative to low-frequency fluctuations than expected for a single wind plant. This smoothing effect at high frequencies is due to the geographic diversity of wind plants. If the slope is steeper for summed data than for individual regions, then interconnection across regions would reduce the relative variability of wind power output at higher frequencies more than further interconnection within the same region. PSD slopes were found using least-squares linear regression.
3. Results
3.1. Frequency-domain analysis
Figure 2(a) shows the PSDs of 2009 wind power output for all four regions and their aggregate as well as a reference Kaimal spectrum (the expected PSD for a single wind plant, here normalized to the summed data). At frequencies higher than (24 h)−1, the aggregated regions show less variability relative to lower frequencies than the reference Kaimal spectrum, as do the individual regions (whose reference Kaimal spectra are not shown). This smoothing pattern is the result of interconnection of individual wind plants within each region, whose power output shows less correlation at high frequencies than at low frequencies.
The similarity of the PSD curves in log-space in figure 2(a) suggests that variability reduction due to interconnection takes place uniformly across all frequencies examined and that interconnection of regions, unlike interconnection of just a few wind plants, does not reduce the ratio of high- to low-frequency variability for the range of frequencies examined. This effect can be quantified by the slopes of log PSDs in the range of (24 h)−1 to (2 h)−1 (corresponding to the inertial subrange), which reflect the relative variability of power output at the frequencies within that range. Slopes of less than − 5/3 (the value for a single wind plant) indicate smoothing at higher frequencies due to geographical diversity of interconnected wind plants. The slopes of the log PSDs for individual and interconnected regions are shown in figure 2(b).
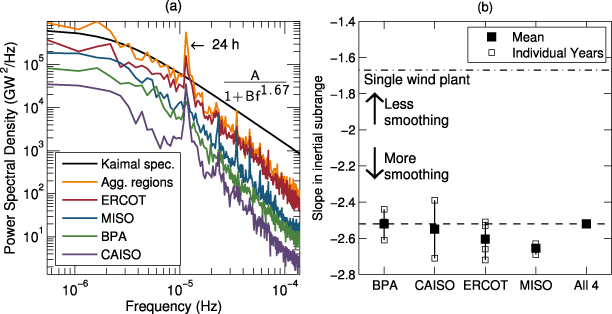
Figure 2. (a) PSDs for 2009 wind power output of each region and the aggregate of all four regions plotted on log–log axes. The displayed Kaimal spectrum equation approximates the PSD for a single wind plant (fitted parameters are A = 5.84 × 10⁵ and B = 2.06 × 10⁹). In the inertial subrange (frequencies higher than (24 h)−1), the summed power output shows less variability than that of a single wind plant. The legend lists data as they appear from top to bottom. (b) Slopes in the inertial subrange for each region and the interconnected regions for all years of available data and the means over time. The slope for the interconnected regions in 2009 is within the range of slopes for individual regions in other years for which data were available.
Download figure:
Standard imageF-tests were used to evaluate the null hypothesis that the PSD slopes in the inertial subrange were the same for individual regions as for combinations of regions. For each group of regions except BPA and CAISO, the null hypothesis failed to be rejected at the 5% significance level for at least one of the regions tested against the aggregate. The slope in the inertial subrange for BPA combined with CAISO ( − 2.61) was significantly different from those of both BPA ( − 2.51) and CAISO ( − 2.71). In all cases, although interconnection would reduce variability at all frequencies examined, it would not reduce the slope in the inertial subrange compared with each of its constituent regions. This result indicates that interconnection across regions would not change the proportions of fast- and slow-ramping resources necessary to balance wind power output, and that interconnecting more wind plants within the same region could similarly reduce variability and incur much lower transmission cost.
Figure 2(b) shows that the log slopes of PSD estimates in the inertial subrange can vary between years, implying that the mix of generators, storage and demand response necessary to compensate for variability of a given amount of wind power can differ from year to year. For the years with data available, these differences are significant at the 5% level for BPA and CAISO but not for MISO. For ERCOT, differences between years tend to be significant, with the exception of 2007/2010 and 2008/2009.
The PSD slope for BPA wind power output was greater than or equal to that of the other regions for each year examined, indicating comparatively less smoothing due to interconnection of wind plants within BPA. The proximity of the BPA wind plants could expose them to similar weather patterns, limiting the degree of smoothing as a result of interconnection. This effect could also help explain the higher coefficient of variation for BPA than for the other regions.
To summarize, our results suggest that interconnecting multiple wind plants across the four US regions examined would smooth wind power output at all frequencies examined (as quantified by the coefficient of variation; see supporting information S1.4 available at stacks.iop.org/ERL/7/034017/mmedia). Interconnection would not, however, reduce the ratio of high-frequency to low-frequency variability in wind power output beyond the reduction found by Katzenstein et al (2010) for ERCOT wind plants.
3.2. Wind power duration curve
Figure 3 shows a duration curve for 2009 wind power output. Adopting the definition of 'firm power' from Katzenstein et al (2010) as capacity available 79–92% of the time, we find that the interconnected regions have the greatest amount of firm power, with 17% of installed wind capacity available 79% of the time and 12% of capacity available 92% of the time. MISO, the region with the firmest wind power output as well as the least likelihood of extreme hourly step changes and lowest slope in the inertial subrange, had 13% of capacity available 79% of the time and 6% of capacity available 92% of the time. BPA had the least amount of firm wind power, with only 2% and 0.2% of capacity available at the ends of the firm power range, consistent with the finding of Katzenstein et al (2010) for 2008 data (3% and 0.5%). For 2008 ERCOT data, Katzenstein et al (2010) found 10% and 3% of installed capacity available at the limits of the firm power range; for 2009 data, we find 10% and 4%. While interconnection of all four regions would at least double the fraction of capacity available 92% of the time in each region, the gain in firm power (which amounts to approximately 1.5 GW above the sum of that of the individual regions) is unlikely to be sufficient to cover the cost of necessary transmission capacity.

Figure 3. Duration curve for 2009 wind power output. The interconnected regions show the greatest percentage of firm power (capacity available 79–92% of the time) and BPA the least.
Download figure:
Standard image3.3. Step change analysis and balancing cost comparison
Step changes of wind power output were calculated as the difference between power output in consecutive hours as a fraction of installed capacity. Interconnection of all four regions was found to produce negligible additional reduction in mean step changes compared with that achieved in a single region. BPA and ERCOT have the highest likelihood of large hourly step changes and MISO and the aggregated regions the lowest (see supporting information S1.5 available at stacks.iop.org/ERL/7/034017/mmedia).
We wish to evaluate the cost-effectiveness of smoothing wind power output with increased transmission capacity between the regions with the greatest wind variability, BPA and ERCOT. We calculate the length of high-voltage transmission with cost equivalent to that of a peaking gas turbine sized to mitigate negative 99th percentile step changes in BPA and ERCOT, plus a combined-cycle gas turbine providing firm capacity equivalent to what the interconnected regional wind power output could provide. We find that the cost of the gas turbines would only cover 490–740 miles of transmission capacity (630–960 miles if emissions damages are included), whereas BPA and ERCOT are separated by 1400 miles (see supporting information S1.7 available at stacks.iop.org/ERL/7/034017/mmedia for details of the cost calculation). This first-order analysis suggests that local gas is a more cost-effective method of balancing low-probability step changes and providing firm power than increased transmission capacity.
4. Discussion and conclusion
Frequency-domain analysis shows that fluctuations in wind power are not white noise. Fluctuations in aggregate regional wind power output are between three and five orders of magnitude stronger at daily frequencies than at hourly frequencies (see figure 2). The relative strength of low-frequency fluctuations of wind power output yields the important result that wind power can be balanced to a large extent by slow-ramping generators such as coal plants and combined-cycle natural gas plants.
Interconnection of wind plants within a single region would further reduce the ratio of fast- to slow-ramping generators necessary to balance wind power output, since across short distances wind's high-frequency fluctuations cancel each other more effectively than its low-frequency fluctuations. Our work demonstrates that interconnection of aggregate regional wind power output would provide no further reduction in the ratio of high- to low-frequency fluctuations, and therefore the ratio of fast- to slow-ramping generators in the balancing portfolio, than the reduction obtained from interconnecting wind plants within a region.
Nevertheless, benefits of interconnecting aggregate regional wind plants include variability reduction at all frequencies examined (as measured by the coefficient of variation), reduction in the likelihood of extreme step changes in wind power output, and doubling of the fraction of wind capacity available 92% of the time compared with the maximum of the single regions.
BPA is the region that would benefit most from interconnection with other regions. However, BPA is also the only region with substantial hydropower capacity, including pumped storage. Hydropower is a low-emissions technology that ramps quickly enough to follow fluctuations in wind power output, and may be a more successful and cost-effective method for integrating BPA wind power than long-distance interconnection.
Net load (load minus wind generation) shows the same relative proportions of high- and low-frequency fluctuations regardless of wind capacity, such that the proportion of balancing resources required to compensate for wind variability will be roughly constant as wind capacity grows (see supporting information S2 available at stacks.iop.org/ERL/7/034017/mmedia). This finding supports the treatment of wind power as negative load.
A first-order analysis shows that for BPA and ERCOT, the cost of mitigating wind's low-probability step changes and providing equivalent firm power is considerably lower with natural gas turbines than with interconnection of aggregate regional wind plants.
The availability of higher resolution data over a longer time span would refine these conclusions, although the consistency of the findings and their similarity across 2008 and 2009 argue for the robustness of the principal conclusions.
Acknowledgments
The authors thank Mark Handschy for useful comments and conversations. This work was supported by the National Science Foundation (NSF) Graduate Research Fellowship Program, grants from the Alfred P Sloan Foundation and Electric Power Research Institute (EPRI) to the Carnegie Mellon Electricity Industry Center, the Doris Duke Charitable Foundation, the R K Mellon Foundation, and the Heinz Endowments to the RenewElec program at Carnegie Mellon University, and the US National Science Foundation under Award no. SES-0949710 to the Climate and Energy Decision Making Center.