


Abstract
Previous regional studies in Siberia have demonstrated climate warming and associated changes in distribution of vegetation and forest types, starting at the end of the 20th century. In this study we used two regional bioclimatic envelope models to simulate potential changes in forest types distribution and developed new regression models to simulate changes in stand height in tablelands and southern mountains of central Siberia under warming 21st century climate. Stand height models were based on forest inventory data (2850 plots). The forest type and stand height maps were superimposed to identify how heights would change in different forest types in future climates. Climate projections from the general circulation model Hadley HadCM3 for emission scenarios B1 and A2 for 2080s were paired with the regional bioclimatic models. Under the harsh A2 scenario, simulated changes included: a 80%–90% decrease in forest-tundra and tundra, a 30% decrease in forest area, a ∼400% increase in forest-steppe, and a 2200% increase in steppe, forest-steppe and steppe would cover 55% of central Siberia. Under sufficiently moist conditions, the southern and middle taiga were simulated to benefit from 21st century climate warming. Habitats suitable for highly-productive forests (≥30–40 m stand height) were simulated to increase at the expense of less productive forests (10–20 m). In response to the more extreme A2 climate the area of these highly-productive forests would increase 10%–25%. Stand height increases of 10 m were simulated over 35%–50% of the current forest area in central Siberia. In the extremely warm A2 climate scenario, the tall trees (25–30 m) would occur over 8%–12% of area in all forest types except forest-tundra by the end of the century. In forest-steppe, trees of 30–40 m may cover some 15% of the area under sufficient moisture.
Export citation and abstract BibTeX RIS

Original content from this work may be used under the terms of the Creative Commons Attribution 3.0 licence. Any further distribution of this work must maintain attribution to the author(s) and the title of the work, journal citation and DOI.
1. Introduction
Climate warming directly impacts and accelerates natural processes that indirectly affect land-cover transformations. Drivers of vegetation change include climate and extreme weather events, wildland fire, insect infestation, forest diseases, and legal and illegal harvest activities (see review Soja et al 2007, Schapphof et al 2016). Extensive transformations of boreal vegetation and forest cover are currently being observed at regional (Kharuk et al 2011, Petrov et al 2015) to global (Gauthier et al 2015) scales. Loss in area of boreal forest (due largely to fire and logging) has been second only to losses of tropical forest (Hansen et al 2013). Permafrost is an important factor in northern landscapes, particularly in Siberia, and changes in active layer depth affect boreal ecosystem functions (Cable et al 2014) and structure and productivity, e. g. after wildfire (Abaimov et al 2002, Brown et al 2015). Although Siberia has been affected by anthropogenic disturbance less than in Europe, however only 30% of the climax forest remains intact (Isaev et al 1995, Sokolov 1997, Atlas 2002). Secondary forests composed of hardwoods currently may replace conifer forests under anthropogenic stress (Achard et al 2005). Moreover, habitat suitability for the forest area has been projected to decrease by 30%–40% by the end of this century in a warming climate (Krankina et al 1997, Tchebakova et al 2009a).
Significant climate change by the end of the 20th century has been documented across Siberia from the Ural mountains to Transbaikalia (Shiyatov et al 2001, Bazhenova and Martyanova 2000, Efimova et al 2004, Gruza and Rankova 2004, Zinchenko et al 2004). For central Siberia, Tchebakova et al (2011) showed that between the baseline period of 1960–1990 and the period of 1991–2010, average winter temperatures increased by 2 °C–3 °C in the north and 1 °C–2 °C in the south, and summer temperatures increased by 1 °C in the north and 1 °C–2 °C in the south. Precipitation increased an average of 10% in central Siberia, and decreased 10%–20% in the southern mountains. The cumulative effect of these changes has resulted in local drying in already dry steppe landscapes at the border with Mongolia because increased rainfall was not sufficient to make up for increased evaporative demand.
Current carbon stocks and fluxes that are major characteristics of forest productivity have been broadly investigated across Russia, the vast region of Siberia and smaller regions like central Siberia or Yakutia (Shvidenko and Nilsson 2003, Shvidenko et al 2013). Various methods have been used including: an inventory-based full carbon accounting approach (Shvidenko and Nilsson 2003), atmospheric inversion and dynamic vegetation models (Quegan et al 2011), and eddy covariance and inversion methods (Dolman et al 2012). One important factor that drives changes in carbon stocks and fluxes is changing forest growth or productivity, which have often been related to changes in temperature, rainfall, and other climate parameters.
Climate-change related research on forest productivity is limited for Siberia, and particularly for central Siberia. Lapenis et al (2005) used historical inventory data to show that forest production (C-stock) in the Siberian boreal had increased with increasing temperature by the end of the 20th century. Model-based phytomass projections suggest further temperature-related increases by the end of the 21st century (Monserud et al 1996a). However, recent research based on eddy-covariance measurements indicated that some boreal forest areas may be in transition from a C sink to a C-source, likely due to thawing permafrost that may release much carbon in ongoing climate warming (Dolman et al 2012, Gauthier et al 2015).
In central Siberia, there are only a few model-based predictions of forest biomass change in a changing climate. Stakanov et al (2002) analyzed current inventory data and allometric relationships along the north to south temperature gradient across forest zones in the Krasnoyarsk territory, from sparse northern taiga with minimal C-stocks to middle and southern taiga with maximal C-stocks. Based on calculated carbon stock change (ton C) per 1 °C of temperature change, they indirectly predicted that increased mean annual temperature in the future would increase the forest productivity in southern and middle taiga, but the central Siberian taiga would remain a C-sink.
Using two IPCC climate change scenarios, Tchebakova et al (2002) estimated a 25% phytomass increase by 2090 under the moderate (B2) scenario due to an expansion of light-needled (larch and Scots pine) subtaiga and southern taiga in central Siberia. Central Siberia as a whole would remain a C-sink under this scenario, although C-stock in northern vegetation types (e.g. northern taiga) would decrease because their area would shrink by the end of the century.
Gustafson et al (2010) modeled the relative effects of climate change and other disturbances (timber harvesting, fire and insect outbreaks) on forest composition and biomass (carbon) at a landscape level in the transition zone between southern and middle taiga in south-central Siberia. They concluded that climate change would increase tree productivity, but this effect would not be as significant as timber harvest and potential damage from the Siberian silk moth.
These results of various studies for central Siberia may not be readily comparable, as they cover different geographic areas and differ in goals and methods. More research and model improvement are needed to develop consistent projections across the central Siberian region.
In Tchebakova et al (2011) we modeled climate-induced hot spots (areas of change between forest and non-forest) from observed data before 2010 and then used HadleyCM3 A2 and B1 scenarios to make projections for 2020. In the current paper, we extend the previous work with projections to the 2080s to simulate the potential shifts in suitable habitat for the major forest vegetation types and changes in their structure and productivity by the end of the 21st century. We seek to understand how much climate change may impact forest type distribution, structure and productivity. Understanding such changes would help to evaluate and mitigate the potential consequences of climate change for forest resources and services in the near future.
Our goals were (1) to predict potential changes in suitable habitats for the dominant climax forest types of central Siberia under two different climate scenarios using a simplified Forest Type Model (FTM) developed from the Siberian bioclimatic model, SiBCliM (Tchebakova et al 2009a), and the montane bioclimatic model, MontBCliM (Tchebakova et al 2009b); (2) to develop and test climate-based stand height models and apply them to predict the stand height as an indicator of forest productivity under potential habitat conditions in a changing climate, and (3) to link these models to predict the distribution and stand heights of major Siberian forest types in the 2080s.
2. Materials and methods
2.1. Geography
The study area is the Krasnoyarsk territory and the adjacent Sayan Mountains to the south in central Siberia (figure 1). The Yenisei River, which flows north from the Sayan Mountains to the Arctic Ocean, divides the Krasnoyarsk territory (north of 56°N) into the flat and boggy West Siberia Plain on the west , and the elevated Central Siberian Tableland to the east. The Sayan Mountains dominate the area south of 56°N. The study region stretches for about 2500 km from the Mongolia border to the Arctic Ocean and encompasses some 2 340 000 sq. km, about the area of the five largest countries of Europe outside of Russia: Ukraine, France, Spain, Sweden, and Norway (Ushakova 2006).
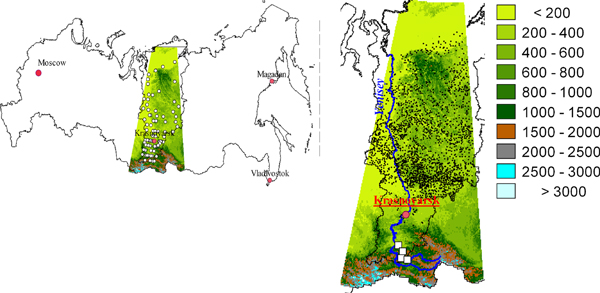
Figure 1. (a) Location of the study area in central Siberia between 85–105°E and 49–75°N within Russia. White dots are 80 weather stations; (b) study area overlaid on map of Krasnoyarsk territory (scale shows elevation, m ASL). Small black dots are inventory plots across the lowland plains and tablelands; white squares indicate the inventory transect across the southern mountains.
Download figure:
Standard image High-resolution image2.2. Forest cover
The study area crosses latitudinal vegetation zones from Arctic tundra and forest-tundra to the north, through several types of taiga, to forest-steppe and steppe to the south and in the foothills of the Sayan Mountains (figure 2(A)). Across the Sayan Mountains, the vegetation is in altitudinal belts described later in the paper. The permafrost border is at about 62°N; about 2/3 of the study region is within the permafrost zone and 1/3 is outside the permafrost zone. Permafrost occurrence and active layer depth are crucial controlling factors for forest distribution, growth, structure, and composition in Siberia (Shumilova 1962). Only one Siberian tree species, Dahurian larch can survive on permafrost with an active layer depth of less than 2 m (Pozdnyakov 1993, Abaimov et al 2002). Larix dahurica split in L. gmelinii and L.cajanderi (Abaimov 2010), hereafter is called Gmelin larch that occurs in central Siberia; Cajander larch occurs in East Siberia.

Figure 2. Actual (A) and modeled forest type distributions in the contemporary (B) and B1 (C) and A2 (D) 2080s climates in central Siberia. Forest type: 2. forest-tundra, 3. dark-needled, 4. light-needled, 5. 'chern', 6. forest-steppe; Non-forest type: 1. tundra, 7. steppe.
Download figure:
Standard image High-resolution imageThe central Siberian forests were classified into four forest zones by Korotkov (1998): forest-tundra and sparse taiga, northern taiga, middle taiga, and southern taiga. Taiga can consist of both dark-needled and light-ed species. Dark-needled species, which are shade-tolerant and water-loving include Pinus sibirica Du Tour (Siberian pine), Abies sibirica Ledeb. (Siberian fir), and Picea obovata Ledeb. (Siberian spruce). Light-needled species include the more shade intolerant and water-stress resistant Larix sibirica Ledeb., L. x czekanowskii Szaf. and L. gmelinii (Rupr.) Rupr. (larches) and Pinus sylvestris L (Scots pine). The general structure of the central Siberian forests over tablelands and mountains was compiled from Pleshikov (2002) and Polikarpov et al (1986) (table 1, supplementary). The conifer stands of the forest-tundra and northern taiga in the wide valley of the Yenisei River on the West Siberian Plain are dominated mostly by Siberian larch (50%) and Scots pine (30%). On the permafrost in the Central Siberian Tableland, Gmelin larch dominates 92% of the forests. In the middle and southern taiga, the dark-needled conifers (Siberian pine, fir and spruce) dominate the forests south of the permafrost zone and Gmelin larch dominates on permafrost. Scots pine occurs on warm sandy soils primarily in wide river valleys in absence of permafrost or where the active layer depth is >2 m.
Forest stands of the middle taiga are dominated by conifers (84.6%) and hardwoods (15.4%). About 76% of the coniferous forest area is covered by light-needled forest composed of larches (65% (Siberian larch, Czekanowskii larch, and Gmelin larch) and Scots pine (11%). Dark-needled forests are dominated by Siberian spruce (9.4%), Siberian pine (8.6%), and Siberian fir (5.6%). The hardwood species are birch (Betula pendula, 89% of the hardwoods area), and aspen (Populus tremula, 11%).
In the Sayan Mountains, the forests were classified into altitudinal zones (belts). Starting in the foothills on the windward northern slopes, we find light-needled (Scots pine) and birch subtaiga, which are replaced as elevation increases by lush dark-needled chern ('chern' is the Russian word for black) forests, consisting of Siberian pine, fir, and aspen. These are productive forests, rich in flora, including some tertiary species and ferns (a Siberian analog to European temperate mixed conifer-broadleaved forests in the Russian geobotanical classifications) in moist lowlands. Further upslope, chern is replaced by dark-needled taiga of Siberian cedar, fir, and spruce and subalpine forest upslope, ending with tundra in the highlands.
On leeward southern slopes, the sequence of forest types moving downslope from the highlands is Siberian pine mixed with Siberian larch at high elevations, followed by light-needled Siberian larch. Scots pine taiga at middle elevations is quickly succeeded by montane steppe and semidesert in the dry climate close to Mongolia (Smagin et al 1980).
On windward northern slopes, the forests are dominated by dark-needled species of Siberian fir (∼50%) and Siberian pine (∼30%). Spruce covers only 2% of the montane area. On leeward slopes, light-needled tree species dominate the forests: Siberian larch (45%–80%) and pine (10%) and the hardwoods birch and aspen (up to 40%) in the lowlands; dark-needled Siberian pine (10%) occurs at the highest elevations).
2.3. Forest data
Forest stand heights were derived from 1700 inventory plots distributed north of 56°N latitude and 1150 inventory plots in the southern mountains south of 56°N (figure 1). Data for the five most dominant conifers: Siberian pine, Siberian fir, Siberian and Gmelin larches, and Scots pine were included in the models. According to Russian Inventory methods, forest composition is measured by relative volume of each tree species, and stand height is measured from 3–5 trees for each tree species in the overstory, with not less than 10 sample trees in a plot. Only mature forest stands older than 150 year old were used in our analyses, as height growth curves for the major Siberian species become close to asymptotic by this age (maximum heights, figure 1 supplementary). Such sites characterize the climax (terminal succession) stage of the forest development that is in a long-term equilibrium with the environment before a disturbance (Clements 1904).
From 56° to 60°N latitude, height data were obtained from ground measured plots inventoried from 1980 to 2003 (State Forest Inventory). Inventory specialists then extrapolated data from these plots to homogeneous polygons averaging 10 000 ha. North of 60°N latitude, we used MODIS multispectral imagery from 1999 to 2003 to identify spatially homogeneous areas based on RGB-composites (NIR-R-G and MIR-NIR-R) and topography (elevation and slope). The average size was 10 000 ha. The forest experts of V.N. Sukachev Institute of Forests, Krasnoyarsk, Siberia, constructed stand characteristics (e.g. heights) within these identified spatially homogeneous areas using limited historical inventory data, field data and extensively reviewed literature.
South of 56°N in the mountains, inventory plots were obtained within a 20 km wide transect along the elevation gradient of the major watershed of the Osevoi Range. This is a representative transect that includes major patterns in climate and forest structure and composition along the elevation gradient across the Sayan mountains that have been previously described by Siberian geobotanists (Smagin et al 1980). These 1150 ground-measured plots were inventoried before 1973 (State Forest Inventory). The plot size was 5–35 ha.
2.4. Climate data
Mean January and July temperatures and mean annual precipitation were collated from 80 weather stations within the study area for the period before 1960 (Reference Books on Climate 1967–1970) and monthly January and July temperatures and annual precipitation were collated from the same stations for 1961–1990, the baseline period, (Monthly Reference Books on Climate1961–2010). These variables were used to calculate three bioclimatic indices that were used in SiBCliM to predict thermal conditions for the summer (growing degree-days above 5 °C, GDD5) and winter (negative degree-days (NDDs) below 0 °C, NDD) , and an annual moisture index (AMI), calculated as the ratio of GDD5 to annual precipitation. GDD5 was calculated from the July temperature (R2 = 0.9) and NDD was calculated from the January temperature (R2 = 0.96) using linear regressions constructed for the whole of Siberia (see for detail Tchebakova et al 2009a).
Contemporary GIS-layers of climatic variables over the study area were interpolated using Hutchinson's (2000) ANUSPLIN, a procedure that uses thin-plate smoothing splines for the interpolation. Climatic variables for each inventory plot over plains and tablelands (>56°N) were averaged from 100 or more pixels of 0.01*0.01 degree resolution. Across the southern mountains (<56°N), one value of a climatic variable for each plot was determined using environmental lapse rates. These were calculated from weather station data located along the transect (Polikarpov et al 1986).
2.5. Climate change scenarios
We used two climate change scenarios, the HadCM3 A2 and B1, of the Hadley Centre in the UK (www.ipcc-data.org). These two scenarios represent the highest (A2) and the lowest (B1) projected temperature increases by the end of the 21st century. The HadCM3 global climate model (GCM) is one of 23 climate models included in the AR4 IPCC report (IPCC 2007). The HadCM3 as a GCM with high greenhouse gas sensitivity tends to simulate global surface air temperature time series that are above-average relative to the 23 GCMs- multi-model (ensemble) mean series for the period 2000–2100 (IPCC 2007, figure 10.5 p 763). Over Northern Eurasia, however, the Hadley GCMs estimate annual and seasonal temperatures from 1901 to 2005 with minimal biases relative to the 23 AR5 GCMs (Miao et al 2014). Among 16 AR4 GCMs, the HadCM3 was ranked as the 8th GCM by a complex model quality index. The quality index represented a sum of the RMS errors of four variables (sea-level pressure, sea surface temperature, near-surface air temperature over the continents, and precipitation) each of which was normalized by the RMS errors of the corresponding ensemble mean for 1980–1999 (Meleshko et al 2008).
In the absence of such assessments for our much smaller region in central Siberia, we estimated the 1960–1990 July temperatures over the forest area in the study region (7380 pixels of the 0.25° × 0.25° resolution) from HadCM3-simulated July temperatures (www.ipcc-data.org) and compared these temperatures to the observed data (www.cru.uea.ac.uk). Observed July temperatures averaged over the whole study region were 14.6 compared to 14.1 °C for simulated temperatures. Differences in the range from −3.0 °C to 0 °C accounted for 57% of the values and the differences in the range from 0 °C to 3.0 °C accounted for 31.6% (figure 2, supplementary). Thus, the HadCM3 simulated lower July temperatures than those observed over the study area. The greatest differences were over mountainous territories (both in the north and south) caused evidently by sparse data that led to poor interpolation results.
Based on IPCC data (ipcc.data.org) we calculated the HadCM3-simulated July temperatures from the 1960–1990 period to 2080 and compared those to the ensemble mean of 18 AR4 GCMs July temperatures over the study region (figure 3, supplementary). The HadCM3-modeled July temperature increase by 2080 was 3.3 °C compared to the ensemble mean 2.21 °C ± 1.03 °C in the B1 climate and the change was 5.95 °C compared to the ensemble average 4.14 °C ± 1.47 °C in the A2 climate.
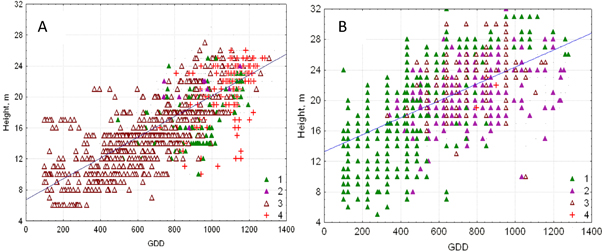
Figure 3. Relationships between stand heights and growing degree-days, base 5 °C, over plains and tablelands (A) and southern mountains (B) in central Siberia. The plot symbols stand for a dominant tree species: 1—Pinus sibirica, 2—Abies sibirica, 3—Larix spp. (L. sibirica and gmelini), 4—Pinus sylvestris.
Download figure:
Standard image High-resolution imageAcross the study area, the projected temperature changes for the A2 and B1 scenarios from the baseline 1960–1990 period to the 2080s differ from each other significantly. The range of January temperature anomalies is 3 °C–9 °C in the A2 and 2 °C–6 °C in B1; July temperature change is 4.5 °C–8 °C in the A2 and 1.5 °C–4.5 °C in the B1. Precipitation increases 10%–20% across the study area except the very south by the 2080s in both scenarios.
We interpolated the anomalies of January and July temperature and annual precipitation of 2080s using the Surfer software (www.goldensoftware.com) and added them to the baseline climatic maps. These interpolated July and January temperatures and precipitation were used to calculate the bioclimatic indices (GDD5, NDD, and AMI) at 2080s.
2.6. Bioclimatic vegetation models
We constructed a FTM for the entire study region by combining two bioclimatic vegetation models: the Siberian bioclimatic model, SiBCliM (Tchebakova et al 2009a) developed for the plains and tablelands, and the Montane Bioclimatic model, MontBCliM (Tchebakova et al 2009b) developed for the southern mountains. SiBCliM is a static large-scale bioclimatic envelope model that predicts zonal vegetation as function of GDD5, NDD, AMI and presence/absence of continuous permafrost (characterized by active layer depth (maximum seasonal thaw depth), ALD). ALD > 2 m is explicitly included in SiBCliM as a factor limiting the forest-types and tree-species distributions on permafrost. Permafrost plays an important role to provide additional to rainfall water for forests to grow in the dry climate of interior Siberia and to keep surplus water in the soil until the next summer (Sugimoto et al 2002). In the absence of thawed water from permafrost, the forest would not occur and be replaced by grasslands (Shumilova 1962, Pozdnyakov 1993). We calculated the current position of ALD = 2 m from the permafrost map of Malevsky-Malevich et al (2001) as function of July and January temperatures and annual precipitation (R2 = 0.70). Stefan's theoretical equation (Stendel and Christensen 2002) was used to calculate and map the future permafrost border (figure 4(D), supplementary). In the model, the permafrost border limited the northward distribution of all forest types except one that was composed of Gmelin larch, which is able to grow on permafrost with an ALD of 2 m or less (Pozdnyakov 1993).
SiBCliM uses the vegetation classification of Shumilova (1962). Specific climatic thresholds representing climate envelopes for each forest type in SibCliM are defined from the vegetation ordination of 150 weather stations over Siberia in the multidimensional space of GDD5, NDD0, and AMI (Tchebakova et al 2009a, 2010a, 2010b). In this ordination, each weather station was classified by a certain forest type based on compiled information from landcover maps, publications and our field experience.
GDD5 separated tundra and all forest subzones: forest-tundra; northern taiga; middle taiga; southern taiga; subtaiga; broadleaved and forest-steppe. In the current study, we combined latitudinal forest zones of northern, middle and southern taiga classes into one class—taiga. The AMI then separated vegetation into three major types: forest, steppe, and semidesert and also separated the forest into dark- and light-needled conifer forests. Additionally, NDDs of −3500 °C to −4000 °C, corresponded well to the permafrost boundary and separated dark- and light-needled conifer forests.
SibCliM includes four temperate vegetation types (broadleaf forest, forest-steppe, steppe and semidesert) that are not currently found in Siberia but are of potential importance in a warmer climate. The lower GDD5 thresholds for these classes were the upper thresholds for Siberian vegetation. The AMI thresholds between forest, steppe and semidesert were the same as in Siberian vegetation over the boreal zone (Tchebakova et al 2010a, 2010b).
MontBCliM (Tchebakova et al 2009b) is a similar bioclimatic envelope model developed to predict suitable habitats for mountain vegetation in southern Siberia (LAT < 56°N). It is based on the same climatic indices (GDD5, NDD, and AMI), but does not include permafrost, which is not a forest-forming factor in the southern Siberia mountains. The montane vegetation classification of Smagin et al (1980) for the Altai-Sayan Mountains was used in the model. Specific climatic thresholds representing climate envelopes for each forest type in MontBCliM were defined from the vegetation ordination of 50 weather stations over the southern mountains in the space of GDD5, NDD0, and AMI (Tchebakova et al 2009b, 2010b). GDD5 separated tundra, subalpine, middle-elevation taiga, forest-steppe and steppe elevation belts. AMI separated forest and grasslands (steppe and semidesert) and also separated the forest into dark- and light-needled conifer forests. In the mountains, there are two classes that do not occur on the northern plains: (1) 'chern' taiga, which is a variant of dark-needled forest that occurs in moist and warm windward foothills and is characterized by a high biodiversity of prevailing tall herbs and ferns in the ground layer in contrast to prevailing mosses and lichens in the taiga forest ground layer and (2) tundra-steppe (or cryosteppe) that includes both steppe and tundra flora and occurs in cold and dry highlands.
We aggregated detailed forest types in both SiBCliM and MontBCliM into FTM with seven classes: tundra, forest-tundra, dark-needled and light-needled taiga, 'chern' taiga, forest-steppe, and steppe to apply these uniform classes across the entire study area. Forested land was defined to be places where AMI < 3.3 in the southern mountain foothills and where GDD5 > 300 °C in the northern tablelands and southern mountain highlands.
2.7. Bioclimatic forest stand height models (FHM)
Two separate climate-based forest stand height models (FHM) were constructed for the northern plains and tablelands and for the southern mountains. The FHMs were simple linear regression models relating mean stand height of forests composed of different species to climatic indices: GDD5, NDD, and AMI (table 1). Over the plains, each of these three indices explained ∼50%–63% of the height variation. In the mountains, GDD5 and AMI explained less variation – ∼20%–38%—due to scarce climate data and thus poor data interpolation over a complex terrain. NDD did not play a role in the height variation. Winter temperatures and NDD depend to a large extent on montane microrelief features that create frost pockets, temperature inversion, etc. Thus, shorter heights in uplands were related to milder winter conditions, whereas taller heights were related to severe winter conditions in lowlands resulting in negative correlation coefficients.
Table 1. Correlation coefficients between stand height (H) and climatic predictors: GDD5 (growing degree-days), AMI (annual moisture index), and NDD (negative degree-days).
| Tablelands | Mountains | ||||||||
|---|---|---|---|---|---|---|---|---|---|
| Parameter | H | GDD5 | AMI | NDD | Parameter | H | GDD5 | AMI | NDD |
| H | 1.0 | 0.79 | 0.69 | 0.69 | H | 1.0 | 0.62 | 0.44 | −0.19 |
| GDD5 | 1.0 | 0.88 | 0.73 | GDD5 | 1.0 | 0.81 | −0.22 | ||
| AMI | 1.0 | 0.43 | AMI | 1.0 | −0.61 | ||||
| NDD | 1.0 | NDD | 1.0 | ||||||
Moreover, the collinearity between each pair of model regressors was high, especially between GDD5 and AMI, because AMI is a function of GDD5. The correlation coefficient between these regressors was 0.88 in the plains and 0.81 in the mountains (table 1). Thus, we simplified the equations to use only GDD5, which explained the largest variation in the heights in both central Siberia's plains and tablelands (63% of the height variation (equation (1))), and in the Sayan mountains (38% of the height variation (equation (2))).


Some lack of water reduced stand height at GDD5 ∼ 1300 °C in the southern forest-steppe border (figure 3). To address this reduction, adding the term (GDD5)2 in equations (1) and (2) explained an additional 4% of the height variation in the mountain model and 1% in the plain model. The logarithmic (log GDD5) height model additionally explained 3% and 1% of the height variation correspondingly. We tested the linear, quadratic and logarithmic height models in warmer climates in the south of Ukraine and European Russia. We compared these three model predictions to actual stand heights using an extensive inventory data set across Eurasia (Usoltsev 2001). The relative errors were 10% of the linear model, −15% of the logarithmic model and up to −60% in the quadratic model (table 2). We concluded that the linear FHMs predicted stand heights reasonably well compared to other tested models. Good fit was also found for the log-GDD5 model that showed a small decrease in tree growth due to decreasing moisture as GDD5 increases. Note, that both FHMs were only applied within the area of projected forest distribution, which was limited by AMI < 3.3.
Table 2. Testing height models (linear, logarithmic, and quadratic) against measured data in contemporary warmer climates in southern European Russia and Ukraine.
| GDD5, °C | Measured, heights, m | Predicted heights, m linear | Relative error, % | Predicted heights, m logarithmic | Relative error, % | Predicted heights, m quadratic | Relative error, % |
|---|---|---|---|---|---|---|---|
| 2020s | 31.5–33 | 35.5 | 10 | 27.7 | −14 | 14.4 | −55 |
| 2080s | 32–33.5 | 36 | 10 | 27.8 | −15 | 13.4 | −59 |
Thus, FHMs paired with current climate and the climate change projections at 2080s represented forest height distributions within the forest range in a warming climate by the end of the 21st century in central Siberia.
2.8. Model comparison
Kappa (K) statistics (Landis and Koch 1977, Monserud and Leemans 1992) were used to compare the modeled and independent maps based on measurements of (1) forest types and (2) forest stand heights in order to compare our FTM and the two FHMs performance, correspondingly. For comparing forest types, the landscape map of Isachenko et al (1988) was used for the plain area north of 56°N and the landscape map of Samoylova (2001) was used for the montane area south of 56°N. The lidar-based forest canopy height map of Simard et al (2011) was used for comparing modeled forest stand heights.
K-statistics show a similarity between the two maps. The K-statistics vary from 1 (complete agreement) to 0 (no agreement) to −1 (disagreement) (Landis and Koch 1977). The modeled and independent maps of forest types and stand heights were compared respectively overall and by separate classes using qualitative descriptors to characterize the degree of agreement: excellent: >0.7; good: 0.55−0.7; fair: 0.4–0.55; poor: <0.4 (Monserud and Leemans 1992).
3. Results
3.1. FTM performance
In central Siberia including both northern plains and tablelands and southern montains, the modeled forest type map was referenced against the combined Isachenko et al (1988) and Samoylova (2001) maps (figures 2(A) and (B)). The maps matched well with an overall kappa k = 0.51, that is close to good (table 3). For major forest types, kappas varied from poor ('chern' forests) to fair (light-needled forests) to very good (dark-needled forests). Chern taiga, which is a specific category that covers a small area, was predicted only 'poor' but its location was predicted correctly (figure 2(B)). The match of both ecotones—forest-tundra and forest-steppe—was poor as transition zones are usually difficult to predict in both size and location.
Table 3. Kappa statistics for the comparison of our FTM-modeled forest types map against the combined vegetation maps of Isachenko (1988) for northern tablelands and Samoylova (2001) for southern mountains as reference maps.
| Biome | Kappa statistics |
|---|---|
| Tundra | 0.81 |
| Forest-tundra | 0.10 |
| Dark-needled | 0.61 |
| Light-needled | 0.49 |
| 'Chern' taiga | 0.24 |
| Forest-steppe | 0.26 |
| Steppe | 0.23 |
| Overall Kappa | 0.51 |
3.2. Climate change
between the pre-1960 and 1960–1990 periods was evaluated based on observed data over the study area. Over the southern portion <56°N, the average July temperature anomaly was 0 °C ± 0.37 °C, the average January temperature anomaly was 1.7 °C ± 1.0 °C, and average annual precipitation anomaly 31 ± 25 mm; over the northern portion, the average July temperature anomaly 0.5 °C ± 0.40 °C, (8% increase) the average January temperature anomaly 1.5 °C ± 1.2 °C, and average annual precipitation anomaly 53 ± 49 mm (10% increase) on the territory >56 °N.
Growing degree-days, base 5 °C, were projected to increase considerably by the 2080s: ∼900 °C in the B1 climate and ∼1200 °C in the A2 climate over current climate below 56°N, and ∼600 °C and ∼900 °C correspondingly above 56°N (figures 4(A) and (B), supplementary). Rainfall was projected to increase 10%–20%, however this increase will not be sufficient to keep AMI stable (figure 4(C), supplementary). Thus, the 21st century climate will be warmer and dryer. Areas with projected GDD5 > 2100 °C (categories 8 and 9, which exceed the validation range of our FHMs) were divided into areas with AMI < 3.3 suitable (pink) and with AMI > 3.3 not suitable (white) for forest. Only 6% of the area potentially suitable for future forest in the 2080s A2 climate and 1% in the 2080s B1 climate were outside the validation range of our FHMs (figure 4(B), supplementary).
3.3. Forest types
Modeled maps of potential major forest type distributions (figures 2(C) and (D)) and stand height distributions (figures 4 and 5) were developed across central Siberia in current and HadCM3 B1 and A2 2080s climates.

Figure 4. Lidar-measured (left) and modeled (right) height (m) distributions in current climate in central Siberia. White line is the contact zone between the northern plains and the southern mountains at ∼56°N latitude. Height key: 1—no forest, 2—0–5 m, 3—5–10 m, 4—10–15 m, 5—15–20 m, 6—20–25 m, 7—25–30 m, 8—>30 m.
Download figure:
Standard image High-resolution image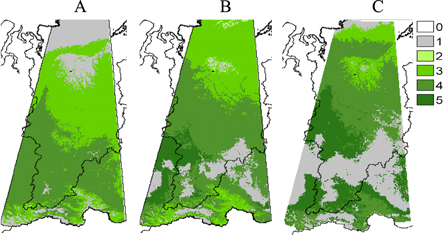
Figure 5. Modeled heights (m) distributions in 1960–90 (A) and B1 (B) and A2 (C ) 2080s climates in central Siberia . Height key. 1—no trees (tundra in the north and steppe in the south), 2—0–10, 3—10–20, 4—20–30, 5—>30.
Download figure:
Standard image High-resolution imageContemporary climatic conditions are about equally favorable for both light-needled and dark-needled forests across central Siberia, and their habitats areas differ by only 8%: 33% for light-needled versus 25% for dark-needled forests (table 4). Dark-needled taiga occupies the most favorable climatic and soil conditions. Light-needled forests are found on dryer and lower nutrient soils. Among light-needled forests, Siberian larch occupies non-frozen and better soils, Gmelin larch is restricted to permafrost sites, and Scots pine is typically found on sandy and boggy soils (Smirnov and Nazimova 1970, Polikarpov et al 1986, Pozdnyakov 1993).
Table 4. Forest type projection of suitable habitat area cover (%) in a warming climate by 2080s.
| Vegetation, forest type | Current | B1 2080s | A2 2080s |
|---|---|---|---|
| Tundra | 23.9 | 11.5 | 2.0 |
| Forest-tundra | 11.4 | 7.3 | 2.4 |
| Dark-needled | 23.8 | 15.6 | 7.4 |
| Light-needled | 32.7 | 25.8 | 24.7 |
| 'Chern' | 1.6 | 2.1 | 8.0 |
| Forest-steppe | 5.3 | 25.6 | 27.8 |
| Steppe | 1.2 | 12.0 | 27.7 |
In the 2080s warmer and dryer climates, the habitat area suitable for forest was projected to decrease from 58% in the contemporry climate to ∼42% in 2080s for both scenarios. Light-needled forests would change by ∼20%–25% in both scenarios; and dark-needled forests—by ∼35% and 70% in B1 and A2 scenarios respectively. The structure of the dark-needled taiga would also change in the A2 climate. The area of 'chern' taiga was projected to increase five-fold (400%) compared to its contemporary area. in the A2 climate. By the 2080s, the suitable habitat for 'chern' taiga was projected to replace that of dark-needled taiga in both mountains and tablelands in sufficiently moist habitats. The area of potential suitable habitat for northern and high-elevation non-forest vegetation types like tundra was projected to decrease by ∼50% and ∼90% in the B1 and A2 climates, respectively. The more heat-loving steppe and forest-steppe vegetation was projected to expand considerably from 6.5% of the study area currently to 38% in B1 and 54% in A2 by the 2080s (table 4).
3.4. Forest stand heights
Our modeled heights were compared to the lidar-based height map of Simard et al (2011) for which height categories were aggregated by 5 m (figure 4) and 10 m. The match between maps appeared to be poor ( κ = 0.30) and fair (κ = 0.40) respectively although the general height patterns were similar, except in the most northern forests and the southern mountains.
The largest mapped height differences were in habitats where Simard et al (2011) showed forests, but FTM predicted non-forest vegetation. These areas were also generally shown as forest on vegetation maps of Russia (e.g. Isachenko et al 1988). Such divergences were associated with cold habitats, e.g., the most northern (∼72°N) Siberian forests or highlands of the southern mountains. Small height differences in the middle latitudes (58–62°N) along the southern edge of the Yenisei Range may result from the sharp elevation transition from the Yenisei valley at 200 m to the raised tableland to the east (700–1100 m). This rapid increase in elevation may affect lidar-based height measurements if not adequately considered in models. Additionally, scarce climate data led to poor interpolation in some areas. Finally, the standard error of estimate (SEE) for stand heights in FHM was ∼3 m. The largest positive differences in heights between two maps were associated with warm habitats in the south, where FHM predicted forests rather than the non-forest shown on the Simard et al (2011) map. Those forests in the forest-steppe and subtaiga zones have been logged since the 19th century for agriculture development (Tchebakova et al 2011), so their natural vegetation (and habitat suitability) would still appropriately be forest.
The modeled rate of height increase per 100 °C GDD5 was 1.3 m in the plains and 1.1 m in the mountains (equations (1) and (2)). Each 100 °C corresponded to a change in distance of ∼200 km along the latitudinal gradient in the plains and to a move upslope of ∼100 m along the elevation gradient in the southern mountains.
In the current climate, the stand heights of mature forests may reach 20 m in middle and northern taiga (>56°N) and 30 m in southern and lowland montane taiga (<56°N) (figure 5). Heights of 30–40 m are currently rare across the central Siberian forests.
In a warming 21st century climate, we project that stand heights may increase up to ≥40 m in southern taiga and lowland 'chern' Siberian pine and fir taiga under both scenarios B1 and A2. The areas covered by these productive stands would be 10% and 25% of the total area in B1 and A2 climates, respectively (table 5). These forests would shift about 500 km northwards on the plains and would move upslope along moist windward slopes in the Sayan Mountains (figures 2(C) and (D)). The area covered by forests of 20–30 m height would not change in the B2 climate and would decrease by 10% in the warmer A2 climate. Forests of 10–20 m heights would cover 50%–75% less area in a warmer climate.
Table 5. Forest area (%) with stands of discrete heights in the contemporary and future B1 and A2 2080s climates.
| Height class, m | 1960–90 | B1 2080s | A2 2080s |
|---|---|---|---|
| Non-forest | 12.6 | 23.7 | 29.7 |
| <10 | 0.0 | 0.0 | 0.0 |
| 10–20 | 44.1 | 20.7 | 9.7 |
| 20–30 | 43.3 | 45.6 | 36.1 |
| 30–40 | 0 | 10.0 | 24.5 |
On the whole, across central Siberia the height increase is predicted to be 10 m for both climate change scenarios. Suitable habitat for forests of this amount of height increase would cover 35% of the area in the B1 scenario and 50% in the A2 scenario, respectively. Additional warming, along with sufficient water supply, under the A2 scenario might lead to a potential stand height increase of up to 20 m on 15% of the area in extreme northern plains and highlands and >20 m in highlands of southern mountains (table 6; figure 5, supplementary).
Table 6. Areas (%) of differences in stand heights between FHM-modeled in the contemporary climate and B1 and A2 2080s climates.
| Height сlass, m | B1 2080s–(1960–90) | A2 2080s–(1960–90) |
|---|---|---|
| <0 | 12.4 | 26.4 |
| 0 | 38.2 | 3.0 |
| 0–10 | 34.5 | 51.0 |
| 10–20 | 13.7 | 15.1 |
| >20 | 1.2 | 4.5 |
3.5. Combined stand heights and forest types
Our FHMs were constructed regardless of the forest composition (dominant tree species) across both plains and mountains (figure 3). However, in the mountains, the tallest heights were associated with dark-needled Siberian pine and fir in the warm 'chern' taiga (GDD5 > 1000 °C). In the plains, the tallest heights were associated with light-needled Siberian larch and Scots pine in the southern taiga. The shortest heights were in cold habitats (GDD5 < 400 °C), where they were associated with Siberian pine in the mountains and Gmelin larch on the plains.
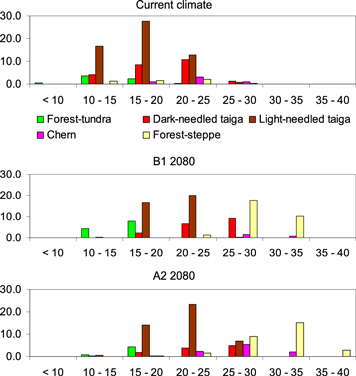
To demonstrate what stand heights would prevail in what forest types we superimposed the forest type and stand height maps for both climate scenarios (figure 6). In the current climate, light-needled (predominantly larch over permafrost) stands of 10–20 m in height dominate over central Siberia. Tall stands over 20 m are equally (>14%) characteristic of both light- and dark-needled forest types. Height over 25 m is rare in current Siberian forests (figure 6 upper). In the warmer B1 climate in the 2080s, most light-needled forests would be 5 m taller −15–25 m of height (figure 6 middle). Most dark-needled forests would be even taller −20–30 m. About 30% of the total forest area would be favorable for tall (25–35 m) trees in forest-steppe. However, the forest coverage is only 20%–30% in contemporary Siberian forest-steppe. First, it has been overexploited for centuries by the people who lived there. Second, patches of forests typically occur in concave microrelief formations where more moisture may accumulate (Polikarpov et al 1986). In the very warm A2 climate at the end of the century, the tall stands (25–30 m) would be equally (8%–12%) represented in all forest types (except forest-tundra). In forest-steppe, trees of 30–40 m might cover some 15% of the area with sufficient moisture (figure 6 lower).
Figure 6. Distributions of areas (% of the total forest area) of different stand height classes in each forest type in current climate (upper) and modeled for 2080s B1 (middle) and A2 (lower) climates over the study region.
Download figure:
Standard image High-resolution image
4. Discussion
Research on the effects of climate change on forest productivity is typically conducted by using either process-based models or statistical regression models. Process-based models evaluate either physiology- and biochemistry-related carbon accumulation in ecosystems (e.g. Melillo et al 1993; BIOME model family, Prentice et al 1992 et seq.; Krinner et al 2005) or forest dynamics-related phytomass accumulation (e. g. Shugart and West 1980, Urban and Shugart 1992, Shuman and Shugart 2009). Regression models relate forest growth parameters such as height/site index (dominant height at an index age) to climate (e.g. Monserud et al 1996b, 2006, 2008, Tchebakova and Parfenova 2003, Messaud and Chen 2010, Weiskittel et al 2011, Sharma et al 2015).
We concentrated on modeling the stand height potential related to climate for mature forests. We applied our models to the 2080s climate scenarios, which are partly outside the climatic range of the regional dataset we used for model calibration. The current range maximum of GDD5 in our study region is <1300 °C. We project that GDD5 will increase up to 2000 °C in the B1 climate scenario and 2400 °C in the A2 climate scenario in year 2080s (figure 4(A), supplementary). By using data from Ukraine and European Russia we demonstrated the applicability of both FHMs for a GDD5 range up to 2100 °C (the B1 2080s climate scenario). GDD5 > 2100 °C (the A2 2080s climate scenario) were not tested by FHMs because contemporary climate analogs of GDD5 > 2100 °C were not found in forested areas of Russia. In a warmer climate, regions under GDD5 > 2100 °C split into areas with AMI < 3.3 suitable and with AMI > 3.3 not suitable for the survival of forests. These regions cover only 6% of the forested area in the 2080s A2 climate and 1% in the 2080s B1 climate (figure 4(B), supplementary). Average heights predicted by FHMs for the 2080s A2 climate (GDD5 up to 2400 °C) were 38–40 m. Even now, the tallest Siberian pine trees in the favorable chern taiga can be as tall as 35–37 m from our observations, which indicates that they have the potential to approach heights predicted by FHMs. Trees would likely benefit from additional heat in specific moist habitats on windward slopes in the southern mountains.
The height predictions from the two FHMs converged at the southern edge of the northern plains and southern mountain foothills under GDD5 ∼1300 °C. The difference in heights predicted by both FHMs at this GDD5 was 4 m, which is within the model SEE values of 3–4 m (equations (1) and (2)). As GDD5 escalated up to 2400 °C in 2080s scenarios the projected height difference at the interface between the two model regions decreased to about 1 m. Thus, employing two FHMs in our analyses was quite satisfactory in both current and future climates.
In the Sayan mountains, Kharuk et al (2011) observed that apical and radial growth increment in Siberian pine trees across the mountain forest-tundra ecotone was correlated with summer temperatures (r = 0.55–0.64), and cold period (September to May) air temperatures (r = 0.36–0.37).
Monserud et al (2006, 2008) showed that the strongest predictors of site index are all measures of heat. They applied the AMI to model potential Pinus contorta Dougl. (lodgepole pine) distribution in Alberta, Canada in a changing climate. Messaud and Chen (2010) used regression analyses between site index and climate. They found that summer heat (mean summer temperature and GDD5) was the most important factor. Weiskittel et al (2011) used regression analysis to identify seven climatic variables that explained 78% of the variation in site index in western United States forests, while a two-variable model explained 68% of the variation. However, these two variables were complex, including derivatives from several simple variables: (1) annual degree-days <0 °C based on monthly minimum temperatures, and (2) a combination of growing season precipitation multiplied by the difference between mean temperature of the warmest and coldest month. This two-variable model included several ecological factors important for plant physiology: warmth requirements for growth and development, cold tolerance, and water stress resistance. These climatic variables are highly intercorrelated in the mountains because each of them is correlated with elevation, which is a strong determinant of heat (recall that July mean temperature is adiabatic with elevation). Monserud and Rehfeldt (1990) found that elevation was the strongest environmental predictor of site index over the northern Rocky Mountains. Thus, a number of authors have concluded that using only one or two climatic parameters is sufficient to explain a significant amount of variation in stand heights.
Simard et al (2011) showed a global latitudinal gradient in canopy heights increasing to the equator (with increasing heat) in their global height map. We showed regional latitudinal (north–south) and altitudinal (top-down) gradients in increasing canopy heights: 0.65 m per 100 km and 1 m per 100 m of elevation across a large geographical domain of central Siberia extending 2500 km to the south and to 3000 m above sea level.
Interpretation of our model results needs to be tempered with the recognition that many other factors besides direct climate effects will interact to determine future spatial distribution, dynamics and productivity of forests: natural disturbances (still prevailing in Siberia), species migration rates, forest successions, permafrost retreat, suitability of soils and many others.
For central Siberia, HadCM3-simulated July temperatures would be higher at the end of the century than the ensemble mean. While this difference might promote faster projected shifts in forest types and taller heights northwards relative to outcomes of some GCMs that simulate slower warming rates, GCMs consistently project significant July warming for our study region, with a range of +2.5 to +6.5C for the A2 scenario depending on the model (figure 3, supplementary). The actual advance of northern treeline with warming climate will depend on many factors, including tree migration rates, permafrost retreat rates, and soil suitability for forest establishment and growth. Current estimates suggest that due to low natural migration rates, trees will require long periods to adjust to the great amount of predicted climate change (Monserud et al 1993), although migration rates may significantly increase in a warming climate (Kirilenko and Solomon 1998). While adaptation of the forests and tree species to climate change at current range boundaries could occur by means of migration, changes in population genetics are considered to be the principal potential means of adaptation within the existing tolerance range of individual species (Rehfeldt and Jaquish 2010).
Recent field research in central Siberia's taiga has showed changes in forest structure and growth, as well as treeline shifts, in both plains and mountains (Kharuk et al 2005). Understory regeneration of dark-needled Siberian pine, fir and spruce, which have not been typically found on cold permafrost soils over the Central Siberian Plateau, is now emerging rather unexpectedly in the Gmelin larch taiga. This is likely due to the gradual thawing of the permafrost. This thawing will increase the depth of the active layer, allowing for the survival of dark-needled seedlings. Strong evidence of treeline shifts of 50–120 m during a 50 year span in the mid-20th century has been reported in the southern mountains in central Siberia (Kharuk et al 2005). The mean rate of treeline migration upslope was on average about 0.35 m yr−1, which is equivalent to 55 m per 1 °C of temperature increase. For comparison, in protected areas in the Andes, the timberline migration rate was 0.24 m yr−1 (Lutz et al 2013) which is comparable to Siberian montane forest upslope shifts, despite large habitat differences between the tropical Andes and the boreal Sayan Mountains of south-central Siberia.
Northward forest progressions and tree growth under climate change will be controlled by both natural disturbances (wind, thawing permafrost, wildfire, insect infestations, disease outbreaks) and anthropogenic disturbances (legal harvests and illegal cuttings). Such disturbances have had increasing impacts on Siberian forests for the last three decades (Pleshikov 2002, Soja et al 2007).
Wildfire and the thawing permafrost are powerful drivers influencing forest structure as climate changes (Polikarpov et al 1998). In the last two decades extreme fire seasons have significantly increased in Siberia (Soja et al 2007), and the frequency of catastrophic fire seasons has increased to once in 10 years (Shvidenko et al 2011). The fire return interval in the light-conifer middle taiga (Larix spp. and Pinus sylvestris) in central Siberia is currently 25–40 years (McRae et al 2006). It is 200–300 years in the dark-conifer southern and mountain taiga (Siberian pine and fir) in southern Siberia (Polikarpov et al 1986). Wildfire controls the southern forest border because even pine and larch seedlings cannot survive high soil temperatures. Frequent fire causes southern forests to be replaced by grasslands (Tchebakova et al 2009a). In permafrost forests, fires can speed up the thawing of permafrost and increase of ALD depending on fire severity. Permafrost cannot recover as climate warms (Brown et al 2015). With the retreat of permafrost, trees are predicted to decline in extent due to changes in soil moisture in interior Siberia and would be replaced by steppe in well-drained areas and by bogs in poorly drained areas (Tchebakova et al 2009a).
A fertilization effect of increased atmospheric CO2 concentration on tree growth may be stronger than the effects of temperature rise. The CO2 concentration increase explained 72% of the apical and radial growth variation in Siberian pine trees in the Sayan mountain highlands, while summer temperature increase accounted for only 36% of the variation (Kharuk et al 2011). In British Columbia, maximum summer temperature and CO2 concentration explained respectively 19.9% and 14.2% of the variation of black spruce residual site index that resulted from removing the influence of spatial variables (Messaoud and Chen 2010). However, availability of soil N and deposition of atmospheric N are both likely to influence the response of plant biomass accumulation to elevated atmospheric CO2. Global analyses that assume a sustained CO2 fertilization effect are generally not supported by experiment studies (Reich et al 2006, Norby et al 2010).
Undeveloped and nutrient-poor soils in northern and highland forest-tundra and tundra may halt both tree progression due to slow migration rates and productivity growth despite future climates becoming warmer. As an inertial system soils would take much longer time to develop following climate warming. Research to understand interactions between soil and plant processes and their effects on forest growth and productivity in a changing climate becomes critical (Melillo et al 2011, Butler et al 2012, Savage et al 2013). Boreal forests are known to be nitrogen limited (Schulze et al 1995). Seven years of observation in a temperate North American forest under warming showed that the warming-induced increase of available nitrogen resulted in increases in the foliar nitrogen content and the relative growth rate of trees (Savage et al 2013). The longer term modeling experiments showed effects of combined warming and nitrogen addition on a net gain in total system carbon, predominately in the aboveground carbon pools (Melillo et al 2011).
5. Conclusions
- Under the warmer and dryer climate projected for our study region in Siberia in the 2080s, the area of suitable potential habitat for both light- and dark-needled conifer forest would decrease about 8%–10%; their suitable habitat would move northward, and tree invasion of current tundra areas is expected to increase. As northern areas become warmer, non-forest types like tundra would decrease in area by 50% in the moderate B1 climate and would nearly disappear warmer A2 climate.
- To the south, as habitat becomes less suitable for forests, our models projected expansion of steppe and forest-steppe. Suitable habitat for steppe and forest-steppe was projected to increase and cover 38% and 55% of the total area under the B1 scenario and A2 scenario respectively.
- Suitable habitat for productive forests with 30–40 m stand heights would increase in area in the future warmer climate; area for medium productive forests, 20–30 m, would remain about the same; and less productive forests, 10–20 m, would decrease significantly in area.
- Trees would likely benefit from additional heat in certain moist habitats, where they may reach >40 m in height. Stand heights are predicted to increase by 10 mover 35%–50% of the forest area in central Siberia, and the area of high-productivity forests (stand height ≥30 m) would increase in area up to 10%–25%.
- In the very warm A2 climate scenario at the end of the century, the tall trees (25–30 m) would occur over (8%–12%) of area in all forest types except forest-tundra. In forest-steppe, trees of 30–40 m height may cover some 15% of the area under sufficient moisture.
- Undeveloped and nutrient-poor soils in the northern taiga, forest-tundra and tundra, and limits to seed dispersal are likely to slow down northward and upslope tree migration and productivity increases despite the presence of suitable habitat.
- Decreases in forest area relative to non-forest, would be expected to result in decreased C stocks on the landscape; on the other hand, increased stand height and productivity in forest areas would lead to increases in forest C stocks.
- Forest C stocks will also be affected by changes in human and natural disturbance regimes (e.g. fire, insects, logging), CO2 fertilization and other factors.
- Our results provide useful information for input into climate and carbon modeling, and for developing approaches for managing or facilitating vegetation changes on the landscape. However, additional research is needed to determine the potential net effects of these changes on total C storage in the terrestrial ecosystems of central Siberia.
Acknowledgments
The authors gratefully acknowledge financial support for this research from the National Aeronautics and Space Administration (NASA), the Land Cover Land Use Change (LCLUC) Science Program, partial support by Grant 14.B25.31.0026 of the Ministry of Education and Science of the Russian Federation and partial support by Grant 16-05-00496 of the Russian Foundation for Basic Research. The authors are greatly indebted to Robert Monserud for providing his comments on science and help in language.