

Abstract
As planetary boundaries are rapidly being approached, humanity has little room for additional expansion and conventional intensification of agriculture, while a growing world population further spreads the food gap. Ample evidence exists that improved on-farm water management can close water-related yield gaps to a considerable degree, but its global significance remains unclear. In this modeling study we investigate systematically to what extent integrated crop water management might contribute to closing the global food gap, constrained by the assumption that pressure on water resources and land does not increase. Using a process-based bio-/agrosphere model, we simulate the yield-increasing potential of elevated irrigation water productivity (including irrigation expansion with thus saved water) and optimized use of in situ precipitation water (alleviated soil evaporation, enhanced infiltration, water harvesting for supplemental irrigation) under current and projected future climate (from 20 climate models, with and without beneficial CO2 effects). Results show that irrigation efficiency improvements can save substantial amounts of water in many river basins (globally 48% of non-productive water consumption in an 'ambitious' scenario), and if rerouted to irrigate neighboring rainfed systems, can boost kcal production significantly (26% global increase). Low-tech solutions for small-scale farmers on water-limited croplands show the potential to increase rainfed yields to a similar extent. In combination, the ambitious yet achievable integrated water management strategies explored in this study could increase global production by 41% and close the water-related yield gap by 62%. Unabated climate change will have adverse effects on crop yields in many regions, but improvements in water management as analyzed here can buffer such effects to a significant degree.
Export citation and abstract BibTeX RIS

Original content from this work may be used under the terms of the Creative Commons Attribution 3.0 licence. Any further distribution of this work must maintain attribution to the author(s) and the title of the work, journal citation and DOI.
1. Introduction
Demand for food increases as populations grow and gain wealth, thus the world might need a 60%-100% extra kcal production by 2050 to end hunger (IAASTD 2009, Tilman et al 2011, Alexandratos and Bruinsma 2012, Valin et al 2014). However, it is becoming increasingly apparent that planetary guardrails narrow down humanity's prospects for additional appropriation of resources and conventional intensification of agriculture (Steffen et al 2015). Inevitably, competition for energy, land and water rises with growing food demand, which fuels the challenge of closing the global food gap (crop calorie requirements above domestic production and imports, now and in the future) (e.g. Godfray et al 2010, Foley et al 2011, Searchinger et al 2013). Climate change might exacerbate this situation by increasing water stress and hydroclimatic variability particularly in developing countries (Porter et al 2014, Rosenzweig et al 2014).
Agriculture is the single largest user of freshwater and the most important reason why the world is transgressing planetary boundaries (Rockström and Karlberg 2010). The challenge of producing enough food becomes especially delicate, as it must be met mainly on currently cultivated land since expansion and conventional intensification of agriculture comes at major environmental costs (local to global scale factors: erosion, biodiversity loss, salinization, water pollution and eutrophication, water scarcity, greenhouse gas emissions) (Matson et al 1997, Foley et al 2005, Reynolds et al 2015). Furthermore, significant yield gaps exist across various farming systems, indicating a substantial scope for yield gains through mitigation of nutrient and water deficiencies (Mueller et al 2012, Licker et al 2010, Global Yield Gap Atlas 2015).
Increasing production on existing agricultural land by managing available resources more efficiently, placing less pressure on the environment and sustaining future capacities, i.e. sustainable intensification, is thus seen as an important part of a solution and high on the global policy agenda (Tilman 1999, The Royal Society 2009, Garnett et al 2013, World Bank 2013, Dobermann and Nelson 2015). The renewed Sustainable Development Goals now stipulate sustainable agriculture as an agreed goal among all nations (United Nations 2016), but there is little quantitative evidence of how to achieve it. While most global strategies focus on improving soil fertility, Rockström and Falkenmark (2015) urge an international high-level consideration of integrated crop water management. In fact, such water productivity improvements (i.e. increasing the yield output per unit of water consumed) in both rainfed and irrigated systems paired with an increase in consumptive water use are a sine qua non for raising food production to the tremendous amount required (Molden 2007, IAASTD 2009).
However, the attainable extent and potential of integrated crop water management at the global level under both current and future climates remains insufficiently quantified (e.g. Pretty et al 2011, Rost et al 2009, IAASTD 2009, Brauman et al 2013). In this global modeling study we investigate the potential to increase yields through large-scale implementations of integrated crop water management (defined here as a mix of various farm water management interventions).
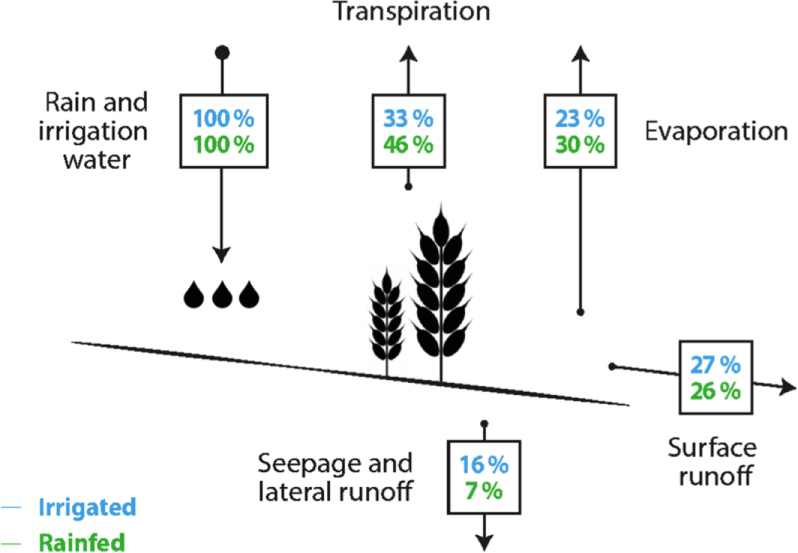
Particularly in semi-arid rainfed agriculture, subject to the largest water constraints to low yields, rainfall variability (dry spells, periodic water scarcity) often poses a much greater problem than the total amount of precipitation. In addition, in semiarid tropical systems root zone drought and low yields (1-2 t ha-1) are often caused by poor farm water management with excessive on-farm water losses (Oweis and Hachum 2006, Rockström et al 2007, Wani et al 2009). Accordingly, the transpiration coefficient (TC, crop transpiration per unit rain and withdrawn irrigation water, figure 1) is often <30%, as non-productive soil evaporation can consume up to 50% on low-yielding fields (Daamen et al 1995, Rockström 2003, Wani et al 2009), and 10%–30% can be lost to surface runoff (Welderufael et al 2008, Araya and Stroosnijder 2010).
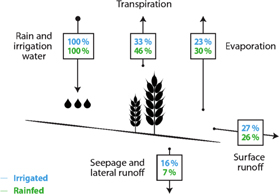
Figure 1. Rainfall and irrigation water partitioning as growing season averages across global cropland, calculated with LPJmL (1980–2009). Blue numbers refer to irrigated systems (precipitation plus irrigation withdrawal), green numbers refer to rainfed systems. Evaporation also includes interception losses. Note that water outflux can exceed growing season rainfall due to soil moisture availability at planting. Productive consumption (i.e. transpiration) can be much lower regionally; generalized estimates for rainfed systems in sub-Saharan Africa are: transpiration 15%-30%, evaporation: 30%-50%, runoff: 10%-25%, seepage: 10%-30% (Rockström and Falkenmark 2015). Spatial patterns in transpiration coefficient simulated with LPJmL are displayed in figure S1.
Download figure:
Standard image High-resolution imageThese factors indicate key hydroclimatic opportunities. In fact, there is a portfolio of measures available to increase plant water availability through e.g. maximizing soil infiltration, minimizing soil evaporation, collecting surface runoff for supplemental irrigation, and improving irrigation systems (to expand irrigated areas using saved water). Supplemental irrigation during dry spells can trigger important positive production shifts (Fox and Rockström 2003, Biazin et al 2012, Burney et al 2013), and water harvesting (WH) and soil moisture conservation (SMC) techniques can double smallholder yields in drought-prone regions while at the same time improving resilience to climate risks (Rockström et al 2003, Oweis and Hachum 2006, Dile et al 2013). These long-known practices are being implemented sporadically around the world, leaving open vast potential to scale up (Barron et al 2015, Searchinger et al 2013, Mati et al 2007). Irrigated farming systems on the other hand, are the single largest global user of water abstractions (80%-90% of consumption), but they use water often inefficiently (Gleick et al 2009, Molden 2007). Irrigation improvements have the potential to save and redistribute water to underperforming systems (Rockström et al 2007, Kijne et al 2009, Brauman et al 2013, Jägermeyr et al 2015, Fishman et al 2015). In particular the combination of such measures, i.e. integrated farm water management proved successful to boost yields across various farming systems (Oweis and Hachum 2003, Molden 2007, Mazvimavi et al 2008).
However, the potential significance of integrated crop water management at the global level remains unclear, because upscaling is a challenge given the heterogeneity of farming systems and downstream water trade-offs (e.g. Falkenmark et al 2001, Ngigi 2003, Pretty et al 2011, Dile et al 2013). Only few studies have used the capacity of modeling approaches in evaluating complex interactions of up-scaling water management interventions (e.g. Tsubo and Walker 2007, Kahinda et al 2007, Wisser et al 2010, Barron et al 2015). Lebel et al (2015) quantify WH potential for maize in the whole of Africa using an empirical approach. Rost et al (2009) simulate effects of WH and SMC on global crop NPP with the dynamic agro-hydological model used herein. A knowledge gap remains, to provide a global assessment of integrated water management in rainfed and irrigated agriculture and using a large ensemble of climate change scenarios.
This study investigates systematically the global potential of integrated crop water management through implementing the most approved interventions into the dynamic global bio-agrosphere model, LPJmL. We present a process-based simulation of crop yields with high spatial, temporal and agronomic detail, explicitly accounting for downstream effects and catchment hydrology. The study shows by how much (i) global crop production could be intensified sustainably (in terms of not using additional water or land inputs), (ii) the water gap (see figure 2) could be closed, and (iii) these opportunities might buffer potential climate change impacts, assuming various ambition levels for large-scale adoption of integrated crop water management.

Figure 2. 'Water gap' (i.e. the gap between current and potential yields in the absence of water constraints) at basin level simulated by LPJmL for rainfed (a) and irrigated agriculture (b), averaged for the time period 1980 to 2009. Global area-weighted averages are 29% for rainfed and 6% for irrigated systems.
Download figure:
Standard image High-resolution image2. Methods
The representation of water harvesting, soil moisture conservation and irrigation transitions in LPJmL is outlined first (summarized in table 1), followed by basic characteristics of the model and the simulation setup.
Table 1. Selection of water (and soil) management interventions simulated in this study.
| Name | Goal | Measure | LPJmL implementation | Rainfed / irrigated |
|---|---|---|---|---|
| Soil moisture conservation (SMC) | Alleviation of non-productive soil moisture depletion | Mulching (organic residues, plastic films), conservation tillage | Soil evaporation during growing season reduced by 10%–85% | Rainfed and irrigated cropland |
| ex situ water harvesting (WHex) | Supplementary irrigation for dry spell mitigation | Collecting surface runoff in designated catchment area, storage in cisterns etc., supplementary irrigation | Surface runoff during growing season collected on 10%-85% of cropland (storage capacity 200 mm), suppl. irrigation if soil moisture <40% of field capacity | Rainfed cropland |
| in situ water harvesting (WHin) | Maximizing soil infiltration capacity and reducing non-productive surface runoff | Pitting, contouring, terracing, micro-basins, plowing, crop residues, conservation tillage | Increased infiltration rate (see equation (1)) | Rainfed cropland |
| Irrigation improvement (IRR) | Reducing non-productive water consumption and using thus saved water for expansion | Improving performance of irrigation systems | Replacing surface irrigation with sprinkler or drip systems | Irrigated cropland, expanding into rainfed with saved water |
2.1. Simulation of water management interventions
2.1.1. Ex situ water harvesting (WHex)
This measure describes the concentration, collection, and storage of surface runoff in ponds or cisterns for supplementary irrigation (SI) during dry spells. Reservoirs are often sized to provide about 100–200 mm SI (Biazin et al 2012, Barron and Okwach 2005, Oweis and Hachum 2006). Its implementation is site-specific, depending on various biophysical, economic and social factors (Barron et al 2015, Studer and Linger 2013). We therefore simulate in LPJmL four ambition levels for harvesting runoff during the growing season: on 10, 25, 50, and 85% of rainfed cropland in each grid cell with a maximum storage capacity of 200 mm, respectively. Case studies support similar up-scaling potentials across watersheds using gravity-fed and pump-based SI (Kahinda et al 2008, Barron et al 2015). We define a rather high storage capacity to allow evaluating SI potentials, despite challenges to its large-scale implementation (in section 3.6. we show that 100 mm suffice in 95% of all cases). Water is assumed to be reapplied on the same land where it was collected, if (i) root available relative soil moisture <40% of field capacity, (ii) daily precipitation is below 5 mm, and (iii) soil water supply falls short of soil water demand. Sensitivity analyses for the cistern size and irrigation threshold are displayed in figure S2.
2.1.2. In situ water harvesting (WHin)
Micro-catchment systems, e.g. pitting, terracing, micro-basins, but also conservation tillage, and mulching can hinder water from running off the field and thus help increasing infiltration capacity. Particularly the combination of micro-catchments and mulching is observed to reduce runoff and soil evaporation considerably (Botha et al 2007, Biazin et al 2012). In LPJmL, infiltration rate In depends on soil properties, current soil moisture and the infiltration parameter p. By default, without management interventions, p = 2, but here we also simulate increased infiltration rates assuming four different intensity levels ( ).
).
In is calculated for the upper soil layer as:

where prir is daily rain and applied irrigation water, wa is the available soil water content, and Wsat and Wpwp are soil water content at saturation and wilting point, respectively (all in mm). A sensitivity analysis for p is displayed in figure S2. Hereinafter, WH refers to the combination of WHin and WHex measures at the four respective ambition levels.
2.1.3. Soil moisture conservation (SMC)
Non-productive soil moisture depletion can be alleviated through organic or plastic film mulching, and different conservation tillage systems. These techniques can improve grain yield remarkably through conserving soil moisture for additional plant transpiration, suppressing weeds, and improving cold tolerance (Liu et al 2014). Organic crop residues covering 50% of the soil surface can reduce soil evaporation by ~25%, plastic mulching can reduce soil evaporation by ~50%–90% (Bos et al 2007, Bu et al 2013). In our simulations, we reduce soil evaporation on rainfed and irrigated cropland during the growing season by 10, 25, 50, and 85%, respectively (applied as a simple factor to the evaporation calculation). SMC is also applied on irrigated fields and therefore helps saving irrigation requirements. As it is not affecting downstream water availability, SMC can be considered a 'crop per drop' improvement also at basin scale.
2.1.4. Irrigation improvements and expansion with saved water (IRRexp)
Irrigation is represented through mechanistic simulation of surface, sprinkler and drip systems, depending on country and crop type. System efficiencies are directly linked to vegetation dynamics, weather and soil conditions, and water availability (Jägermeyr et al 2015). To simulate irrigation improvements, we define three theoretical transition scenarios:
- (1)'50% surface', half of non-paddy surface irrigation is replaced by more efficient sprinkler systems.
- (2)'Best practice', drip systems are established where applicable (based on crop suitability, (see Jägermeyr et al 2015), the remainder is under sprinkler irrigation, but paddy rice remains with surface systems.
- (3)'All drip', drip irrigation on all irrigated land.
Improving irrigation performances can release water which in turn can be exploited for expanding the target area. To calculate expansion potentials, we only consider saved water that otherwise would have been consumed non-beneficially, as irrigation return-flows are often crucial for downstream water availability. Expansion of irrigated land is assumed to be further constrained by current rainfed cropland within a river basin. Table 3 presents global numbers of expansion.
Table 2. Overview of model simulations. RCP = representative concentration pathways, GCMs = global climate models.
| Reanalysis climate 1901–2009 | Simulations | |
|---|---|---|
| ACT | Current management calibrated with FAO data, reference run for all other simulations. | 1 |
| POT | Potentially achievable yields under unconstrained water availability (nutrient deficiencies remain) | 1 |
| SMC | Soil evaporation reduced by 10, 25, 50, and 85%. | 4 |
| WHex | Surface runoff collected by 10, 25, 50, and 85% | 4 |
| WHin | Infiltration rate increased in four sequential steps (equation 1) | 4 |
| WH | ex situ and in situ WH combined | 4 |
| IRR | Irrigation improvements: '50% surface', 'Best practice', 'All drip' | 3 |
| IRRexp | Irrigation expansion using saved consumptive water from IRR | 3 |
| IRRexp + SMCexp | Irrigation expansion using saved consumptive water from IRR and SMC implementation | 3 |
| Combined | Cross-combinations of SMC, WH and IRR | 12 |
| Combinedexp | Cross-combinations of SMC, WH and IRRexp + SMCexp (include the 'low', 'ambitious', 'max' scenario) | 12 |
Climate change 2009–2099: 4 RCP scenarios, 20 GCMs each, constant and transient  each each |
||
| CC | Climate change impact | 160 |
| CC + manage | Climate change plus water management scenarios: 'low', 'ambitious', 'max' | 480 |
| Σ | 688 | |
Table 3.
Global area (Mha) of rainfed and irrigated agricultural land (including pastures) aligned with irrigation water consumption (IWC,  ) and irrigation withdrawal (IWD), for current land use and the three scenarios of combined water management 'low', 'ambitious', 'max', including irrigation expansion (Combinedexp in table 2).
| Rainfed | Irrigated | Total | IWC | IWD | |
|---|---|---|---|---|---|
| [Mha] | [ ] ] |
||||
| Actual | 3984 | 297 | 4282 | 1268 | 2507 |
| Low | |||||
| '50% surface' irrigation | 3895 | 387 | 4282 | 1350 | 2379 |
| + 25% SMC | |||||
| + 25% WH | |||||
| Ambitious | |||||
| 'Best practice' irrigation | 3639 | 642 | 4282 | 1515 | 2059 |
| + 50% SMC | |||||
| + 50% WH | |||||
| Max | |||||
| 'All drip' irrigation | 3388 | 894 | 4282 | 1607 | 1818 |
| + 85% SMC | |||||
| + 85% WH | |||||
2.1.5. Integrated water management
In addition to individual simulations of water management interventions (sections 2.1.1–2.1.4), we run cross-combinations of WH, SMC, and IRRexp (see table 2), from which we select three pointer scenarios for further investigation and for climate change simulations:
- (1)'Low': '50% surface' irrigation scenario + 25% SMC + 25% WH + irrigation expansion with saved water.
- (2)'Ambitious': 'best practice' irrigation scenario + 50% SMC + 50% WH + irrigation expansion with saved water.
- (3)'Max': 'all drip' irrigation scenario + 85% SMC + 85% WH + irrigation expansion with saved water.
It is worth to highlight that both the 'max', and 'all drip' scenarios are designed to evaluate planetary biophysical limits, not to represent feasible transition targets.
2.2. LPJmL model
The model LPJmL globally represents biogeochemical land surface processes of vegetation and soils (Bondeau et al 2007, Fader et al 2010, Jägermeyr et al 2015), simulating daily water and carbon fluxes in direct coupling with the establishment, growth, and productivity of major natural and agricultural plant types at 0.5° resolution.
Agricultural land is represented by 12 specified crop functional types (CFTs), a class 'others' that includes a suite of crops collectively parameterized as annual crops, and pastures (Bondeau et al 2007). All CFTs are either irrigated or rainfed and its spatial distribution and their irrigated fraction is prescribed as in Jägermeyr et al (2015).
Assimilated carbon (in the process of photosynthesis) is allocated to harvestable storage organs (e.g. cereal grain) and three other pools (roots, leafs, stems). Sowing dates are dynamically calculated based on climate and crop type (Waha et al 2012). Crops are harvested when they reach maturity, defined either through a CFT-specific maximum value of daily accumulated phenological heat units or expiration of the growing season. Storage organs are subsequently removed from the field. Root growth and distribution within soil layers is CFT-specific, while the soil profile is discretized into 5 hydrologically active layers (Schaphoff et al 2013).
Plant growth is currently not directly nutrient-limited in LPJmL, yet constrained by temperature, radiation, water and atmospheric CO2 concentration. We calibrate crop yields with national FAO statistics based on three model parameters (as in Fader et al 2010) to account for CFT-specific management intensities.
LPJmL partitions precipitation and applied irrigation water into interception, transpiration, soil evaporation, soil moisture, and runoff. Surplus water that cannot infiltrate generates surface runoff. Subsurface soil water above saturation runs off in lateral direction, while remaining soil water above field capacity percolates to the layer beneath, depending on its soil water content and hydraulic conductivity. Surface and subsurface runoff are accumulated along the river network and subsequently available for downstream reuse.
A recently implemented mechanistic irrigation module provides the framework for irrigation transitions (Jägermeyr et al 2015). In addition, we account for household, industry and livestock water use and include a representation of dams and reservoirs to improve the simulation of available surface water (Biemans et al 2011).
2.3. Simulation protocol
For the time period 1901–2009, we ran LPJmL forced with the Climate Research Units (CRU) TS 3.1 monthly climatology for temperature, cloudiness (Harris et al 2014) and with the Global Precipitation Climatology Centres (GPCC) precipitation data (Schneider et al 2014). The number of monthly rain days was derived from CRU and GPCC data as described in Heinke et al (2013). To cover uncertainties in climate change simulations (2009–2099), we considered four representative concentration pathways (RCPs: 2.6, 4.5, 6.0, 8.5), each being represented by 20 global climate models (GCMs) obtained from the CMIP5 multi-model ensemble dataset (table S2) (Taylor et al 2012). Monthly GCM output was bilinearly interpolated and bias-corrected to the reference period 1970–2000 using a method adapted from Watanabe et al (2012). To analyze the CO2 effect on crop growth, each simulation was performed with constant (at year 2000) and transient CO2 concentration. Model runs follow a 1000-year spinup (recycling the first 30 years of input climatology) and sowing dates are fixed during the simulation period after 1960 to allow the comparison of water management potentials between different runs and otherwise they would represent a form of adaptation not intended here.
Spatially explicit global information on cropland extent is obtained from the MIRCA2000 land-use dataset (Portmann et al 2010). The extent of areas equipped for irrigation from 1900–2005 is imported from Siebert et al (2015) and the distribution of irrigation systems from Jägermeyr et al (2015). Land use patterns are fixed after the year 2005. Irrigation withdrawal is constrained by local, renewable water storage, i.e. there is no implicit assumption about contributions from fossil groundwater or diverted rivers. Only potentially achievable yields (figures 2 and 4) are simulated under unrestricted water availability.
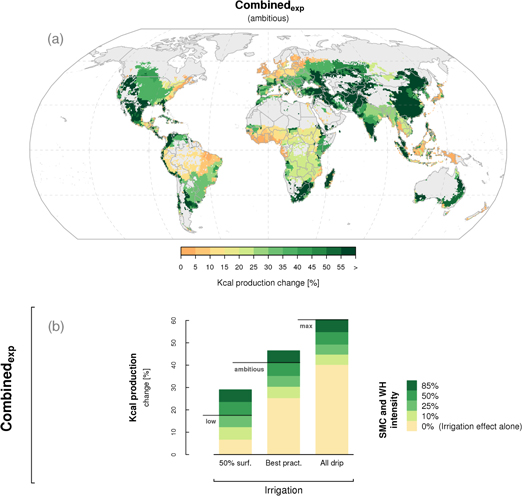
Figure 3. Potential for increasing global kcal production through integrated crop water management (panel a, 'ambitious' scenario). Global sums of kcal production for various simulated water management scenarios (combinedexp, table 2) is shown in (b), with bars representing the irrigation scenario and stacks indicating the intensity of soil moisture conservation (SMC) and water harvesting (WH). Indicated 'low', 'ambitious', and 'max' pointer scenarios derive from the combination of each irrigation scenario with the respective SMC and WH intensity (defined in section 2.1.5), all for the time period 1980 to 2009.
Download figure:
Standard image High-resolution image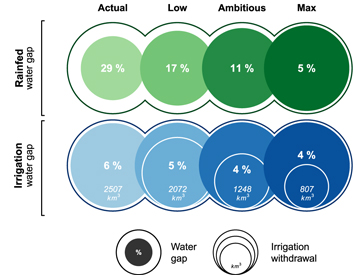
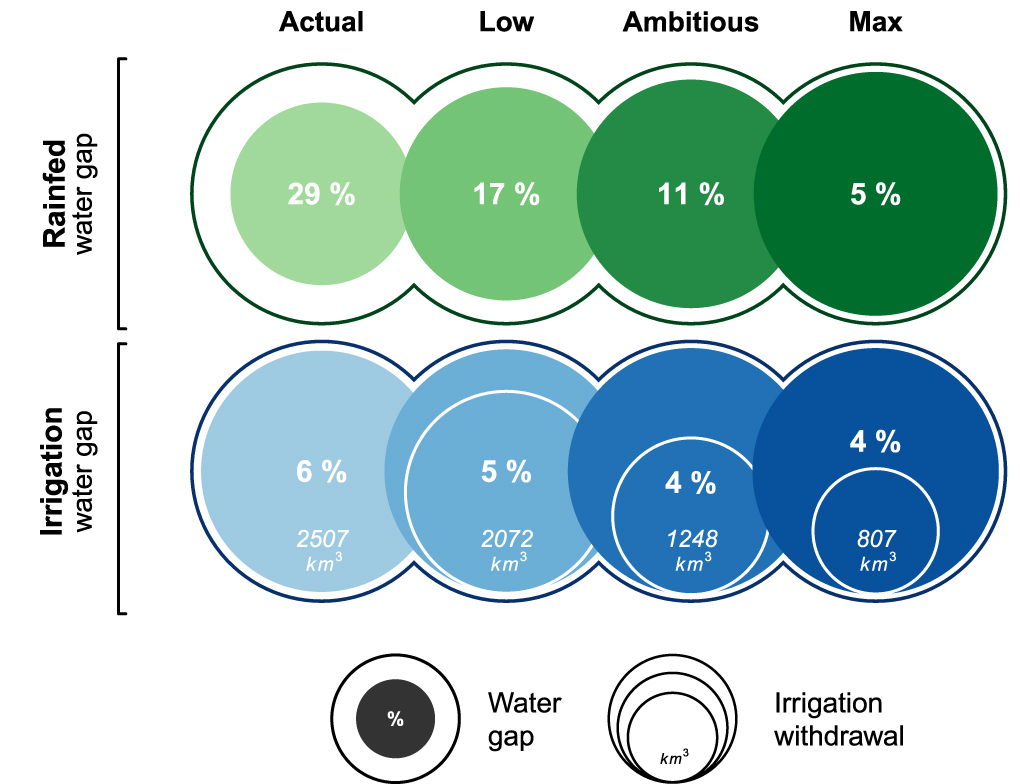
Figure 4. Possible closure of the water gap through crop water management in rainfed and irrigated systems. The gap is calculated as the difference between achieved production (colored circle) compared to potential production (white circle) for different management scenarios. Global irrigation withdrawal is indicated by bottom italic numbers, while the inner white ring illustrates the proportion to 'actual' withdrawal. Irrigation expansion is not included. See figure 2 for spatial patterns of the water gap.
Download figure:
Standard image High-resolution image3. Results
3.1. Effects of integrated water management on crop production, transpiration coefficient, and the water gap
Simulated crop water management increases global kcal production by 41% under the 'ambitious' scenario (all measures combined, including irrigation expansion), while using existing agricultural land, yet cutting irrigation abstractions. Production increases by more than 55% in many river basins between the Middle East, central Asia, China, Australia, southern Africa and North and South America (figure 3(a)). Under the 'low' and 'max' scenario global kcal production increases by 18 and 60%, respectively (figure 3(b)). Individual effects of irrigation transitions (IRR), soil moisture conservation (SMC) and water harvesting (WH) are specified below (section 3.2. and the following).
On current farmland, we calculate the average transpiration coefficient (TC) at 46% for rainfed and 33% for irrigated systems (figure 1). Simulated water management significantly shifts water towards transpiration through alleviating soil evaporation, surface runoff and irrigation losses. Therefore, the TC (combined for rainfed and irrigated systems) increases from 42% to 49%, 54%, and 61%, respectively, in the 'low', 'ambitious', and 'max' scenario.
Production gains are particularly steep in regions currently experiencing large water gaps. Figure 2(a) highlights basins where the water gap exceeds 50%, and include large parts of the Middle East, central Asia, North China plains, Australia, southern Africa, and the western United States. Based on LPJmL, current global rainfed farming operates with a water gap of 29% relative to its unconstrained water potential (yet neglecting nutrient deficiencies). In the 'low', 'ambitious' and 'max' scenario, this gap could be closed up to 17%, 11% and 5%, respectively (figure 4).
The irrigation water gap is necessarily smaller than the rainfed, as irrigation largely closes the gap. Under current conditions, global irrigated farming is simulated to be only 6% short of its unconstrained water potential (spatial patterns in figure 2(b)). While better water management can further narrow this gap (local significance), important benefits at the global level are associated with water savings (figure 4).
3.2. Water savings potentials of irrigation systems
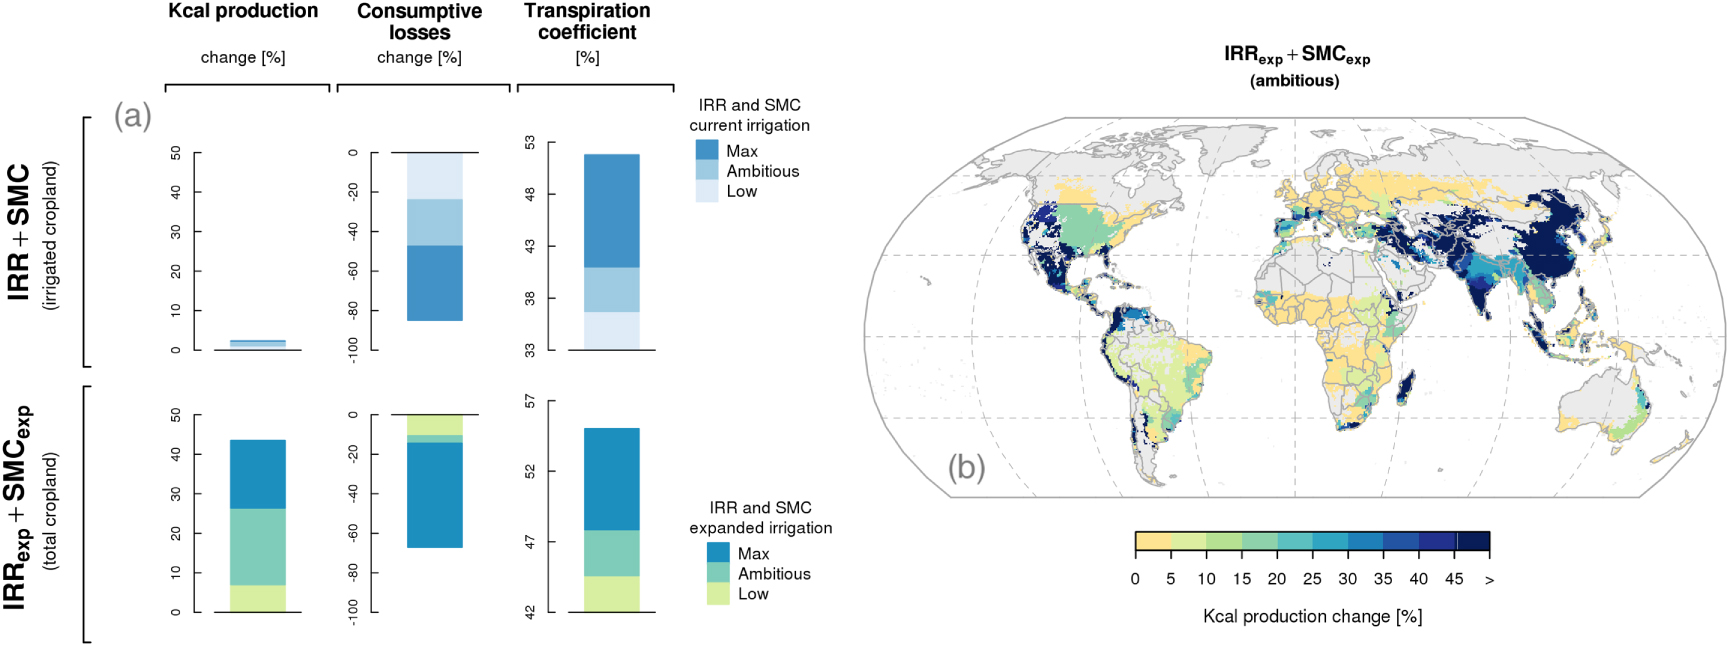
Figure 5(a) confirms that improved irrigation and SMC implementations can only marginally increase irrigated production at the global level (by <2%). More importantly however, these measures ('low', 'ambitious', 'max' scenario without expansion) show the potential to cut consumptive losses (i.e. soil evaporation, interception, and evaporative conveyance losses) by respectively 24%, 48%, and 85% (figure 5(b)). This results in significant reductions of global irrigation withdrawal from currently 2507  to 2071, 1248 and 808
  (figure 4), because alleviated soil evaporation and higher conveyance and application efficiencies strongly reduce irrigation requirements.
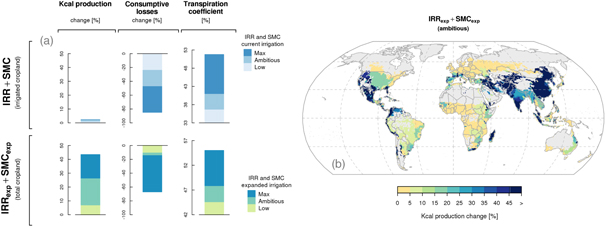
Figure 5. Effects of irrigation improvements (IRR) and soil moisture conservation (SMC) on crop production, consumptive irrigation losses and the transpiration coefficient of irrigated cropland. Stacks in panel (a) show global sums for currently irrigated cropland (top row) and for total cropland with expanded irrigation into rainfed areas (bottom row, SMC does not apply to rainfed systems in this figure). The map (b) shows spatial patterns of changes in total kcal production with the 'ambitious' IRRexp + SMCexp scenario ('best practice' irrigation and 50% SMC and expansion with saved water), all for the time period 1980 to 2009.
Download figure:
Standard image High-resolution image3.3. Irrigation expansion with saved irrigation losses
These water savings would theoretically allow for an additional 90, 345, and 597 Mha expansion into rainfed cropland, respectively, for the 'low','ambitious', and 'max' scenario. These numbers are substantial in perspective of current irrigated land of about 300 Mha and the expected slow expansion pace. But future irrigation expectations are curbed due to land constraints under current system efficiencies (Alexandratos and Bruinsma 2012); farmers who pursue efforts to save water often use it to expand their irrigated share of cropland (Fishman et al 2015).
Global total kcal production (rainfed + irrigated) could thereby increase by 7%, 26%, and 43% with considerably higher numbers in specific basins particularly between the middle East, large parts of Asia, and Central to North America (figure 5(b); aggregated to the basin level, as upstream irrigation improvements can have water trade offs downstream). Note that irrigation expansion (with higher efficiencies), but also SMC and WH, lead to higher productive plant transpiration, which increases global irrigation water consumption from currently 1268  to 1350, 1515, and 1607
  , respectively (table 3, 'low', 'ambitious', 'max' scenario), while non-productive losses still decrease (not all saved water used up for expansion as some basins lack sufficient available rainfed cropland, figure 5(a)). Overall, the total global withdrawal amount is simulated to decrease by 128, 448, and 689
  for the three respective scenarios, despite the growth of irrigated areas (table 3).
3.4. Effects of soil moisture conservation and water harvesting on rainfed systems
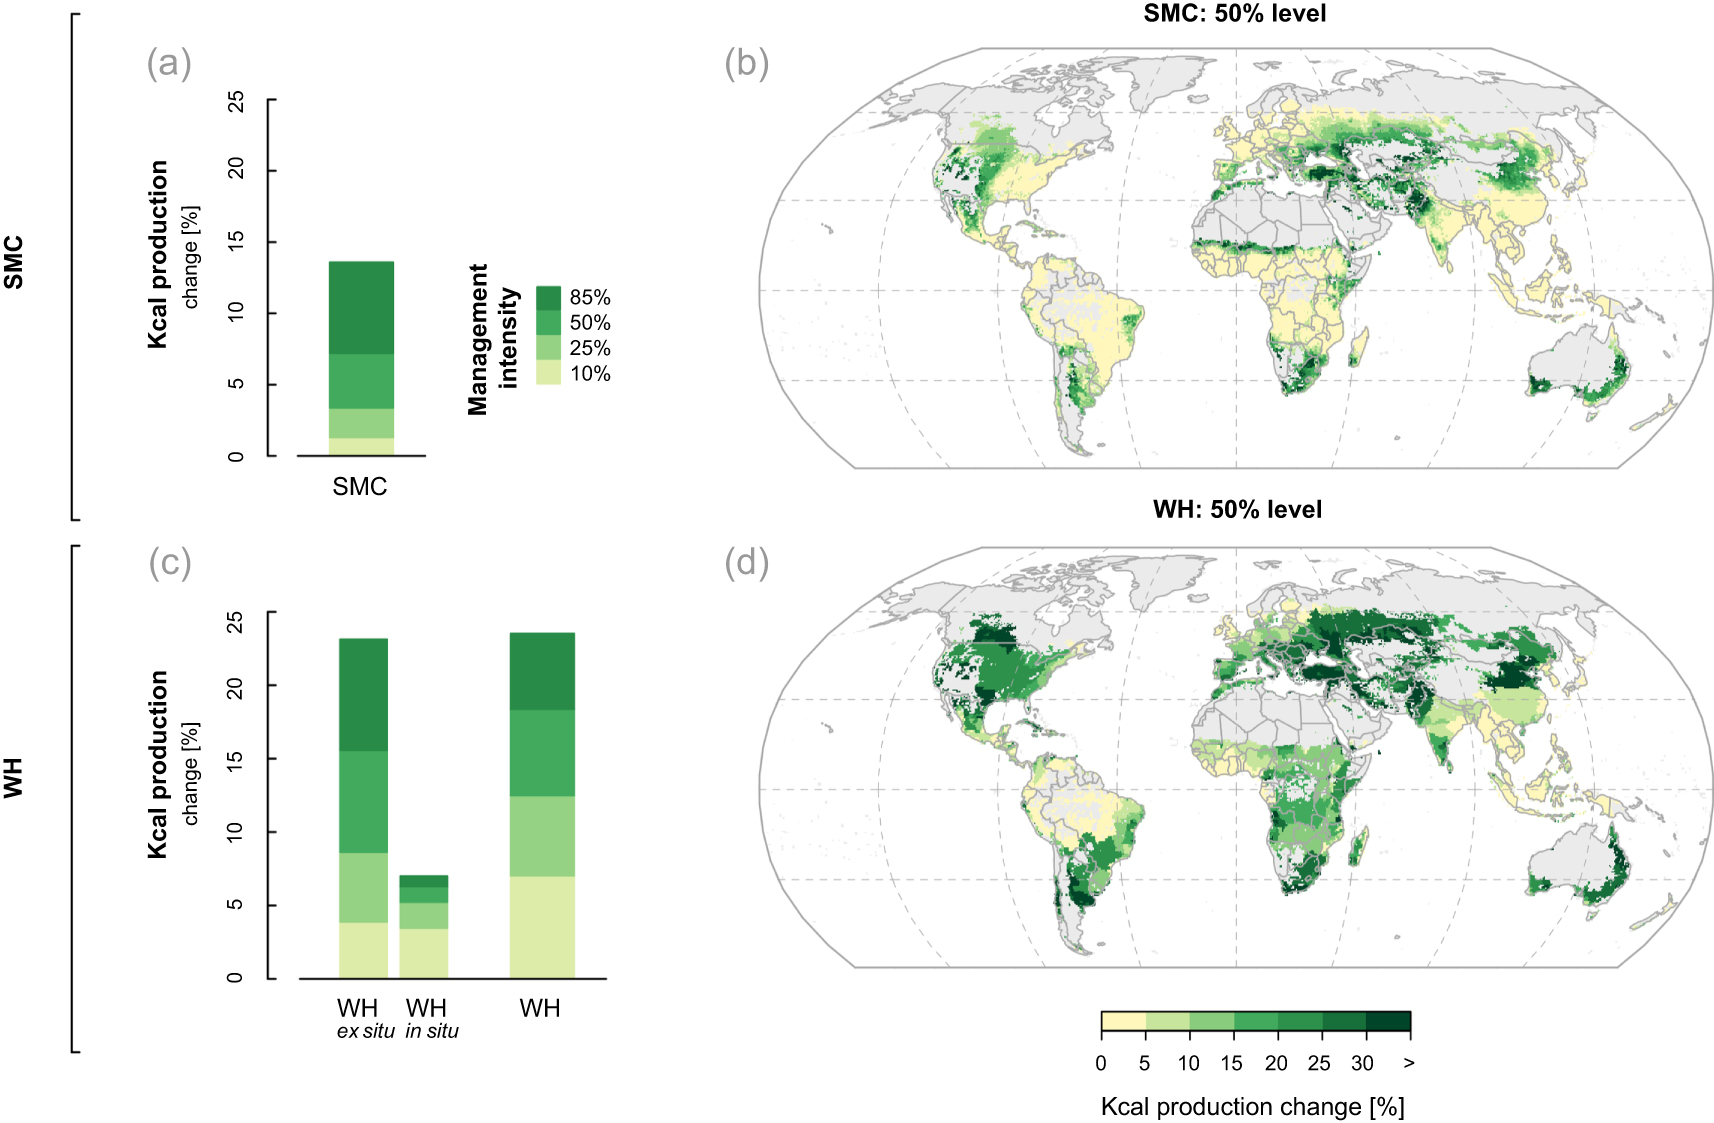
SMC shows considerable potential to amplify rainfed kcal production (3%–14% globally, figure 6(a)). Regions with high sensitivity are concentrated in semi-arid to arid regions such as the Sahel, southern Africa, central Asia, and Australia, where production increases reach >20% (figure 6(b), no downstream effect and thus displayed at the grid cell level). As for water harvesting, WHex exhibits much higher production potentials compared to WHin, but combining both measures appears especially beneficial at low intensity levels, and could increase global kcal production by 7%–24% (figure 6(c)). Figure 6(d) shows spatial patterns of WH (50% level) with high sensitivity also in semi-arid regions, but in addition in sub-humid regions with high rainfall variability and runoff excess, across tropical and temperate regions.
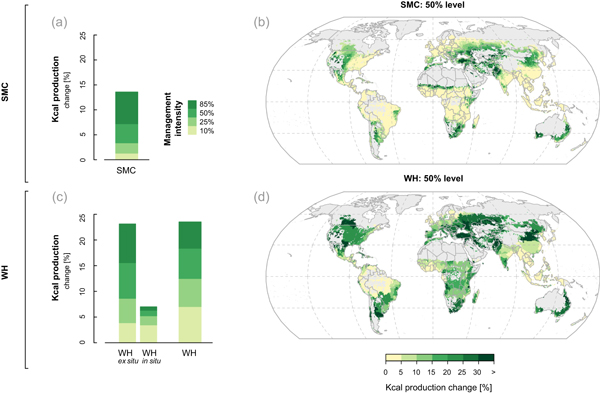
Figure 6. Effects of soil moisture conservation (SMC) and water harvesting (WH) interventions on rainfed cropping systems: barplots show global sums of kcal production change. Maps show spatial patterns of SMC (b) and WH (d), respectively at the 50% intensity level for the time period 1980 to 2009.
Download figure:
Standard image High-resolution image3.5. Climate change impact
Climate change is simulated to have adverse effects on global crop production, while high uncertainty is associated with the direct effect of carbon dioxide on plant growth. In simulations with constant CO2 concentration (performed to isolate the climate change effect), global kcal production is projected to change by −3% (RCP 2.6) to −18.2% (RCP 8.5, table 4, median of 20 GCMs), mostly due to increased water deficiencies. With transient CO2 concentration, a strong fertilization effect (in LPJmL not directly constrained by nutrient limitation) actually increases global production by 4.3% (RCP 2.6) to 13% (RCP 8.5) despite concurrent climate impacts. A 'moderate' CO2 fertilization (mean of constant and transient CO2 simulations) suggests marginal global production changes (−2.6% to 1.6%). Regionally however, India, Pakistan, west Australia, African Sahel, and east Brazil face negative changes from −5% to < −20% under RCP 2.6 ('moderate' CO2), while strong increases occur in large parts of Russia, east and southern Africa, and parts of central and south America (5% to >20%). In an RCP 8.5 world ('moderate' CO2) the Mediterranean region, major parts of the United States and Mexico, and southern Asia appear additionally on the map with distinct negative changes, and many basins show kcal declines from −10 to < −30% (figure 7(c)).

Figure 7. Spatial patterns of potential climate change impact on global crop production under RCP 2.6 (a) and opposed to 'low' water management (b); under RCP 8.5 (c) and opposed to 'ambitious' water management (d), all for the time period 2070 to 2099 vs 1980–2009 as averages across 20 GCMs and with 'moderate'  effect (compare table 4). Corresponding maps for constant and transient
  are presented in figure S4 and S5.
Download figure:
Standard image High-resolution image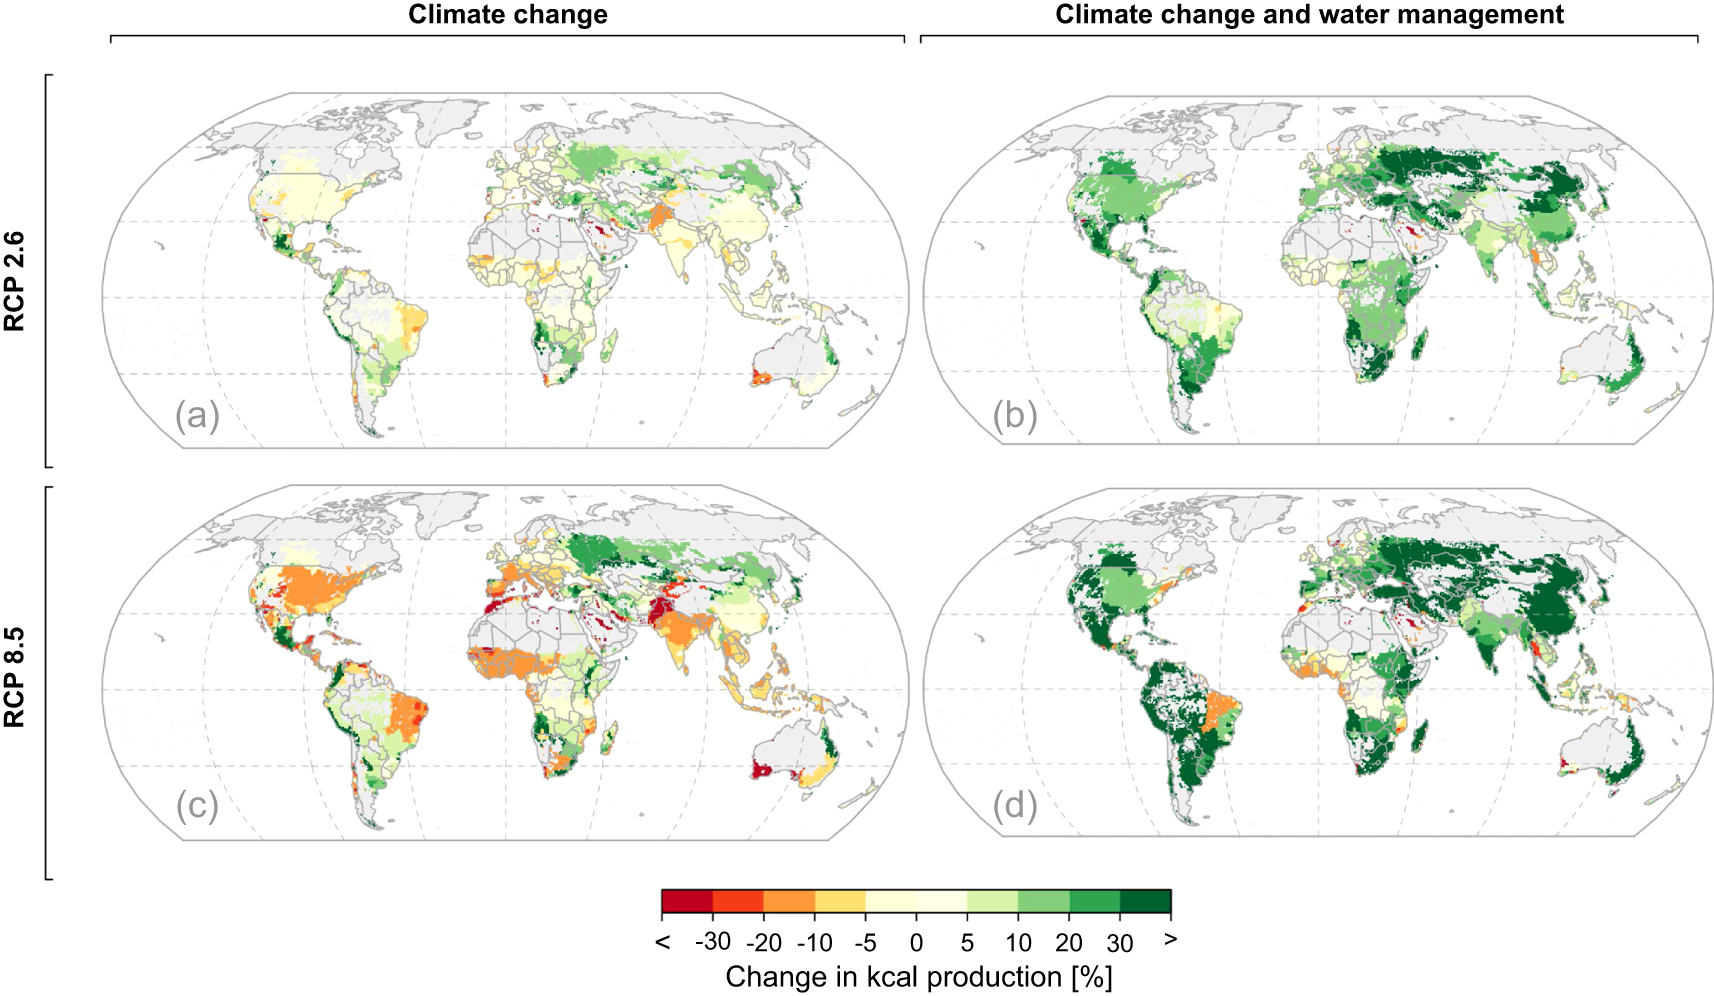
Table 4.
Potential climate change impact (CC) on global crop production as against three scenarios of water management under four RCP scenarios and different levels of  fertilization; for the time period 2070–2099 versus 1980–2009, as averages across 20 GCMs.
| RCP 2.6 | RCP 4.5 | RCP 6 | RCP 8.5 | |||||||||
|---|---|---|---|---|---|---|---|---|---|---|---|---|
| const.1 | moderate | trans. | const. | moderate | trans. | const. | moderate | trans. | const. | moderate | trans. | |
| CC | −3.0 | 0.7 | 4.3 | −7.6 | 0.9 | 9.3 | −9.4 | 1.6 | 12.7 | −18.2 | −2.6 | 13.0 |
| CC + manage | ||||||||||||
| 'Low' | 12.6 | 16.2 | 19.8 | 8.1 | 16.4 | 24.6 | 5.8 | 16.7 | 27.5 | −3.8 | 11.3 | 26.4 |
| 'Ambitious' | 38.4 | 42.2 | 46.1 | 33.1 | 41.8 | 50.5 | 30.8 | 42.2 | 53.7 | 18.9 | 34.9 | 50.9 |
| 'Max' | 53.1 | 57.3 | 61.5 | 47.1 | 56.7 | 66.2 | 44.6 | 57.1 | 69.7 | 31.4 | 49.1 | 66.8 |
1Note. const.:  concentration fixed at year 2000, trans.: transient
  concentration, moderate: moderate
  effect, mean yields of constant and transient
  .
.
In the 'low' scenario, most adverse climate change impacts are simulated to be buffered in a RCP 2.6 world (figure 7, see figure S4 and S5 for constant and transient CO2). The 'ambitious' scenario can ease negative impacts in an RCP 8.5 world in many basins, but some regions, notably east Brazil and west Africa, remain with negative impacts. Despite large uncertainties associated with the CO2 effect, global crop production is simulated to increase by >40% under 'ambitious' water management for all but the most severe climate change scenario (35% with RCP8.5, table 4).
3.6. Evaluation of results and modeling issues
Supplemental irrigation, mulching, and conservation tillage demonstrably increased yields in case studies by 56%, 44%, and 30%, respectively (Araya and Stroosnijder 2010, Welderufael et al 2008, Fox and Rockström 2003). A major case study (286 projects in 57 countries) documents average yield increases by 79% through a number of conservation agriculture interventions, including water harvesting and conservation tillage (Pretty et al 2006). A wider collection of case studies shows similar ranges (table S1). Lebel et al (2015) simulate for maize in sub-Saharan Africa (SSA) an average yield increase with WH intervention of 9%-39%. We arrive at 0%–33% across SSA basins. In our simulation (50% level), on average 57 mm supplemental irrigation are applied during the growing season (in 95% of all cases less than 100 mm, figure S3), Fox and Rockström (2003) document 60-90 mm in a Burkina Faso case study. More generally we can reproduce the documented scale of observed yield gains using LPJmL, and our analysis extends case study insights to a broader set of climates, locations, and crops and thus refines management potentials at the global level (Rost et al 2009).
We point out that it is critical to evaluate the local feasibility of WH catchment and storage systems. This depends on different factors (e.g. terrain type, soil structure, hydroclimatic setting, social and financial capital (Studer and Linger 2013, Falkenmark et al 2001, Mati et al 2007)), addressing those in detail is beyond the scope of this broad-scale study of biophysical potentials. Although case studies show that often only 10%-20% of the land is unsuitable for WH and SMC adoption (Barron et al 2015, Kahinda et al 2008, van Rensburg et al 2012), we might exaggerate WH suitability. However, this is faced by our very conservative assumption on the catchment area that is limited to existing cropland only, and which is often much larger in reality. But it appears infeasible to delineate additional suitable catchment areas with a sufficient degree of detail globally.
Therefore, we regard the 'low' and 'ambitious' scenario as potentially achievable, while the 'max' scenario, locally proven though, indeed appears unlikely to become implemented globally. Nevertheless, it provides important insights into planetary biophysical capacities. Furthermore, it is difficult to quantify the extent to which farmers already adopted WH and SMC measures. Although initial up-scaling projects prove successful regionally (e.g. Zhu and Yuanhong 2006), they still represent only marginal areas at the global level.
Our estimates of irrigation withdrawal and consumption agree well with previous estimates (FAO 2014, Döll et al 2014, Wada and Bierkens 2014), albeit featuring much more process detail. Irrigation expansion adds a noticeable share to production increases simulated in this study (figures 3(b) and 5(a)). The expansion of irrigated crops replaces rainfed crops, which results in a propagation of irrigated cropland into pastures in some cells, as the share of irrigated pastures is generally low. However, in SSA only 5% of the cropland is under irrigation today, which first explains our flat irrigation improvement potentials in SSA (figure 5(b)), and second outlines scope for irrigation expansion using currently untapped water resources (FAO 2005, Burney et al 2013, Xie et al 2014).
Finally, it is important to note that upstream IRR and WH interventions can lead to reduced return-flows and runoff, which can negatively affect water availability downstream. Despite noticeable impacts locally, gains at the basin level over-compensate losses in all basins (figure S4). This appears beneficial from a food production perspective, but there is a clear need for policies and institutional orders to regulate water reallocations. In this context it is crucial to quantify contributions from groundwater and water diversions, given the complex recharge and transboundary issues involved.
4. Discussion
This study is the first to systematically quantify potential contributions of different strategies of farm water management to increase global crop production without increasing pressure on land and water boundaries. Based on spatially and temporally detailed process-based modeling, we advance the quantification of the global achievable scope of water management in rainfed and irrigated agriculture. Simulated yield potentials are well in line with farm-level experiences, but we exploit the dynamic modeling capacity of LPJmL for complex up-scaling of water interactions to arrive at robust global estimates. 41% production growth, at global scale, released through 'ambitious' water management outlines tremendous opportunities. While grand challenges lie ahead to its large-scale implementation, the 'ambitious' potentials simulated here appear feasible from a biophysical and also an agronomic perspective. More than 800 million people today remain chronically undernourished (United Nations 2015)—a kcal production gain of 40% realized by 2050 might be sufficient to halve the widening global food gap, assuming that we need 60%-100% additional crop calories to eradicate hunger (a gap of 80% roughly relates to  kcal per year, compared to the production of
  kcal in 2006 (Alexandratos and Bruinsma 2012, Searchinger et al 2013)).
Although sustainable intensification appears high on the policy agenda, there is a lack of institutionalized crop water management targets. In fact, such targets are outright missing from the recently passed sustainable development goals and from the supporting literature (United Nations 2015, United Nations 2016). Our study adds confidence that not targeting dedicated water goals means we are set to miss substantial opportunities to advance a sustainable food system and its climate resilience.
On the way towards a sustainable food future, water management is accompanied with essential co-benefits (that are not modeled here). Among the most important are reducing soil erosion through water harvesting and mulching, currently affecting ̃67% of SSA cropland (Liniger et al 2011). But large-scale implementations of plastic mulching can also lead to environmental pollution (Liu et al 2014). Better irrigation technology helps reducing nutrients and pesticides application (better location and timing) (Christian-Smith et al 2012, Calderón et al 2014), while conservation agriculture in general will help mitigate greenhouse gas emissions (e.g. Mahdi et al 2015, Karimi et al 2012, Liniger et al 2011). Water management that leads to stabilized water supply throughout the growing season is prerequisite for smallholders to invest in higher inputs (fertilizer, breeds) (Biazin et al 2012, Burney et al 2013). Low-cost interventions (organic mulching, conservation tillage, simple drip kits) can directly translate in synergies in livelihoods; as most poor live in water-constrained agriculture, the associated scope for poverty alleviation and improved local food security is tremendous (Postel et al 2001, Dillon 2011, Pretty et al 2011, Kahinda and Taigbenu 2011, Burney and Naylor 2012).
At the global scale, this study suggest that both smallholder on-farm techniques and large-scale improvements of irrigation systems and WH implementation are needed, while respecting environmental flow requirements of riverine ecosystems and other environmental boundaries. Our results show that large-scale adoptions of these measures lead into water reallocations that would benefit from institutional support and water legislations as mentioned above (Molden 2007). Future investments must focus on enhancing system productivity on current arable land, integrating management in rainfed and irrigated agriculture in an integrated landscape approach (Faurès et al 2007, Rockström et al 2007). Jägermeyr et al (2015) show that technical irrigation saving potentials are substantial at the global level, while in this study we show that such savings could be redirected to support vast currently rainfed farms with additional irrigation water. Although initial investment needs are steep, long-term economic analyses confirmed the substantial net profits achievable (Biazin et al 2012, Fox et al 2005).
However, water management is not a panacea and needs to be combined with other components to sustainable farm management to exploit the strong synergy between water, soil and nutrient management (Oweis and Hachum 2006). Especially in SSA, many cropping systems are highly nutrient-deficient and water management cannot fully take off, unless depleted soils become replenished (Sánchez 2010, Fox and Rockström 2003). But it is clear that the challenge of achieving sustainable food security is not only a supply-side problem. Urgent action is also needed on holding down the growth in food consumption, reducing waste, and achieve replacement level fertility (Garnett et al 2013, Searchinger et al 2013, DeFries et al 2015).
5. Conclusion
This study quantifies the significance of integrated crop water management at the global scale to intensify rainfed and irrigated farming. Simulated measures are constrained by the assumption that pressure on water resources and land does not increase, which delineates an effective strategy to minimize agricultural impacts on the biosphere. Based on detailed, process-based simulation of underlying local biophysical conditions and with high spatio-temporal resolution, we systematically investigate scenarios of irrigation improvements and expansion, water harvesting, and soil moisture conservation. Under a 'low' intensity scenario we arrive at a global kcal gain of 18%. With an 'ambitious', yet achievable scenario we reveal global production potentials of 41%. Such water management interventions would also about halve the current global water gap in agriculture. Moreover, thus improved water management offers the opportunity to buffer potential negative climate change impacts in many world regions. The 'low' intensity scenario might over-compensate climate change impacts under relatively low RCP 2.6 emissions (globally + 40% kcal production), while the 'ambitious' scenario could ease most negative impacts in a RCP 8.5 world (globally + 33% kcal production). Such kcal gain might be sufficient to halve the global food gap by 2050. In conclusion, this study highlights that not focussing on systematic implementation of integrated crop water management means to miss substantial opportunities in intensifying global farming systems within planetary boundaries and to negotiate climate-associated risks in smallholder agriculture.
Acknowledgments
This study was partly funded by the FACCE MACSUR project (031A103B) and within the framework of the Leibniz Competition (SAW-2013-PIK-5). We thank Matti Kummu for helpful comments. Moreover, we acknowledge the World Climate Research Programme's Working Group on Coupled Modelling, which is responsible for CMIP, and we thank the climate modeling groups (listed in table S2) for producing and making available their model output.