

Abstract
The surface Walker and tropical tropospheric circulations have been inferred to slow down from historical observations and model projections, yet analysis of large-scale surface wind predictions is lacking. Satellite measurements of surface wind speed indicate strengthening trends averaged over the global and tropical oceans that are supported by precipitation and evaporation changes. Here we use corrected anemometer-based observations to show that the surface wind speed has not decreased in the averaged tropical oceans, despite its reduction in the region of the Walker circulation. Historical simulations and future projections for climate change also suggest a near-zero wind speed trend averaged in space, regardless of the Walker cell change. In the tropics, the sea surface temperature pattern effect acts against the large-scale circulation slow-down. For higher latitudes, the surface winds shift poleward along with the eddy-driven mid-latitude westerlies, resulting in a very small contribution to the global change in surface wind speed. Despite its importance for surface wind speed change, the influence of the SST pattern change on global-mean rainfall is insignificant since it cannot substantially alter the global energy balance. As a result, the precipitation response to global warming remains 'muted' relative to atmospheric moisture increase. Our results therefore show consistency between projections and observations of surface winds and precipitation.
Export citation and abstract BibTeX RIS

Original content from this work may be used under the terms of the Creative Commons Attribution 3.0 licence. Any further distribution of this work must maintain attribution to the author(s) and the title of the work, journal citation and DOI.
1. Introduction
The atmospheric circulation is an essential element of Earth's climate system, affecting precipitation, moisture and energy transports, and tropical cyclone development. Weakening of the tropical tropospheric circulation is a widely expected consequence of global warming associated with the increase in greenhouse gas (GHG) concentration. Historical evolution of the equatorial sea level pressure gradient (Vecchi et al 2006) and surface wind observations (Tokinaga et al 2012) support these expectations, showing a slow-down of the Walker circulation (Clarke and Lebedev 1996). The observed slow-down is accurately reproduced in global climate model (GCM) simulations and has been attributed largely to anthropogenic forcing (Vecchi et al 2006). Tanaka et al (2004) found evidence in the upper troposphere for the weakening of both the Walker and monsoon circulations in recent decades, while the Hadley circulation was shown to intensify in boreal winter. McVicar and Roderick (2010) reported that terrestrial near-surface winds have slowed down on average in recent decades. Further weakening of the tropical circulation associated with a decrease of the convective mass fluxes between the planetary boundary layer and free troposphere (Held and Soden 2006) are found in GCM projections for the 21st century, preferentially for the Walker rather than the Hadley cell (Vecchi and Soden 2007). The weakening of the tropical circulation alters the tropical Pacific Ocean thermal structure and circulation, with important implications for global weather and climate (Vecchi et al 2006, Vecchi and Soden 2007).
Nevertheless, 20th century trends in Pacific sea surface temperature (SST) and sea level pressure remain diverse across different datasets (Solomon and Newman 2012), which has raised uncertainty about the weakening of the Walker circulation. Recent observational studies suggest a hiatus in global warming during the last two decades, which has been attributed to La Nina-like SST patterns on the equator (Kosaka and Xie 2013), cooling the globe via atmospheric teleconnections. This pattern of SST warming in the central/western Pacific and cooling in the eastern Pacific would intensify the Walker cell, as shown by Sandeep et al (2014) by removing a weakening trend in the 20th century associated with El Nino variability. In turn, enhanced trade winds could also positively feedback to the hiatus by increasing subsurface ocean heat uptake and equatorial upwelling (England et al 2014). However, the strengthening of the Walker cell associated with the hiatus can be regarded as natural interdecadal variability (see also Sohn and Park 2010, Merrifield 2011). Moreover, corrected SST observations (Karl et al 2015) question the existence of the hiatus and its ability to influence the long-term trend.
One major consequence of the slow-down of the tropical tropospheric circulation is the 'muted' precipitation response (Held and Soden 2006) of 2%–3% per degree of global SST warming, in comparison to a water vapor increase of 7% K−1. This constrains the circulation to weaken at ∼5% K−1. The circulation slow-down has also been explained with a radiative constraint (Knutson and Manabe 1995), and this idea has been extended to show the importance of the mean advection of stratification change (MASC) throughout the tropics (Ma et al 2012). Sohn et al (2016) supported this mechanism by reporting that GCMs with a greater increase in static stability simulate a more significant Walker circulation weakening. It has also been adequately applied for further examining rainfall and circulation changes (He and Soden 2015, Chadwick 2016).
Surface winds are important for heat and momentum exchange between the ocean and atmosphere. It seems straightforward to extend the predicted slow-down of the tropospheric and surface Walker circulation to the surface wind speed field throughout the tropics; however, no literature was found to provide evidence from GCM projections. On the other hand, satellite-derived microwave measurements during 1987–2006 do not support this assumption (Wentz et al 2007). Surface wind speed was observed to increase at a rate of 5% K−1 over the global ocean and 3% K−1 in the tropics (table 1), with an error bar of 3.5% K−1. This is supported by a positive trend in the observed global evaporation since the late 1970 s (Yu 2007). Observed precipitation increased at 6% K−1, similar to the rate of water vapor change (Wentz et al 2007). Indeed, with an uncertainty of 2.5% K−1, this increase in precipitation (3.5%–8.5% K−1) is generally consistent with the predicted trend (2%–3% K−1), yet the observed surface wind speed change of −0.5 to 6.5% K−1 cannot be interpreted as a significant weakening.
Table 1. Statistics of the simulated 21st century surface wind change in response to global warming (ensemble mean ± inter-model spread), in comparison with the satellite observations (Wentz et al 2007).
| Surface wind change (% K−1) | CMIP3 ocean | CMIP5 ocean | CMIP5 ocean + land | Wentz et al (2007) |
|---|---|---|---|---|
| Global mean | 1.00 ± 0.90 | −0.20 ± 0.40 | −0.34 ± 0.34 | 5.00 ± 3.50 |
| Tropical mean | 0.60 ± 0.80 | −0.20 ± 0.40 | −0.16 ± 0.36 | 3.00 ± 3.50 |
The above-mentioned predictions and observations in the literature seemingly lead to different conclusions regarding the tropics-wide surface wind response to global warming. To address this inconsistency, we investigate mechanisms controlling the surface wind speed change in the wave and anemometer-based sea-surface wind (WASWind) dataset (Tokinaga and Xie 2011, Tokinaga et al 2012), and 19 GCM projections from the World Climate Research Program's (WCRP's) Coupled Model Intercomparison Project phases 5 (CMIP5) (Taylor et al 2012) along the historical and Representative Concentration Pathways 4.5 (RCP4.5) scenarios. Implications are then discussed for precipitation, evaporation, wind energy, and air quality.
2. Data and Method
The WASWind dataset (Tokinaga and Xie 2011) rejects spurious Beaufort winds and corrects ship observations of surface wind velocity with wind wave height archived in the International Comprehensive Ocean-Atmosphere Data Set. The correction accounts for the upward trend due to increase in anemometer height and results of it exhibit a weakening of the Walker circulation (Tokinaga et al 2012). The dataset is at a monthly resolution of 4° by 4° from 1950 to 2011, and the tropical region during 1970–1995 is selected for our trend analysis.
Historical and RCP4.5 simulations produced by 19 CMIP5 models are used in this study. We analyze one realization ('r1i1p1') for each of the following models: ACCESS1.0, BCC-CSM1.1, CanESM2, CCSM4, CNRM-CM5, GFDL-CM3, GFDL-ESM2G, GISS-E2-R, HadGEM2-CC, HadGEM2-ES, INM-CM4, IPSL-CM5A-LR, IPSL-CM5A-MR, MIROC5, MIROC-ESM-CHEM, MIROC-ESM, MPI-ESM-LR, MRI-CGCM3, NorESM1-M. The surface wind speed is from the direct monthly output, and its spatial-mean is the mean of the wind speed, not the speed of the mean wind. Exceptions are the CCSM4, INM-CM4, and NorESM1-M models, for which monthly means of wind speed are not available.
The historical simulations are carried out from the industrial revolution to near the present (1850–2005), and we take the 1970–1995 period to compare with the WASWind observations. They are forced by historical estimates of natural and anthropogenic changes including solar output, volcanoes, GHGs, aerosols, and land cover. Note that only anthropogenic GHGs and aerosols are prescribed commonly, and other forcings differ among the models.
The RCP4.5 runs provide various lengths of simulations with the future radiative forcing stabilized at 4.5 W m−2 in 2100. All changes are calculated as the difference between the 10-year averages for 2089–98 and 2006–15, and normalized by the tropical mean SST warming (20°S–20°N) before the computation of ensemble means and spreads. For cross-validation, the CMIP3 output under SRES A1B scenario (described in Ma and Xie 2013) is also used, with wind speed roughly estimated from the monthly wind vectors due to data availability.
The contributions of various factors to the surface wind change are calculated based on the following Atmospheric Model Intercomparison Project (AMIP) type experiments in CMIP5. 1pctCO2: CO2 concentration increases 1% yr–1 until quadrupling, with change calculated as the difference between means of years 121–140 and 1–20; AMIP: forced with observed monthly mean SST and sea ice concentration for years 1979–2008; AMIP4xCO2: same as AMIP, except that the atmospheric CO2 concentration is quadrupled; AMIP4K: Same as AMIP, except adding a uniform 4 K SST anomaly. Despite their lack of full air-sea coupling, the AMIP experiments are able to faithfully reproduce coupled simulations of anthropogenic climate change (He and Soden 2016). The total climate change is represented by the 1pctCO2 experiment. The direct CO2 effect is calculated as the difference between AMIP4xCO2 and AMIP, the spatial-uniform SST increase (SUSI) effect between AMIP4K and AMIP, and the SST pattern effect as the residual of 1pctCO2—CO2—SUSI. All changes are normalized by the tropical-mean SST warming. Nine GCMs and the correspondent atmosphere-only components are used, namely the BCC-CSM1.1, CanESM2/AM4, CNRM-CM5, HadGEM2-ES/-A, IPSL-CM5B-LR, MIROC5, MPI-ESM-LR, MPI-ESM-MR and MRI-CGCM3. The monthly mean output from one realization is taken from each model. BCC-CSM1.1 and MPI-ESM-LR do not include surface wind output, so the lowest pressure level (1000 hPa) is used.
3. Results
One may suggest that the observed non-weakening in surface wind speed is associated with the global warming hiatus since 1993 (Meehl et al 2013). To reject this hypothesis, we examine the WASWind dataset during 1970–1995, when the hiatus signal is insignificant. Figure 1 shows the ratio of surface wind speed change to the climatology in the tropical oceans. In figure 1(a), evidence for the Walker circulation slow-down appears in the central equatorial Pacific, and surface winds strengthen in the subtropical South Pacific, equatorial Atlantic and Indian Ocean. However, even within the tropics where tropospheric circulation tends to slow down, the spatial-mean surface wind speed has a positive trend (figure 1(b)), consistent with the microwave measurements (Wentz et al 2007). Although this trend is rather weak (4.15%/25 yr), it suggests non-weakening average surface wind speed even while the Walker circulation (represented by wind speed change averaged in the square in figure 1(a)) weakens substantially (−7.78%/25 yr), exceeding the 95% confidence level. We considered autocorrelation effect in the significance test following Trenberth (1984), though a Student's t-test gives similar estimation.
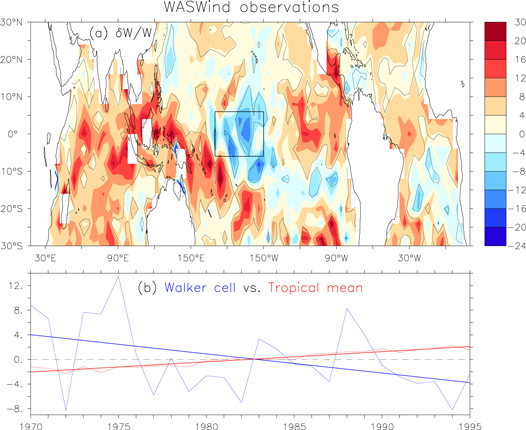
Figure 1. Observed fractional change of surface wind speed during 1970–1995 from the WASWind dataset. (a) Tropical distribution of the ratio of trend to climatology (color, %/25 yr), with regions exceeding the 90% confidence level marked by black contours. (b) Comparison of the fractional annual anomalies (%) and trends (straight) between the tropical (30°S–30°N)-mean wind speed (red) and surface Walker circulation (blue) calculated as mean speed within the square (6°S–6°N, 170°E–160°W) in (a).
Download figure:
Standard image High-resolution imageTo compare with the WASWind observations, figure 2 shows the corresponding results from 16 CMIP5 historical simulations with output of surface wind speed. It is noteworthy that the simulated trends are not as strong as those observed, consistent with sea level pressure-based studies (e.g., Power and Kociuba 2011). Because of inter-model difference in interdecadal oscillation (Sohn and Park 2010, Merrifield 2011), there is significant spread between the Walker circulation changes among the GCMs. We therefore divide them into two groups and modify the location of the square (figure 1(a)) representing the region of the Walker circulation accordingly. Figures 2(a) and (b) present the mean of six models with increasing Walker cell strength (2.12%/25 yr), and figures 2(c) and (d) illustrate the mean of the remaining 10 models with diminishing Walker cell strength (−1.27%/25 yr), both reaching the 90% confidence level. However, regardless of the sign of the Walker circulation changes, opposing trends occur in other regions to reach a balance in the tropical-mean, resulting in a weak and insignificant change in wind speed (±0.33%/25 yr). This separation between the tropical-mean trend and change of the Walker circulation is consistent with the WASWind observations.

Figure 2. Multi-model simulations for fractional change of surface wind speed during 1970–1995 in the CMIP5 historical experiment. (a), (c) Tropical distributions of the ratio of trend to climatology (color, %/25 yr), with regions exceeding the 90% confidence level marked by black contours. (b), (d) Comparisons of the fractional annual anomalies (%) and trends (straight) between the tropical (30°S–30°N)-mean wind speed (red) and surface Walker circulation (blue) calculated as mean speed within the square (5°S–5°N, 150°E–80°W) in (a), (c). Here, the 16-model (with available output) ensemble is divided into two groups with enhancing and reducing Walker circulation, and their means are shown in (a), (b) and (c), (d), respectively. The former model group includes 6 GCMs: ACCESS1.0, HadGEM2-CC/ES, IPSL-CM5A-LR/MR, MIROC5, and the rest 10 models belong to the latter.
Download figure:
Standard image High-resolution imageThe above-shown historical observations and simulations suggest that the spatial-mean surface wind speed change may not be directly linked to the change of the Walker circulation. This may shed light on the long-term equilibrium of global warming, putting forward an important question: What mechanism may play an enhancing role for the surface winds? The SST pattern effect (i.e., deviations from the tropical-mean warming) is a promising candidate, since it is an important dynamical forcing (Xie et al 2010) for the atmospheric circulation and regional precipitation change. In particular, it strengthens the Hadley cell near and to the south of the equator (Ma and Xie 2013).
To illustrate if the SST pattern effect contributes to the non-weakening of surface winds, figure 3 shows the ensemble-mean SST and surface wind changes in the 19 CMIP5 simulations for the 21st century. In figure 3(a), the vector wind change is largely consistent with the SST warming patterns (Xie et al 2010, Ma and Xie 2013). For instance, the El Nino-like SST warming peak in the eastern equatorial Pacific and Atlantic is associated with the slow-down of the Walker cell through the Bjerknes feedback (Bjerknes 1969) and a local strengthening of the Hadley cell (Ma and Xie 2013). The trade winds increase (decrease) in strength in the southeastern (northeastern) subtropical Pacific, associated with collocated minimum (maximum) of SST warming. This is consistent with the wind-evaporation-SST (WES) feedback (Xie and Philander 1994), in which stronger trade winds enhance evaporation, cooling SST, and in turn leading to stronger winds.
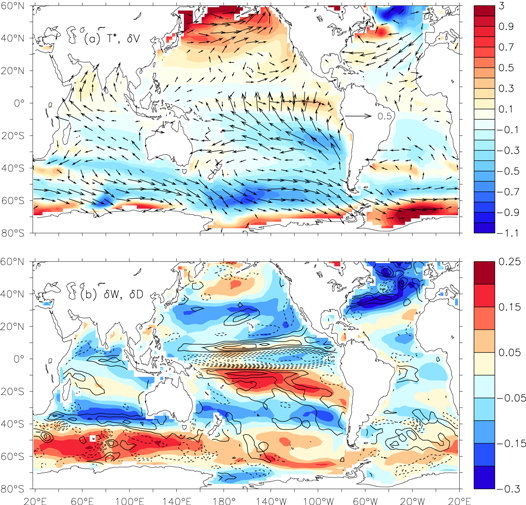
Figure 3. Ensemble mean of the SST and surface wind changes (2089–98 minus 2006–15) in the 19 CMIP5 simulations along RCP4.5, normalized by the tropical (20°S–20°N)-mean SST warming. (a) SST (color, K) and surface wind (vectors, m s−1) changes. (b) Speed (color, m s−1) and divergence (10−6 s−1, contour interval: 0.1) changes of the surface wind.
Download figure:
Standard image High-resolution imageFigure 3(b) shows the ensemble-mean change of the surface wind speed and divergence. Consistent with figures 1(a) and 3(a), the surface winds increase in the subtropical South Pacific (maximum), equatorial Atlantic, Indian, Southern Oceans, and northern mid-latitudes. Anomalous surface divergence co-locates with the center of weak SST warming—an effect of the WES feedback. The Walker circulation weakens in an eastern Pacific El Nino style, rather than the central Pacific flavor in figure 1(a), possibly due to natural variability in the eastern equatorial Pacific (Merrifield 2011). As a result, the global- and tropical-mean surface wind speed trends are statistically insignificant (table 1), both with values of −0.2% K−1 and with inter-model spread of 0.4% K−1. The CMIP3 output under the A1B scenario (table 1) is similar. Although the simulated measures are below the observed trend (Wentz et al 2007), they fall well within the tropical error bar (−0.5% to 6.5% K−1) and are close to the global lower limit of 1.5% K−1.
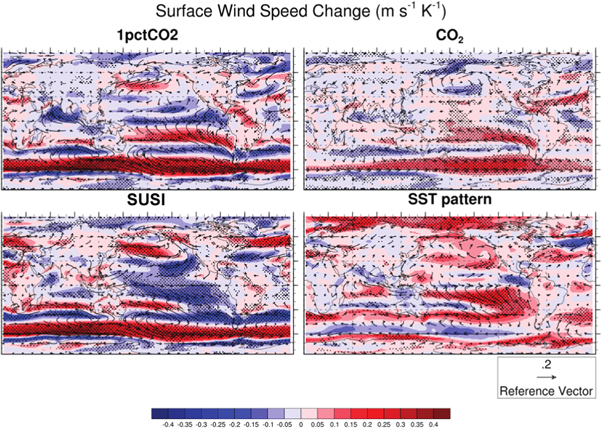
The SST pattern effect is therefore a strong candidate to mitigate the MASC effect in weakening the surface winds, which is indeed confirmed in figure 4. Contributions of several factors to surface wind change are examined with a series of AMIP experiments in the CMIP5 archive. The 1pctCO2 represents total climate change with patterns resembling figure 3, which is decomposed into three constituents: CO2 has a weak effect on the strengthening of trade winds in the southeastern Pacific. Change over the tropical ocean can be understood as the offset of SUSI and SST pattern effects: the former nearly uniformly weakens the surface winds, while the latter makes a positive contribution on average, especially for the enhanced trades in the subtropical South Pacific.
Figure 4. Ensemble mean changes (m s−1) in surface wind (vector) and its speed (color) of different forcing factors based on the 1pctCO2 and 3 AMIP experiments in the CMIP5 archive. The 1pctCO2 represents total climate change by using years 121–140 minus 1–20, the direct CO2 as AMIP4xCO2 minus AMIP, the SUSI as AMIP4K minus AMIP, and the SST pattern effect as the residual of 1pctCO2—CO2—SUSI. Areas where at least 8 (out of 9) models agree on the sign of changes are stippled.
Download figure:
Standard image High-resolution image
Over land, the surface wind change is generally weaker than over the ocean (figure 4), so that the spatial-mean speed trend is similar with or without the land contribution (table 1). The dynamic offset effect of SUSI and SST patterns is apparently important (He et al 2014), though surface friction may be another cause of the reduced magnitude of the land wind response. Outside the tropics, the surface wind change appears as opposing belts, representing poleward shifts of the storm tracks and consistent with the Hadley cell expansion (Lu et al 2007). These mechanisms result in a near-zero trend of surface speed for the tropical and global means, either for the ocean only or with land included.
It is not the spatial-mean surface heating driving tropical atmospheric circulation, but the baroclinicity of the heating. Hence, it is reasonable that the SST anomaly can increase spatial-mean wind speed with a zero spatial-mean warming. However, global energy balance prohibits significant footprint of SST patterns on the global-mean precipitation. Although figure 3 shows dominance of the SST patterns in regional precipitation change through anomalous surface divergence (Ma and Xie 2013), this tends to be conserved as shifts (Chadwick et al 2013). The influence on the global-mean rainfall is rather weak (−0.3% K−1) for SST in figure 4, compared to other factors (1.5, −0.7, and 2.5% K−1 for 1pctCO2, CO2 and SUSI, respectively). Thus, the GCMs predict precipitation to increase at 2%–3% K−1 according to the large-scale slow-down, close to the lower limit of observations (3.5% K−1), indicating that rainfall projections are also considerably consistent with the observed trend.
4. Conclusion and discussion
The present study reconciles different views in the literature on whether surface winds will slow down across the globe and tropics in response to global warming by showing consistency between observations and predictions. The observations presented in this study indicate that over the latter part of the 20th century, surface winds have not weakened in the tropical average, despite a weakening in the region local to the Walker circulation. This is consistent with past trend estimation from satellite measurements (Wentz et al 2007) of surface wind speed averaged in the global (1.5 to 8.5% K−1) and tropical (−0.5 to 6.5% K−1) oceans. Historical simulations and future projections for climate change indicate near-zero spatial-mean changes for surface wind speed, close to the lower limit of the observational trends, but far from weakening shown by the surface Walker and tropospheric circulations (Held and Soden 2006).
Multiple mechanisms are responsible for inducing near-zero wind speed change in both the tropical- and global-mean predictions. The SST pattern effect enhances the surface winds, opposing the large-scale processes that weaken the tropical circulation, while poleward shifts of the jet streams dominate in the extra-tropics. Due to global energy balance, the SST patterns cannot have a significant influence on the global-mean precipitation change; hence, the GCM-projected global rainfall has a 'muted' change rate (2–3% K−1) compared to that of the atmospheric moisture increase. Attributed to the large-scale circulation slow-down, this rainfall change is also close to the lower limit of the above-mentioned satellite observations (3.5–8.5% K−1). These results show considerable consistency between the predictions and observations for both surface winds and rainfall changes, enhancing our confidence in climate change projections.
In figure 1(b), with ratio of wind speed trends of ∼1/2 and that of the standard deviations of <1/4, the tropical-mean wind anomalies are substantially weaker than those of the Walker cell on time-scales such as interannual and climate change. In addition, figures 2(b) and (d) show that the tropical-mean wind speed does not vary significantly in relation to positive or negative phases of interdecadal oscillations. This suggests that there may be some forms of constraints that prevent the spatial-averaged surface winds from changing substantially, which is worth exploring in future study. Indeed, angular momentum conservation is one approach, since the rotational wind may not change proportional to the divergent wind where different constraints apply here. The divergent wind is associated with vertical motion constrained thermodynamically or radiatively, while the rotational wind is more controlled by potential vorticity conservation and thermal-wind relation. Although the MASC mechanism (Ma et al 2012) suggests that the vertical wind shear would reduce with weaker horizontal gradient of the tropospheric temperature, its rate of change still needs to be quantified. Another possibility may come from the surface latent heat budget. As a crucial factor for surface evaporation, wind speed was surprisingly found to be the weakest contributor that 'mutes' the evaporation increase in global warming (Richter and Xie 2008). The weak surface relative humidity (RH) change may contribute to constrain the surface winds, since 1% increase in RH can reduce evaporation by up to 4% (Richter and Xie 2008).
Indeed, near-surface wind speed change has important implications for the impacts of climate change. For instance, wind energy is roughly proportional to its third power, and calm winds favor air pollution, so that reduced wind power and enhanced haze formation would be expected from the weakening of the tropical atmospheric circulation (McVicar and Roderick 2010). However, the near-zero surface speed trend indicates that these unwelcome changes may not occur in the future, which enhances our confidence on global potential wind energy and mitigates public anxiety on haze intensification, especially with the dramatically strengthened trade winds in the subtropical South Pacific. Figure 4 provides promising explanations for recently found increase of wind energy and haze conditions in northern Europe (Pryor et al 2005) and the western US (Horton et al 2014), respectively, showing SUSI effects (poleward eddy shift and MASC) mitigated by the SST patterns. Wind energy and days of atmospheric stagnation were reported changing little in the US (Pryor and Barthelmie 2011) and China (Dawson 2014), respectively, because the SST pattern-enforced wind speed increase opposes the MASC effect, consistent with the Pacific-North American pattern (Straus and Shukla 2002). Since the SST pattern effect is not as straightforward on land as over ocean, future in-depth studies are required, particularly for regions with popular concerns on sustainable energy and environmental protection, e.g., the American and Eurasian continents.
Acknowledgments
We thank H Tokinaga for correcting the ICOADS surface wind speed and making the WASWind dataset available at http://dpac.dpri.kyoto-u.ac.jp/tokinaga/waswind.html. We acknowledge various modeling groups for producing and providing their output, the PCMDI for collecting and archiving the CMIP5 multi-model dataset, the WCRP's WGCM for organizing the analysis activity, and the Office of Science, US Department of Energy for supporting this dataset in partnership with the Global Organization for Earth System Science Portals. The AOML internal reviewer, S-K Lee is gratefully appreciated for helpful suggestions. S-P Xie and R Chadwick gave valuable comments to improve the work. Y Zou and others are gratefully appreciated for the interdisciplinary discussion at the AGU Fall Meeting 2015. The two anonymous reviewers including one board member are gratefully appreciated for their guidelines to improvements. The Ferret program was used for analysis and graphics. This work is funded by Shanghai Chair Professor-Eastern Scholar Program, NOAA/CPO's Climate Observations and Monitoring Program, and base funds to NOAA/AOML, and supported by NSFC (41476022, 41490643, and 41675070), NBRPC (2012CB955604, 2012CB955601), NOYSFPC (41425019), BOEM (M14AC00021), and NUIST Startup Grants.