

Abstract
Precipitation amounts over East Africa have been declining over the last decades. These changes and future climate change over the region are highly debated. This study analyzes drivers of future precipitation changes over East Africa by applying a classification of circulation patterns on 15 historical and future members of the COordinated Regional climate Downscaling EXperiment. Typical circulation types (CTs) are obtained. Under a high emission scenario, changes in the frequency of occurrence of these CTs attribute for 23% of the total change in precipitation over East Africa by the end of the century. The remaining part (77%) is not related to East African synoptics, e.g. changes in moisture content, local/mesoscale feedbacks, and changes in moisture influx. These other effects comprise increases in precipitation close to the equator and the Somali region, while decreases are found over northwestern Ethiopia, the Sudan region and the lake areas.
Export citation and abstract BibTeX RIS

Original content from this work may be used under the terms of the Creative Commons Attribution 3.0 licence. Any further distribution of this work must maintain attribution to the author(s) and the title of the work, journal citation and DOI.
1. Introduction
Climate over East Africa is characterized by high interannual variations in precipitation numbers, contributing to a frequent succession of extreme dry and wet periods (e.g. Nicholson 1996, Segele et al 2009b). Moreover, in recent decades, a continuous decline in precipitation numbers is observed (Lyon and DeWitt 2012, Viste et al 2013, Liebmann et al 2014, Niang et al 2014, Tierney et al 2015). This puts the population, depending on rainfall in their water-fed agricultural system, under great pressure (Conway and Schipper 2011, Anyah and Qiu 2012, Hawinkel et al 2016). Currently, there is a lack of understanding of the physical and dynamical processes contributing to this interannual variability and the observed decline in precipitation. Most research has focused on identifying the relationship between precipitation amounts and El Niño Southern Oscillation (ENSO) or Indian Ocean Dipole (IOD) events (Nicholson 1996, Indeje et al 2000, Behera et al 2005, Anyah and Semazzi 2006, 2007, Omondi et al 2012, 2013, Tierney et al 2013). In general, dry periods are associated with La Niña and/or negative IOD events, while wet periods coincide with El Niño and/or positive IOD events (Nicholson and Kim 1997, Schreck and Semazzi 2004). However, these processes do not explain the full precipitation variability over East Africa. These caveats in understanding the present precipitation climate contribute to uncertainty in future climate projections. Numerous Global (GCM) and Regional Climate Model (RCM) studies project an increase in annual precipitation over the areas located near the equator and the Greater Horn of Africa (Shongwe et al 2011, Otieno and Anyah 2013, Niang et al 2014, Buontempo et al 2015, Dosio and Panitz 2016, Kent et al 2015), contrasting the current drying trend. This apparent contradiction has been termed the East African climate paradox and its causes so far remain unclear (Rowell et al 2015). Some authors attribute part of the future increase in precipitation to an enhancement of water vapor content in a warmer world and an intensification of moisture transport in the Hadley circulation (Seager et al 2010, Niang et al 2014). However, Tierney et al (2015) point out that the interpretation of precipitation changes over the Greater Horn of Africa should be done with care due to a possible wrong representation of the Walker circulation in current state-of-the-art climate models. Dynamical influences are also thought to be a significant driver of precipitation changes over the region (Shongwe et al 2011), as are changes in the frequency of occurrence of IOD and ENSO events towards the future (Conway et al 2007, Cai et al 2009).
To gain insight in projected future drivers of precipitation changes, Emori and Brown (2005), Long et al (2016) analyzed changes in the 500 hPa vertical velocities in order to disentangle the thermodynamical and dynamical drivers of the precipitation change signal, whereas Kent et al (2015) decomposed the precipitation signal based on a mass flux approach (Chadwick et al 2013). These studies found that thermodynamical increases in precipitation are an important driver of precipitation changes over the tropics in the annual mean, although they also stress the importance of dynamical changes, in particular the slowdown of the tropical circulation, counteracting thermodynamical increases (Kent et al 2015, Long et al 2016). All authors used GCM output at low resolution, smoothing local orography and in turn limiting the representation of local airflow patterns.
This study uses a classification of circulation patterns to analyze future changes in precipitation in an ensemble of RCM projections over East Africa. The study area approximately covers the area between 14.25° S and 15° N latitudes, and between 25° E and 60° E longitudes (figure 1). It roughly comprises the following countries: South Sudan, Ethiopia, Djibouti, Somalia, Kenya, Uganda, Tanzania, Burundi, Rwanda, the eastern part of DR Congo and the northern parts of Zambia, Malawi and Mozambique. Further, it also covers part of the Indian Ocean. Classifying circulation patterns is a common practice over mid-latitudes. It has been used by many authors to construct a weather atlas over a specific region (e.g. Littmann 2000, Schiemann and Frei 2010) or to relate specific circulations to other atmospheric parameters (e.g. Huth et al 2008, Demuzere et al 2009, 2010), but in general these studies focused on the European continent. Over equatorial regions, classifying circulation patterns have not yet been used to provide insight in climate variability and climate change. Furthermore, this approach allows to separate the total precipitation change signal into two main classes of driving processes, precipitation changes related to changes in the frequency of occurrence of circulation patterns (further denoted as East African synoptics) and other processes. The second component is a residual term, comprising mainly thermodynamical changes in moisture content and local/mesoscale feedbacks. Since we use high resolution RCMs, local airflow is identified, allowing precipitation changes to be related more easily to their driving process.

Figure 1. ERA-Interim historical weather atlas for the period 1981–2010: resulting circulation types using the SANDRA classification algorithm together with the corresponding PERSIANN-CDR precipitation pattern.
Download figure:
Standard image High-resolution image2. Data and methodology
In order to determine the link between circulation patterns and precipitation over East Africa, a classification of mean sea level pressure fields over the region was conducted. The goal of this classification is to transfer the multivariate information of daily mean sea level pressure fields to a univariate time series of type membership, i.e. a so-called classification catalog where each day is assigned to a certain typical circulation type (Philipp et al 2010). The classification was executed on ERA-Interim reanalysis data for the period 1981–2010 (Dee et al 2011) using the COST733class software which consists out of an inventory of 72 classification algorithms (Philipp et al 2016). The SANDRA optimization algorithm with a total of nine typical circulation types (CTs) was selected based on a thorough evaluation (Text S1).
Typical CTs can be depicted together with their corresponding precipitation amounts and their monthly frequency resulting in an overview of the synoptic climatology for East Africa, a so-called weather atlas. Daily precipitation observations are obtained from the PERSIANN-CDR dataset (Ashouri et al 2014), which is retrieved from satellite data and has a long term record (from 1983 on) at high spatial resolution (0.25° by 0.25°). Although the dataset is characterized by a significant positive bias (Pfeifroth et al 2016), it is considered a reliable gridded precipitation product over the African continent (Awange et al 2016). The PERSIANN-CDR data is remapped using conservative remapping to attain the spatial resolution of ERA-Interim data (Jones 1999).
The COordinated Regional climate Downscaling EXperiment (CORDEX) model ensemble is used to calculate differences in precipitation amounts between a historical (1981–2010) and future (2071–2100) period under a high-emission scenario (RCP8.5). The ensemble consists of the 15 members that were freely available over Africa based on four RCMs which downscale nine GCMs to a resolution of 0.44° by 0.44° (table S2). This is the first time that multi-RCM CORDEX ensemble projections are investigated over the whole of East Africa. A RCM ensemble approach is used since it enhances the representation of local/regional processes over East Africa compared to GCM studies (Thiery et al 2015, 2016). Further, CORDEX RCM ensembles improve the representation of the annual precipitation cycle over Africa compared to GCMs (Nikulin et al 2012, Buontempo et al 2015, Dosio et al 2015). An evaluation of the historical ensemble was achieved by comparing precipitation output with the PERSIANN-CDR dataset for the period 1983–2010. Conservative remapping is executed on the original PERSIANN-CDR data to attain the same spatial resolution. Overall, a scattered pattern of positive and negative biases are seen related to a wrong representation of convection in some models (±40%). Further, biases are mostly limited to the Ethiopian Highlands, and the northeastern part of the Congo basin, attaining an overall negative bias (locally as much as −80%) (Text S2; figure S3).
In order to attribute the precipitation change signal to an East African synoptic component, the classification technique stated above was executed on all CORDEX members for the historical and future period simultaneously (i.e. by concatenating the 15 historical and future members for 30 years each to a single time series), obtaining a new set of CTs representative for the whole ensemble. By using this approach, circulation changes of the individual models are retained. Furthermore, in case of large changes in the future period, this also allows to account for the potential emergence of new CTs.
For each typical circulation type (j), changes in their relative frequency ( ) between the historical and future period were calculated. By relating these changes in the frequency of occurrence to precipitation amounts (P), the East African synoptic part of the total precipitation change signal in the ensemble was estimated

Subsequently, for every typical circulation type changes in precipitation amounts between the historical and future period were calculated. Weighing this with the circulation pattern relative frequency accounts for other effects changing precipitation

This component accounts for the changes in precipitation that occur without changing East African circulation. It therefore comprises mainly of changes in moisture content (e.g. through changing evapotranspiration) and local/mesoscale feedbacks (lake/land/sea breezes, orographic circulation, ...). As this is a residual term, it also accounts for changes in precipitation due to circulation changes occurring outside of the region for which the CTs were derived, potentially affecting moisture influx at the boundaries of the domain. The sum of the East African synoptic component (equation (1)) and the other effects (equation (2)) attains for the total precipitation signal, which can be checked by applying the distributive rule of summation algebra.
The methodology above depends on various parameters, such as the number of CTs and the extent of the domain. However, it was found that the values of these parameters have only limited influence on the subdivision of the precipitation change signal over East Africa (Text S3 and figures S6 and S7).
Before applying this technique to future precipitation changes, we tested its capability of detecting synoptic/interannual precipitation variability in the present-day climate (1983–2010). In particular, we compared monthly precipitation from the PERSIANN-CDR dataset to the predicted monthly precipitation based on the CTs derived from the ERA Interim dataset:

Here,  is the predicted precipitation for a certain pixel i during the month m,
  is the number of times every cluster j occurred during the month m and
  is the average precipitation for pixel i in cluster j for the CTs derived from the ERA Interim dataset. Subsequently, the root mean square error and the coefficient of variance between the predicted precipitation and PERSIANN-CDR are calculated (figure S8). Two regions are identified showing the lowest biases: the Horn of Africa and the land areas south of 5° S. For each of these two subregions, an extra analysis is performed to establish the relation between circulation patterns and interannual precipitation variability more clearly.
In the Horn of Africa, a clear link between ENSO and precipitation variability has been identified in literature (Nicholson and Kim 1997, Indeje et al 2000). Therefore, the ENSO index is compared to the circulation-based predicted precipitation over the Horn of Africa (equation (3)), on which we applied a normalization and a running mean of 12 months (figure S9a). A similar analysis is performed for the southern part of the study area. However, for this area, no clear driver of precipitation variability has been identified in literature (e.g. Nicholson and Kim 1997, Vizy and Cook 2001, Shongwe et al 2011). Hence, the circulation-based predicted precipitation is compared directly with PERSIANN-CDR observed precipitation. All quantities were normalized and a running mean of 12 months was applied. For both regions good correspondence between the two measures is found. Furthermore, CTs were shown to skillfully predict observed precipitation over the southern areas (figure S9b). Our results indicate that the applied methodology is able to capture synoptic controls on precipitation variability in two selected subregions. We therefore conclude that our decomposition methodology can be applied to assess the drivers of future precipitation changes for these regions. Signals in other regions should, however, be treated more carefully.
3. Circulation classification
In this section, we present a weather atlas for the region by applying the SANDRA algorithm on ERA-Interim mean sea level pressure data (figures 1 and 2). A clear seasonality in CTs and their frequency of occurrence is observed. Typical boreal winter CTs (e.g. CT 1 and 2) are dominated by high pressures and low rainfall amounts north of the equator. To the south, pressure decreases while precipitation increases. These CTs relate to the location of the intertropical convergence zone (ITCZ) in the southern part of the domain (south of ∼10° S) and the ascending branch of the Hadley cell. The descending branch is located north of the study area.

Figure 2. Monthly relative occurrence of the circulation types depicted in figure 1 during the period 1981–2010 based on ERA-Interim data.
Download figure:
Standard image High-resolution imageMarch marks the start of the long rain season in Somalia and the southeastern part of Ethiopia, which lasts till May. A shift towards higher frequencies of occurrence of CT 3 and 4 is observed (>60%), having more northerly precipitation. However, CT 1 and 2 are still present in 30% of the cases (figure 2). This shift represents the northward movement of the ITCZ zone, which is expected during boreal spring. The occurrence of CT 1 and 2 during this month is attributed to the strong interannual variability of the migration of the ITCZ, whereby it moves north earlier in some years compared to others, accounting for a high interannual variability in precipitation amounts over the Greater Horn of Africa during this month.
In April, CT 3 and 4 still occur approximately 40% of the time, but the dominant pattern in the region now corresponds to CT 5 (figure 2). Central continental parts (between 10° N and 5° S) of the study area attain rainfall amounts higher than 3 mm d−1 during the occurrence of this circulation type (figure 1). This is due to the development of a low over southern Sudan. Winds from the Gulf of Aden and the Indian Ocean high pressure zones converge towards this low and blow across central and southern Ethiopia. These moist, easterly and southeasterly winds produce the main rains in southeastern Ethiopia and Somalia (Nicholson 1996, 2000, Seleshi and Zanke 2004). There, the long rain season is now in full development and the occurrence of CT 5 is of great importance for the rain-fed agricultural systems.
May is characterized by a large variety of CTs. CT 5 occurs approximately half of the time, but also CT 6 (∼15%) and 7 (∼20%) take place (figure 2). The pressure pattern of CT 6 resembles CT 5, but precipitation over Somalia and southeastern Ethiopia is considerably lower (<2 mm d−1). CT 7 has a very low pressure zone located north of Somalia (values down to 1002 hPa). Under these conditions the Ethiopian Highlands are still characterized by high pressures (1014 hPa) and high rainfall amounts, but no rain is expected over Somalia and southeastern Ethiopia.
The boreal summer months June–August are nearly always characterized by CT 7 and 8. A high pressure zone and precipitation rates exceeding 10 mm d−1 are present over the Ethiopian Highlands. Northeast of this high pressure core, contour lines are very close to each other, which indicates the presence of a through (figure 1). A westerly flow is present over the study area, opposite to a high level easterly flow, carrying monsoon rains from the Gulf of Guinea (Nicholson 2000, Seleshi and Zanke 2004).
September marks the start of the short rain season over Somalia and southeastern Ethiopia. CT 6 brings precipitation over these regions, taking place more than 30% of the time (figures 1 and 2). However, CT 9, a summer circulation type, dominates this month (50%), attaining for no precipitation over the Greater Horn of Africa.
In November the end of the short rain season is reached and a high variety of CTs is found (figure 2). This causes a high variability in rainfall amounts. On the one hand CT 1, 2 and 3 together appear in 40% of the cases, generating no precipitation north of the equator. On the other hand CT 4 is present half of the time, attaining for precipitation values higher than 1 mm d−1 over Somalia and southeastern Ethiopia.
Each season is defined by two or three main CTs and corresponding precipitation patterns (figures 1 and 2). Furthermore, synoptic systems are very persistent over time on a single location (Nicholson and Kim 1997). This contrast with the European region, where synoptic systems are characterized by day-to-day variability. As the climate over East Africa is dominated by the movement of the ITCZ zone over the region, most synoptic anomalies are caused by a too slow (fast) onset of the movement of the ITCZ. This, in turn, leads to an early (late) start (end) of the precipitation season.
As such, the circulation-based approach can also be used to study inter-annual precipitation variability over the region. For instance, the extreme drought hitting the Horn of Africa in 1988–9 can be investigated in terms of anomalous synoptic conditions. Our CT classification indicates that during these two years, boreal winter and boreal summer CTs (CTs 1, 2 and 3 and 7, 8 and 9 respectively) were relatively more abundant. In particular, changing CT frequencies suggest the late onset and early end of the long rain season as well as the late onset of the short rain period, rather than changing circulation (and precipitation) at the height of the wet periods. This indicates that shorter wet periods rather than lower peak precipitation is the main driver of the 1988-89 drought, consistent with earlier findings (Segele et al 2009a, Gong et al 2016).
4. Drivers of future precipitation changes
Several studies using RCM and/or GCM data project a wetting for the equatorial part of East Africa (Shongwe et al 2011, Otieno and Anyah 2013, Niang et al 2014, Kent et al 2015, Long et al 2016). The CORDEX-RCM ensemble confirms the increase in precipitation for this part of the study area (figure 3(a); see also Dosio and Panitz 2016, Buontempo et al 2015, Descy et al 2015). In the Horn of Africa, where rainfall amounts are low, a similar absolute increase was found. Significant decreases in precipitation are projected in the northwestern parts of our study area (−0.2 mm d−1) and the Ethiopian Highlands (−0.5 mm d−1). Further, some localized drying areas are detected in the central/southern part of the study area, attaining values lower than −0.5 mm d−1. These areas correspond to the different lakes that are present: Lake Victoria (located at the border of Uganda, Kenya and Tanzania), Lake Tanganyika (at the border of Tanzania and DR Congo) and Lake Malawi (at the border of Malawi, Mozambique and Tanzania). Lastly, a reduction in precipitation is projected over the Congo basin (locally up to −0.3 mm d−1). Note that highest biases were found here (figure S3) and the CORDEX-RCM ensemble does not take land use and land cover changes into account. Considering a realistic deforestation scenario for the Congo basin has been shown to add an additional drying up to 10% to this region (Akkermans et al 2014).

Figure 3. (a) Absolute precipitation changes between 1981–2010 and 2071–2100 (RCP8.5). Statistical significance at the 1% level was tested by applying the two-sided non-parametric Kolmogorov–Smirnov test on the annual mean precipitation amounts of the different members in the historical and future period and is denoted by the black diamonds. Subdivision of the total absolute change signal into an East African synoptic component (b) and other effects (c).
Download figure:
Standard image High-resolution imageDecomposing the total future precipitation change signal (see section 2) yields a fraction of 23% to be attributed to the East African synoptic component, while as much as 77% is assigned to other effects (figures 3(b) and (c); the CORDEX-based historical weather atlas and the corresponding frequency of occurrence on which this decomposition is based are depicted in figures S4 and S5).
The East African synoptic component comprises precipitation changes related to differences in the frequency of occurrence of CTs between the historical and future period. In general, frequency changes are observed in each month of the year (figure 4). Nevertheless, the resulting precipitation change is only 23% of the total. In contrast to the total precipitation change signal, the East African synoptic component shows a drying south of the equator (values between −0.1 and −0.2 mm d−1), while increases are found over the Ethiopian Highlands (local increases up to +0.2 mm d−1; figure 3(b)).
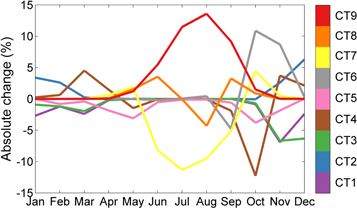
Figure 4. Changes in the frequency of occurrence of the circulation types between the historical and future period of the CORDEX-RCM ensemble. The CORDEX historical weather atlas is depicted in figure S4. The frequency of occurrence during the historical period is depicted in figure S5.
Download figure:
Standard image High-resolution image
The most pronounced frequency change is observed during boreal summer months (figure 4). A clear increase in the frequency of occurrence of CT 9 is observed in favor of CT 7. However, these circulation patterns have approximately the same precipitation pattern (figure S4). The main difference between both is the fact that CT 9 is characterized by higher pressure in the northern part of the study area. This increase in pressure over equatorial regions towards the future is consistent with earlier findings (Stocker et al 2013).
In October, enhanced frequency of occurrence of boreal summer CTs 6 to 9 is compensated by the less frequent occurrence of CTs 4 and 5 (figure 4). Summer-like CTs are likely to persist longer, generating more rain in the northern areas and the Horn of Africa and less rain south of the equator and over the Congo basin. This feature partly persists into November, where boreal winter CTs occur less often. Frequency changes in these two months partly explain the drying over the Congo basin and the areas south of the equator (figure 3(c)). Other small changes in the frequency of occurrence of the boreal winter and spring CTs do not affect precipitation amounts significantly.
The other effects show a similar spatial pattern as the total change in precipitation. Increases in precipitation are found during the rain seasons of the different subregions, when the ITCZ overpasses. Several authors relate this to an increase in moisture content and increased moisture transport in the Hadley cell in a warming world (Held and Soden 2006, Long et al 2016). For Somalia and southeastern Ethiopia, most of the precipitation increase occurs indeed during their long (March–May) and short (September–December) rain season (figures S4 and S5). Further, the easterly winds originating from the ocean areas blowing over the land contain increased moisture content inducing higher precipitation amounts. The drying over the Ethiopian Highlands and the Sudan region is also assigned to other effects. This drying is projected to occur during the main rain season (during boreal summer; figures S4 and S5) and is due to an increase in sea surface temperature over the Gulf of Guinea and a lowering of the low-level geopotential height, leading to lower amounts of moisture transport by the westerly winds which draw monsoon rains from the Gulf of Guinea to the area (Neupane and Cook 2013, Lyon 2014). A last remarkable feature in figure 3(c) is the drying over the lakes. Precipitation production over the African Great Lakes is governed by mesoscale circulation and local moisture supply through lake evaporation (Thiery et al 2015). Using dedicated high-resolution regional climate simulations, Thiery et al (2016) found that the projected average precipitation decrease over the African Great Lakes is caused by altered mesoscale circulation patterns. The use of a high-resolution RCM coupled to a lake model is a key prerequisite to discriminate this drying over the lakes.
Only a low fraction of precipitation changes is attributed to the East African synoptic component, while other studies consider synoptic changes over the Horn of Africa to be significant as well (Emori and Brown 2005, Kent et al 2015, Long et al 2016). Dynamical decreases occur most often in regions where thermodynamical increases in precipitation are found, i.e. due to a slowdown of the tropical circulation (Kent et al 2015, Long et al 2016). This can also be seen in our results, where a decrease in East African synoptics south of the equator is found (figure 3(b)). The reason for the discrepancy between results partly lies in the definition of the different components. In our case, other effects include thermodynamical changes, but also local/mesoscale feedbacks and changes in moisture influx due to changes in synoptics that occur outside our domain. As such, a direct comparison of our results to Emori and Brown (2005), Kent et al (2015) and Long et al (2016) is not possible.
5. Conclusion
Prior work has stated different reasons for changes in precipitation over the East African region, ranging from increases in moisture content to changes in synoptics. Emori and Brown (2005) made a first subdivision of the precipitation change signal into a thermodynamical and dynamical component. They investigated changes in vertical velocity at the 500 hPa level to obtain a global overview of the causes of changes in precipitation. Here, a formal classification of circulation patterns on ERA-Interim and the 15 members of the CORDEX-RCM ensemble was executed over East Africa. A weather atlas was obtained and a subdivision of the total projected precipitation change signal into an East African synoptic component and other effects was conducted. In the present-day climate, atmospheric circulation and associated precipitation patterns are dominated by the location of the ITCZ over the region, with variations to this general pattern marking early (late) transitions between wet and dry periods (and vice versa). For the future, we find that less than 23% of the total change signal can be attributed to changes in the frequency of occurrence of CTs over East Africa. More than 77% is due to other effects, comprising mainly changes in moisture content and local/mesoscale feedbacks. One important advantage of using RCMs at high resolution is the fact that small-scale air flows are resolved so precipitation changes can be attributed more easily to local processes.
Changes in East African synoptics result in a drying and wetting for respectively the regions south of the equator and the Ethiopian Highlands, while other parts of the Horn of Africa are not affected. These changes are mainly restricted to the months October and November, characterized by an enhanced frequency of the typical boreal summer CTs at the expense of the boreal winter CTs.
For southeastern Ethiopia and Somalia, the increase in precipitation is related to an enhancement of water vapor content in a warmer world and an intensification of moisture transport in the Hadley circulation (Seager et al 2010, Niang et al 2014). Also, increased moisture transport from easterlies to the Horn of Africa attributes for higher precipitation amounts during the rain seasons. The strong decrease in precipitation over the African Great Lakes may be attributed to changes in mesoscale circulation (Thiery et al 2016). Decreases in precipitation over Sudan and the Ethiopian Highlands during their rain season are caused by lower amounts of moisture transport from the Gulf of Guinea and a local lower geopotential height (Neupane and Cook 2013). These circulation changes outside the domain of study are not captured by our CTs. This implies that a detailed study on the effect of synoptics for this specific region would need an extension of the domain for which CTs are derived to cover the Gulf of Guinea.
Future research could focus on elaborating this technique in other parts of the world in order to gain a higher level of understanding in changes of precipitation over the globe.
Acknowledgments
We thank two anonymous referees for reviews that markedly improved our paper. This work was financially supported by the Belgian Science Policy Office (BELSPO) through the research project EAGLES. Wim Thiery is an ETH Zürich postdoctoral fellow, Matthias Demuzere is a postdoctoral fellow at the Research Foundation Flanders (FWO). The authors declare no conflict of interest. All data and methods to reproduce the results of this study are described in section 2 and the supporting information. The COST733class software is freely available and can be downloaded on the following web page http://cost733.geo.uni-augsburg.de/cost733class-1.2. CORDEX model data is freely available from the ESGF servers (http://esgf.llnl.gov/), ERA-Interim data from ECMWF (http://www.ecmwf.int/en/research/climate-reanalysis/era-interim) and PERSIANN-CDR from NOAA (https://www.ncdc.noaa.gov/cdr/atmospheric/precipitation-persiann-cdr).