

Abstract
Tropical dry forests are already undergoing changes in the quantity and timing of rainfall, but there is great uncertainty over how these shifts will affect belowground carbon (C) cycling. While it has long been known that dry soils quickly release carbon dioxide (CO2) upon rewetting, the mechanisms underlying the so-called 'Birch effect' are still debated. Here, we quantified soil respiration pulses and their biotic predictors in response to simulated precipitation events in a regenerating tropical dry forest in Costa Rica. We also simulated the observed rewetting CO2 pulses with two soil carbon models: a conventional model assuming first-order decay rates of soil organic matter, and an enzyme-catalyzed model with Michaelis–Menten kinetics. We found that rewetting of dry soils produced an immediate and dramatic pulse of CO2, accompanied by rapid immobilization of nitrogen into the microbial biomass. However, the magnitude of the rewetting CO2 pulse was highly variable at fine spatial scales, and was well correlated with the size of the dissolved organic C pool prior to rewetting. Both the enzyme-catalyzed and conventional models were able to reproduce the Birch effect when respiration was coupled directly to microbial C uptake, although models differed in their ability to yield realistic estimates of SOC and microbial biomass pool sizes and dynamics. Our results suggest that changes in the timing and intensity of rainfall events in tropical dry forests will exert strong influence on ecosystem C balance by affecting the dynamics of microbial biomass growth.
Export citation and abstract BibTeX RIS

Original content from this work may be used under the terms of the Creative Commons Attribution 3.0 licence. Any further distribution of this work must maintain attribution to the author(s) and the title of the work, journal citation and DOI.
Introduction
Dry soils release large pulses of CO2 upon rewetting, a phenomenon known as the 'Birch effect' (Birch 1958). These rewetting pulses can constitute a substantial portion of annual soil CO2 flux in arid or seasonally dry ecosystems (Schimel et al 2007, Wang et al 2015). Thus, relatively modest changes in the quantity or timing of precipitation may have disproportionately large impacts on ecosystem carbon (C) balance in seasonal systems. Consequently, understanding the mechanisms that generate the Birch effect is necessary to predict ecosystem-scale responses to climate change.
Controls on the magnitude of the Birch effect are poorly understood, but may be broadly grouped into three categories: climatic, edaphic, and biotic. The size of rewetting CO2 pulses appears to be dependent on the magnitude of the rewetting event (i.e. the change in soil water potential; Lado-Monserrat et al 2014) as well as the frequency of rewetting events (Fierer and Schimel 2002) and the length of time between each precipitation pulse (Xiang et al 2008). These climatic effects may be mediated by soil texture (Moyano et al 2012), as responses to rewetting events are attenuated in clay-rich soils (Harrison-Kirk et al 2014).
Ultimately, the soil microbial community exerts the most proximate control over rates of C mineralization in soils. It is hypothesized that the Birch effect is generated by an immediate release of microbial osmolytes upon rewetting and/or rapid metabolism of organic substrates released by disruption of soil structure (Unger et al 2010, Jenerette and Chatterjee 2012, Moyano et al 2013). Microbial community structure also plays an important role in mediating responses to rewetting, as different microbial clades display distinct ecological strategies to cope with the stress of rapid fluctuation in soil moisture (Lennon et al 2012, Placella et al 2012).
Drying-rewetting cycles may exert particularly strong control over ecosystem biogeochemical cycles in tropical dry forests (TDFs), which experience annual dry seasons of at least three months. Nutrients immobilized in microbial biomass during the dry season are rapidly mineralized at the onset of the wet season, supporting plant nutrient demand (Singh et al 1989). Due to these complex interactions among precipitation seasonality, plant growth, and microbial biomass dynamics, ecosystem C storage appears to have a nonlinear relationship with rainfall (Rohr et al 2013), and terrestrial ecosystem models have difficulty predicting C cycle dynamics in TDF under future climates. This is due in large part to uncertainties about the response of soil C to changes in rainfall and soil moisture (Sitch et al 2008). Moreover, biogeochemical pools and fluxes in TDF can exhibit extremely high heterogeneity at fine spatial scales (Waring et al 2016), which may complicate efforts to extrapolate patterns from local to regional scales.
To gain a better understanding of the relationships between precipitation and soil C cycling in TDF, we monitored soil respiration over seasonal transitions in a regenerating TDF in Guanacaste, Northwest Costa Rica. We also conducted a manipulative experiment to examine effects of rapid rewetting on soil C and N pools, and attempted to replicate these dynamics in the context of a simple soil carbon simulation model. Our goals were to understand what controls the magnitude of CO2 fluxes in response to changes in rainfall, and how to represent these dynamics in predictive ecosystem models.
Our soil wetting experiment used an unreplicated block design to identify controls on the magnitude of the Birch effect. There were four treatment blocks, allowing us to capture natural heterogeneity in soil properties across the landscape. Within each block, three plots were randomly assigned to one of three treatments: control (no precipitation inputs), wetting (a single, 50 mm rainfall pulse) and a re-wetting treatment (two 50 mm pulses, separated by 24 h). We predicted that the magnitude of the Birch effect would decline upon rewetting, since CO2 is flushed out of soil pore space during the first wetting, and available dissolved organic carbon (DOC) is depleted (H1). We also anticipated that the size of rewetting CO2 pulses would be positively correlated with the availability of DOC prior to rewetting (H2), given the close relationship between substrate availability and respiration rate (Iqbal et al 2010).
Methods
Field experiments
The precipitation manipulation experiment was established at Estación Experimental Forestal Horizontes in the Área de Conservación Guanacaste, Costa Rica (10.712 N, 85.551 W). In this region of Guanacaste, mean annual temperature is 25 °C and mean annual precipitation averages 1765 mm (based on climate data from nearby Parque Nacional Santa Rosa), with a 4–6 month dry season lasting from January until May. During the year of the study, however, a historic drought delayed the onset of rains until the end of August. All experiments were conducted in secondary TDFs recuperating from agricultural use.
The precipitation manipulation experiment was conducted in three treatment plots in each of four experimental blocks established in a ∼1 km2 area. Each 1 m2 plot contained two 10 cm diameter PVC collars for measuring soil respiration. To examine baseline patterns of soil respiration in each plot, CO2 fluxes were monitored monthly from July through November 2014 using a LI-8100A Automated Soil Gas Flux System (LI-COR, Lincoln, Nebraska).
The soil moisture manipulation experiment took place in January 2015, after the wet season rains had ceased and soils were almost completely dry (mean volumetric soil moisture <10%). Within each block, each of the three plots was randomly assigned to a treatment group: wetting, re-wetting, or control. In the wetting treatment, a single 50 mm rain event was simulated by applying 5 l of water with a handheld sprayer. (Henceforth, we refer to the application time of the simulated rainfall event as 'T0 h.') This treatment represents a substantial precipitation input ∼two standard deviations above the median rainfall event size (4.5 mm) in this forest. In the re-wetting treatment, two 50 mm rain events were simulated, 24 h preceding (T − 24 h) and at T0 h. Thus, re-wet plots received 100 mm of rain in total over a one-day period. Control plots received no precipitation inputs, and it did not rain over the course of the experiment.
Soil respiration fluxes were measured with the LI-8100A in each collar just before treatment were applied (T0 h), and both 10 min (T + 10 min) and 24 h (T + 24 h) afterwards. Volumetric soil moisture was measured with a handheld soil moisture probe a SM150 Soil Moisture Sensor (Delta-T Devices, Ltd, Cambridge, England) at T0 h, T10 min, and T24h. Volumetric soil moisture was converted to soil water potential based on calibration curves performed with a tensiometer (Spectrum Technologies, Aurora, IL). Finally, soils were sampled immediately adjacent to each collar at T0 h and T + 24 h for determination of microbial biomass C and N.
Biogeochemical methods
Soil texture in each block was quantified using the hydrometer method (Gee and Bauder 1979), and total organic C and N were analyzed on a Costech Elemental Analyzer. Microbial biomass C and N were determined by chloroform fumigation and direct extraction with 0.5 M K2SO4 (Vance et al 1987). C and N concentrations in extracts were determined on a Shimadzu TOC/TN at the University of Minnesota. In subsequent analyses, we assumed that K2SO4-extractable C and N in unfumigated soils captured most of the DOC and dissolved organic nitrogen (DON) pools (Jones and Willett 2006).
Statistics
We used repeated measures ANOVA to examine variation in soil CO2 flux among blocks over the course of a wet season (July–November 2014). We also used two-way rmANOVAs to examine patterns in soil respiration, microbial biomass C and N, and DOC and N as a function of random factors (block), fixed factors (precipitation treatment), and their interaction. All response variables were log or square-root transformed as appropriate to improve normality. To explore whether the magnitude of the rewetting pulse varied with substrate availability, we regressed the percentage increase in respiration (10 min after water addition) against size of the microbial biomass and the DOC pools.
Finally, to aid in interpretation of the data, we calculated treatment log response ratios for each plot as: ln(RespT−X min/RespT−0 min) where X represents respiration at 10 or 1440 min post-treatment, respectively. These LRRs were regressed against block-specific soil texture and total C and N concentrations to determine whether edaphic properties influenced the magnitude of respiratory responses.
Simulation models
To determine how well different model structures capture soil C dynamics in response to drying-rewetting events, we modified the conventional and enzyme-catalyzed soil C simulation models of Allison et al (2010) in the R programming environment (figure S1). The conventional model represents three carbon pools: polymeric soil organic carbon (SOC), DOC, and microbial biomass carbon (MIC). Each pool has a specific turnover rate, and CO2 is evolved every time carbon is transferred form one pool to another. Because the conventional model was not able to produce a rewetting CO2 pulse (see results), we also tested an altered version of the model ('modified conventional model') in which CO2 evolved only from the flux between the DOC pool and the microbial biomass, as in the enzyme-catalyzed model.
In contrast to the conventional model, the enzyme-catalyzed model incorporates a fourth pool representing soil enzymes (ENZs), and C transfer between the SOC and DOC pools (decomposition) is represented as a Michaelis–Menten function dependent on the size of SOC and ENZ. Similarly, microbial C uptake is also a Michaelis–Menten function scaled to the size of MIC and DOC. CO2 is evolved from the microbial biomass only.
To simulate the Birch effect, microbial C uptake (i.e. the flux from DOC to MIC) was modified with a soil water potential sensitivity function. The slope and intercept of the relationship between microbial activity (proportional respiration rate as a function of maximum) and soil water potential (ψ) were derived from a meta-analysis of microbial responses to water availability (Manzoni et al 2012). The same moisture sensitivity function was applied to the DOC uptake flux in both the conventional and enzyme-catalyzed models. For additional details on model structure and simulations, see supplemental information.
To test the effects of drying-rewetting cycles on soil C cycling, conventional and enzyme-catalyzed model simulations were run over 1000 100 hourly timesteps under the conditions listed in table S1. Briefly, we examined the effects of DOC pool size, the number of rewetting pulses, and the intensity of rewetting pulses (change in soil water potential, or ΔWP) on CO2 flux, while holding mean soil water potential constant across each comparison. Models were allowed to equilibrate over 1 000 000 timesteps, until all pools were stable, before beginning soil moisture simulations. When models did not equilibrate within 1 000 000 timesteps, turnover rates of each C pool were allowed to vary over two orders of magnitude until pool sizes stabilized at reasonable values. To examine the models' ability to reproduce observed patterns of rewetting response and calculate GCV scores (see below), we also performed simulations where we changed starting values for SOC, DOC, and MIC to match pool sizes (mg g−1) of total soil carbon, DOC, and MIC in each block. Soil moisture pulses (increase and return to baseline) were simulated within a period of 100 h. For each simulation, we recorded SOC, DOC, and MIC pool sizes at the final timestep.
To compare CO2 pulse magnitudes under different soil wetting regimes in both conventional and enzyme-catalyzed models, we integrated the area under the CO2 curve over the course of a wetting event with the flux package in R (Jurasinski et al 2014). For comparison with results from the field precipitation experiment, cumulative CO2 flux over the 24 h period for T0 h to T + 24 h was calculated in the same manner. For paired simulations in which soil moisture remained constant (i.e. there was no CO2 pulse), we calculated cumulative CO2 flux over these identical timesteps in order to compare model outputs on an equivalent basis.
To compare the ability of conventional and enzyme-catalyzed models to predict soil responses to wetting, we calculated generalized cross validation scores (GCVs) following Lawrence et al (2009):
where Yobs and Ymod are the observed and model responses respectively; n is the number of observations; and v1 is the number of model state variables calculated during each timestep. GCVs were calculated based on microbial biomass pools, DOC pools, and integrated respiration fluxes observed in each plot following (re)wetting treatments in the field experiment.
Results
Precipitation manipulation experiment
Soil properties varied among blocks, with clay concentrations ranging from 45.9% to 62.3% and total organic C from 3.5% to 4.2% in the top 10 cm. Under ambient conditions, soil respiration rates were dependent on the interaction between block and month (table 1): CO2 flux increased by 1.5–3-fold with the onset of the rainy season in two blocks, but did not respond or slightly decreased in the other two (figure S4).
Table 1. Repeated measures ANOVAs for baseline respiration rates (log-transformed). Significant F-values shown in bold.
| Df | F value | |
|---|---|---|
| Between subjects | ||
| Block | 3 | 3.85 |
| Temperature | 1 | 4.28 |
| Within subjects | ||
| Month | 3 | 19.93 |
| Block*month | 8 | 27.95 |
| Temperature | 1 | 0.37 |
In the rainfall manipulation experiment, simulation of a 50 mm rainfall event caused CO2 flux rates to increase about 250% within 10 min; after 24 h, respiration rates returned to pre-treatment values (figure 1(a)). Overall, respiration fluxes were two-fold higher in plots that received added water versus controls. Counter to H1, fluxes were 14% higher in the re-wetting versus wetting treatment (figure 1(b)), largely due to slightly higher baseline (T0 h) respiration rates in the re-wet plots. The magnitude of the rewetting pulse was dependent on the interaction between treatment and block (tables 2, S3(a)). The mean percent increase in CO2 flux 10 min after wet-up ranged from 115% to 329%, an almost three-fold difference. This variation was even more pronounced in the re-wetting treatment, where the percent increase in CO2 flux following the second wetting event ranged from 29% to 147%. Respiration rates only varied 32% across blocks in the control treatment.

Figure 1. (a) Soil respiration rates at three timepoints (T0 h, T10 min, and T24 h) in the control, wetting, and re-wetting treatments. (b) Mean CO2 flux across all timepoints in each treatment.
Download figure:
Standard image High-resolution imageTable 2. Repeated measures ANOVAs for CO2 flux, microbial biomass C and N, and dissolved organic C and N in the precipitation manipulation experiment. Significant F-values shown in bold.
| Respiration | MBC | MBN | DOC | DON | |
|---|---|---|---|---|---|
| Between subjects | |||||
| Treatment | 2.91 | 1.51 | 4.02 | 1.42 | 0.17 |
| Block | 4.75 | 8.31 | 2.44 | 10.42 | 13.33 |
| Treatment*block | 4.67 | 1.77 | 3.02 | 2.10 | 4.67 |
| Within subjects | |||||
| Time | 49.58 | 5.62 | 43.78 | 0.12 | 0.23 |
| Treatment*time | 23.04 | 3.54 | 14.33 | 11.24 | 12.03 |
| Block*time | 1.83 | 2.03 | 3.24 | 5.06 | 7.07 |
| Treatment*block | 2.74 | 0.81 | 3.39 | 2.93 | 5.74 |
| *Time | |||||
Soil C and N pools were also heterogeneous across the study area. DOC and microbial biomass C pools varied twofold among the four blocks, while DON and microbial biomass N pools varied depending on the interaction between treatment and block (tables 2, S3(b)). Dissolved organic and microbial C and N pools also changed over time. From T0 h to T + 24 h, DOC pools increased in the control treatment, but decreased ∼20% in the wetting and re-wetting treatments. Meanwhile, microbial biomass C increased between T0 h and T + 24 h across all treatment groups (table S3(b)). DON pools increased 42% in the control treatment, but remained unchanged in the wetting treatment and decreased 31% in the re-wetting treatment (figure 2(a)). The inverse pattern was observed for microbial biomass N: from T0 h to T + 24 h, MBN did not change in the control treatment, but increased 2.5-fold in the wetting treatment and 23% in the re-wetting treatment (figure 2(b)). The net effect of these changes was that the C:N ratio of microbial biomass in the wetting treatment decreased from 14.5 ± 1.7 at T0 h to 7.2 ± 0.6 at T + 24 h. Meanwhile, microbial biomass C:N in the control and re-wetting treatments remained fairly constant through time, at 15.2 ± 0.6 and 7.4 ± 0.5, respectively (figure 2(c)).
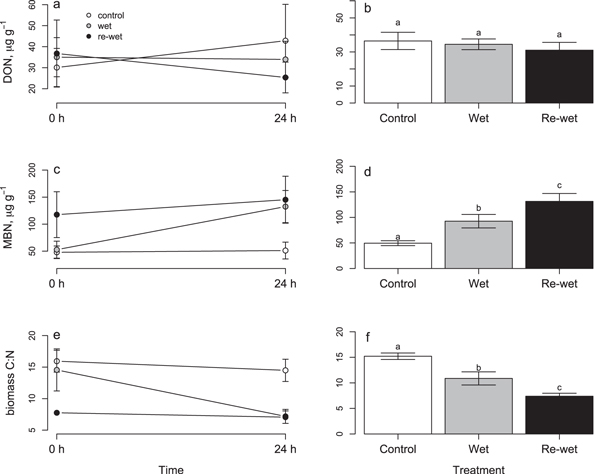
Figure 2. Dissolved organic nitrogen (a) and (b), microbial biomass nitrogen (c) and (d), and microbial biomass C:N (e) and (f) in the control, wetting, and re-wetting treatments. Panels (a), (c), and (e) show patterns over time, whereas panels (b), (d), and (f) show mean values across both timepoints.
Download figure:
Standard image High-resolution imageThe best predictor of the magnitude of the post-treatment (T + 10 min) CO2 flux (i.e., percentage increase over T0 h) was the size of the DOC pool (R2 = 0.175, P = 0.018, figure 3), confirming H2. Microbial biomass C, soil clay content, and total soil C were not related to the size of the post-wetting CO2 pulse.
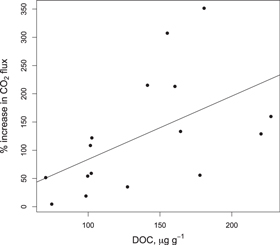
Figure 3. Percent increase in soil CO2 flux 10 min after rewetting (T + 10 min versus T0; h) in the wetting and re-wet treatments as a function of soil dissolved organic C pools at T0 h.
Download figure:
Standard image High-resolution imageModel simulations—enzyme-catalyzed model
In the enzyme-catalyzed model, CO2 flux rapidly increased and then returned to baseline after simulated rewetting, following the pattern observed in the field (figure 4). SOC pool size and cumulative CO2 flux were strongly dependent on mean soil water potential over the course of each simulation; therefore, mean soil water potential was held constant across all model comparisons (size and number of rewetting events). For a given set of starting parameters, CO2 pulse sizes were sensitive to the number of rewetting events, the size of the DOC pool, and the magnitude of the change in soil water potential (table S2). As the number of rewetting events increased, mean pulse size and cumulative CO2 flux decreased. Larger rewetting events (i.e. greater changes in soil water potential) and increases in DOC pool size led to larger wetting pulses and greater total emissions of CO2 (table S2).

Figure 4. CO2 flux in response to rapid change in soil water potential over a 24 h period in the enzyme-catalyzed (dashed line), conventional (dotted line), and modified conventional (dashed and dotted line) models. The solid black line shows the mean soil CO2 flux (converted to g C m2) observed in the wetting treatment in the field experiment.
Download figure:
Standard image High-resolution image
Model simulations—conventional model
The conventional model failed to reproduce the rewetting CO2 pulse; in fact, after a rapid increase in soil water potential, respiration rates actually decreased very slightly. This is because the microbial biomass increased upon rewetting, while the DOC pool was moderately reduced. Since the DOC pool has a faster turnover rate, the net result is a very small decrease in total CO2 flux following rewetting. If the turnover rate of the microbial biomass is increased to be equivalent or faster than DOC turnover (contrary to empirical evidence; Boddy et al 2007), the conventional model produced a sustained but very small increase in respiration that persisted 100 h (i.e. even after soil moisture returned to baseline), due to growth of the microbial biomass.
We also modified the conventional model such that CO2 was lost only from the microbial biomass pool, as in the enzyme-catalyzed model. In this case, the model was able to reproduce the rewetting CO2 pulse, although the magnitude of the pulse was generally much smaller (figure 4). In this model, SOC, DOC, and microbial biomass pool sizes increased continuously (figure S2) unless model parameters were modified dramatically. To allow pool sizes to equilibrate at realistic values, SOC turnover rates must be the same order of magnitude as DOC and microbial biomass turnover rates, or DOC turnover rates must be an order of magnitude slower than microbial biomass turnover. Relationships among pulse size, intensity, and frequency were the same as in the enzyme-catalyzed model (table S2).
Comparing model performance
The enzyme-catalyzed model predicted larger SOC, DOC and microbial biomass pools than the conventional model. When the conventional model was modified such that CO2 could evolve from the microbial biomass only, more C was retained in soil pools (figure S2) at the expense of CO2 fluxes. The unmodified conventional model was the best predictor of respiration fluxes, SOC, and DOC pools, while the modified conventional model best captured MIC (although this pool had not equilibrated by the end of the simulation) and the percent increase in respiration upon rewetting (table 3).
Table 3. Generalized cross-validation scores for the conventional three-pool model, the modified conventional model, and enzyme-catalyzed models. GCV scores were calculated with reference to microbial biomass carbon (MBC) pools, dissolved organic carbon (DOC) pools, total quantity of CO2 emitted following (re)wetting treatments, and the percentage increase in respiration (relative to pre-wetting baseline) in the four blocks of the field experiment. Lower GCV scores indicate better model performance; italicized scores indicate the best-performing model.
| Variable modeled | Conventional model | Modified conventional model | Enzyme-catalyzed model |
|---|---|---|---|
| SOC | 371 | 760 598 | 1331 |
| DOC | 0.29 | 19.02 | 4.04 |
| Microbial biomass | 33 | 28 | 54 |
| Respiration flux | 0.80 | 0.85 | 2.27 |
| Percent increase in respiration upon wetting | 786 650 | 233 321 | 177 0234 |
All three models predicted decreases in DOC and increases in the microbial biomass following a soil moisture pulse (figure S3). The modified conventional and enzyme models predicted very similar respiration dynamics following rewetting, although the percentage increase in respiration was greater in the enzyme model (figures 4, S3).
Discussion
Precipitation manipulation experiment
We found that soil CO2 fluxes are linked to seasonal and short-term variation in water availability, as expected (Birch 1958, Cook and Orchard 2008, Moyano et al 2012). In our field manipulation, rewetting of dry soils produced an immediate pulse of CO2, accompanied by rapid immobilization of N into the microbial biomass. Strong CO2 pulses were also observed in previously moistened soil, suggesting that observed respiratory responses were biological in origin, and did not simply represent flushing of pent-up CO2 out of soil pore space. Instead, CO2 pulses likely represent rapid microbial metabolism of organic substrate that was previously unavailable due to occlusion in soil aggregates or limitations on diffusion (Manzoni et al 2014). Although the size of the microbial biomass did not dramatically increase 24 h after wetting, biomass C:N declined significantly. This suggests that soil microbial communities may have been 'mining' newly available dissolved organic matter for N. Alternatively, changes in biomass stoichiometry may be related to rapid release of C-rich osmolytes (especially fungal polyols) upon rewetting (Schimel et al 2007), although recent evidence suggests that osmolyte accumulation is not a major strategy of microbial drought resistance (Kakumanu et al 2013).
Surprisingly, the magnitude of CO2 rewetting pulses varied considerably over relatively fine spatial scales: in the 24 h following a single wetting event, the estimated amount of C emitted ranged from 14.8 to 23.2 g C m−2 across blocks. These findings parallel marked spatial variation in seasonal patterns of CO2 flux. Whereas respiration rates increased markedly after the onset of the rainy season in some blocks, CO2 fluxes did not change in others. These patterns were unrelated to differences in soil texture and total soil C among blocks. Instead, the sizes of rewetting CO2 pulses were most closely related to availability of K2SO4-extractable DOC prior to the wetting event. This result is consistent with other studies which find that greater availability of labile organic C promotes larger rewetting pulses (Jenerette and Chatterjee 2012, Harrison-Kirk et al 2014), and parallels other studies in TDF showing that microbial N utilization is strongly dependent on DOC availability (Montaño et al 2007). Thus, rewetting responses are apparently tied to substrate limitation of the microbial biomass. Of course, this variation in soil DOC content may interact with differences in microbial community composition among blocks (Evans and Wallenstein 2012), which was not quantified in this study.
Simulation models
Soil carbon models were only able to capture the Birch effect when respiration fluxes were coupled directly to microbial DOC uptake. Because CO2 was lost from multiple pools in the unmodified conventional model, the respiratory response to water availability was effectively 'smoothed' by concurrent changes in the size of SOC, DOC and microbial biomass pools. However, this model most accurately predicted sizes of soil C pools over the course of the simulation, despite its inability to reproduce the Birch effect. In general, the enzyme-catalyzed model performed most poorly; although final pool sizes predicted by the enzyme and modified conventional models were similar, the enzyme model was penalized for having extra parameters.
Although the enzyme-catalyzed and modified conventional models both reproduced the Birch effect, this came at a cost in the traditional three-pool model: SOC, DOC, and microbial biomass C pools never equilibrated, increasing continuously over 100 0100 timesteps. The model only yielded realistic pool sizes when the relative turnover rates of the three main C pools were manipulated. Increasing SOC turnover rates at least two orders of magnitude allowed the model to equilibrate. However, allowing SOC to turn over as fast as the microbial biomass is inconsistent with core model assumptions: the SOC, DOC, and microbial biomass pools are intended to be analogous to the 'passive,' 'slow' and 'fast' pools, which are utilized in many first-order soil carbon models (Bolker et al 1998, Allison et al 2010). Similarly, decreasing DOC turnover rates at least two orders of magnitude allowed pool sizes to equilibrate at reasonable values. However, this invokes the assumption that the soil microbial biomass turns over an order of magnitude faster than their substrate pool, which is highly biologically unrealistic, and inconsistent with empirical evidence (Boddy et al 2007). Although we did not explore all parameter space, it appears that loss of CO2 directly from the SOC and DOC pools in the unmodified model is a stabilizing mechanism that prevents rapid C accumulation when SOC turnover rates are lower than those of the microbial biomass. By contrast, in the enzyme-catalyzed version, the model is stabilized by the nonlinear kinetics of SOC decomposition and DOC uptake. Therefore, only the enzyme-catalyzed model is able to simulate the Birch effect when SOC, DOC, and microbial biomass C pools have realistic relative turnover rates.
Our findings are similar to the conclusions of Lawrence et al (2009), who demonstrated that enzyme-catalyzed models with 'reverse' Michaelis–Menten were better able to predict rewetting responses than traditional first-order models, whereas the conventional model performed better at constant soil moisture. In our case, the least mechanistic model most accurately predicted equilibrium pool sizes. However, it lacked the direct coupling of C uptake and moisture sensitivity that enabled the other two models to simulate the Birch effect.
Implications for ecosystem C balance in TDFs under global change
The quantity and seasonality of precipitation are already changing over many areas of the dry tropics (Feng et al 2013), highlighting the importance of a mechanistic framework to predict soil responses to changes in rainfall regime. Model simulations can generate testable hypotheses about the relationships among soil water potential, the frequency of rewetting events, and soil respiration. In both the enzyme-catalyzed and modified conventional models, with all other factors held constant, greater changes in soil water potential (ΔWP) led to larger CO2 pulses and greater total losses of CO2, as has been found in empirical studies (Lado-Monserrat et al 2014). This suggests that more severe droughts resulting in very dry soils could lead to net ecosystem C losses via intensification of the Birch effect. The models also predict that an increased number of wetting events attenuates the size of each CO2 pulse. For this reason, the timing of precipitation may affect belowground C storage even if the total quantity of rainfall remains the same: CO2 losses are greater under larger but more sporadic precipitation events versus smaller but more frequent ones. However, our models do not include longer-term feedbacks between soil nutrient cycles and plant growth. If trees also respond to major rewetting events by altering belowground allocation (Doughty et al 2014), the relative sizes of DOC and microbial biomass pools may change.
Conclusions
Our experimental findings and model simulations serve to highlight the complexity of controls on belowground carbon cycling in TDF. Ultimately, changes in the amount and timing of rainfall events impact soil respiration via their effects on the availability of substrate for microbial growth. However, soil C pools are highly variable in space and time in these dry forests. In order to predict ecosystem-scale responses to climate change, more experiments are needed to explore relationships among microbial physiology, DOC availability, and belowground C inputs.
Acknowledgments
We gratefully acknowledge financial support from the United States National Science Foundation (CAREER grant DEB 1053237 to JSP) and the US Department of Energy, Office of Science, Office of Biological and Environmental Research, Terrestrial Ecosystem Science (TES) Program (award number DE-SC0014363), excellent help in the field from Daniel Peréz, Erik Schilling, and Sebastian Zarges, and logistical support from Roger Blanco, Milena Gutiérrez, and Maria Marta Chavarría and the Área de Conservación Guanacaste.