

Abstract
Background. There has been sustained and growing interest in characterizing the net energy impact of information and communication technology (ICT), which results from indirect effects offsetting (or amplifying) the energy directly consumed by ICT equipment. These indirect effects may be either positive or negative, and there is considerable disagreement as to the direction of this sign as well as the effect magnitude. Literature in this area ranges from studies focused on a single service (such as e-commerce versus traditional retail) to macroeconomic studies attempting to characterize the overall impact of ICT. Methods. We review the literature on the indirect energy effect of ICT found via Google Scholar, our own research, and input from other researchers in the field. The various studies are linked to an effect taxonomy, which is synthesized from several different hierarchies present in the literature. References are further grouped according to ICT service (e.g., e-commerce, telework) and summarized by scope, method, and quantitative and qualitative findings. Review results. Uncertainty persists in understanding the net energy effects of ICT. Results of indirect energy effect studies are highly sensitive to scoping decisions and assumptions made by the analyst. Uncertainty increases as the impact scope broadens, due to complex and interconnected effects. However, there is general agreement that ICT has large energy savings potential, but that the realization of this potential is highly dependent on deployment details and user behavior. Discussion. While the overall net effect of ICT is likely to remain unknown, this review suggests several guidelines for improving research quality in this area, including increased data collection, enhancing traditional modeling studies with sensitivity analysis, greater care in scoping, less confidence in characterizing aggregate impacts, more effort on understanding user behavior, and more contextual integration across the different levels of the effect taxonomy.
Export citation and abstract BibTeX RIS

Original content from this work may be used under the terms of the Creative Commons Attribution 3.0 licence. Any further distribution of this work must maintain attribution to the author(s) and the title of the work, journal citation and DOI.
1. Background
The rapid growth and adoption of information and communication technology (ICT) such as computers, mobile devices, sensors, and networks can profoundly affect how—and how much—energy is used by society. On the one hand, ICT itself consumes energy, which is a direct energy effect. On the other hand, ICT enables us to make existing products and services more efficient as well as create 'e-substitutes' for physical products, which are indirect energy effects. Other, higher-order indirect energy effects occur when the introduction of ICT causes a change in consumption or production elsewhere in the economy.
The 'digital revolution' has coincided with an increasing focus on environmental sustainability, and potential synergies between ICT deployment and efforts to mitigate environmental and climate impacts are popular topics of discussion among researchers, policymakers, and industry stakeholders. These synergies might be either positive or negative—ICT indirect effects could either offset or amplify direct energy effects—and characterizing this overall balance has been of great interest, as evidenced by the emergence of an ICT for Sustainability research community (Hilty and Aebischer 2015), two special issues in the Journal of Industrial Ecology (Rejeski 2002, Masanet and Matthews 2010) and one in Resources, Conservation, and Recycling (Koomey 2002), an OECD effort to link statistical indicators between the ICT and environment research fields (Roberts 2009), increasing work in 'green computing' from the computer science literature (e.g., Auweter et al 2012), and a variety of other reports (e.g., Erdmann et al 2004, Jørgensen et al 2006). Motivations behind ICT energy research are diverse: some seek a new carbon-abatement lever in the face of dire climate projections, while others hope to highlight the benefits of an industry often in the spotlight for its energy consumption.
There is, in fact, abundant cheerleading for ICT's ability to aid the cause of energy efficiency, even as there are rumblings about potential false promise, with the general media frequently publishing articles reflecting either one or the other viewpoint. Indeed, uncertainty regarding the magnitude and even the sign of ICT energy effects persists. Generally in the positive synergy camp are Romm et al (1999), the American Council for an Energy-Efficient Economy (e.g., Elliott et al 2012, Laitner and Ehrhardt-Martinez 2008) and the Center for Climate and Energy Solutions (e.g., Seidel and Ye 2012), who anticipate ICT-enabled energy efficiency gains across broad sectors of the economy. The 'SMARTer 2030' report (Accenture 2015) estimates a greenhouse gas (GHG) abatement potential of 20% by 2030 due to ICT deployment3 . More cautionary is Rattle (2010), who, in chapters 5 and 6 of Computing Our Way to Paradise?, argues that higher-order effects are likely to swamp these sorts of energy savings projections.
In contrast, Berkhout and Hertin (2004) argue for moving 'beyond the dichotomy between pessimism and optimism' to recognize that the relationship between ICT and energy impacts is 'complex, interdependent, deeply uncertain and scale-dependent.' Other literature reviews point to an ambiguous net impact or acknowledge that this complexity and uncertainty confound attempts to verify a general belief that the net energy savings of ICT will be positive (Yi and Thomas 2007, Erdmann and Hilty 2010, Koomey et al 2013, Börjesson Rivera et al 2014).
Our paper builds on this previous work. First, we answer the call made by Börjesson Rivera et al (2014) for standardization in the terms used across the literature by synthesizing the various published categorizations of ICT impacts into a common taxonomy (section 2). Second, we review studies of individual ICT services—which constitute the bulk of the literature—providing a quantitative snapshot of the range of anticipated energy effects (section 3). Next, we discuss higher-order energy impacts of ICT deployment, an area with much less solid quantitative treatment in the literature (section 4). We conclude by summarizing the literature and highlighting directions for further research.
2. Taxonomy of ICT energy effects
Direct energy consumption refers to energy used during the operation, manufacture, and disposal of ICT equipment. While this definition reflects common usage in the ICT energy literature, we note that it may contrast usage elsewhere—for instance, in economic input-output analysis—where direct energy use may be synonymous with operational energy consumption, and manufacturing and disposal energy are sometimes described as indirect effects (Green and Mathur 2008). Figure 1 shows past estimates and forecasts of ICT operational4 energy consumption. The variation results from differing scopes (i.e., the equipment types included) and assumptions about equipment penetration, usage, and growth. For context, worldwide ICT direct operational electricity consumption has been estimated to be 655-710 TWh for 2007 and 905 TWh for 2012 (Malmodin et al 2010, Van Heddeghem et al 2014). These site electricity estimates are generally on the order of 3%–5% of total electricity consumption for their respective scopes.

Figure 1. Estimates of use-phase ICT electricity consumption in the United States. Markers and solid lines represent historical estimates; dashed lines represent projections. Note different axis scales. The type of included ICT equipment varies significantly among the different studies. (Note. AEO includes the EIA PC office equipment and non-PC office equipment categories, the latter including servers, copiers, fax machines, typewriters, cash registers, and other miscellaneous office equipment. Norford et al (1990) include PCs and their associated peripherals, including printers. Koomey et al (1996) include minicomputers, mainframes, point-of-sale terminals, fax machines, copiers, printers, monitors, and PCs. Kawamoto et al (2002) include portable computers, desktops, servers, displays, minicomputers, mainframes, terminals, laser and inkjet printers, copiers, and faxes. Roth et al (2002) includes PCs, servers, displays, copiers and printers, power supplies, and some computer and telephone networking equipment. Nordman and Meier (2003) include desktop and laptop PCs, printers, copiers, and fax machines. Roth et al (2006) include PCs and peripherals (monitors, printers, and power supplies), multi-function devices, home networking equipment, set-top boxes, and broadband access devices. Baer et al (2002) takes the broadest view of ICT equipment, including TV and audio equipment in addition to office, networking, and communications equipment in the residential sector, and data centers in addition to office and networking equipment in the commercial sector.)
Download figure:
Standard image High-resolution imageIn addition to the broad sector estimates in figure 1, one subset of ICT operational energy use that has received careful study is energy consumption in data centers. After nearly doubling between 2000 and 2005, consumption growth is now nearly flat, having grown only 4% from 2010 to 2014 (Koomey 2008, 2011, Shehabi et al 2016). This reduction is driven by virtualization and consolidation of data center processing in 'cloud' facilities and by increasing focus on energy-efficient data center IT infrastructure.
Energy consumption during other parts of the ICT equipment lifecycle—i.e., manufacture and disposal—is often called embodied energy and can be a nontrivial component of ICT equipment's direct energy use. The relative significance of embodied energy to operational energy varies by component and by scope of analysis. Williams (2011) observes that manufacturing energy accounts for well over half of the lifetime energy consumption for laptop computers and memory chips but less than 20% for logic chips5 . At the data center level, Masanet et al (2013) estimate that operational energy dwarfs embodied energy6 . The difference between laptop computers and data centers stems from the higher utilization rate of servers; to a lesser extent, the additional energy consumption of cooling needed in data center facilities also has an impact. At an even broader level, Raghavan and Ma (2011) estimate that the embodied energy of the entire Internet infrastructure is roughly equivalent to its operational energy consumption over its lifetime, which is partly due to the fact that network cabling has high embodied energy but no operational energy use.
However, direct energy use is likely the simplest and least important ICT energy effect (Allenby and Unger 2001). The indirect energy effects are likely to be of much greater magnitude (Koomey et al 2013), owing to the breadth of the various mechanisms by which ICT services alter energy use. Furthermore, the electrical efficiency of computing has consistently doubled every 1.5 years (Koomey et al 2011), meaning that each kWh of direct energy use has the potential for ever-larger associated indirect effects. Table 1 breaks out individual effects, organizes them into a taxonomy of increasing scope (see also Azevedo 2014), and maps them to other terms used in the literature, while figure 2 shows this taxonomy graphically.
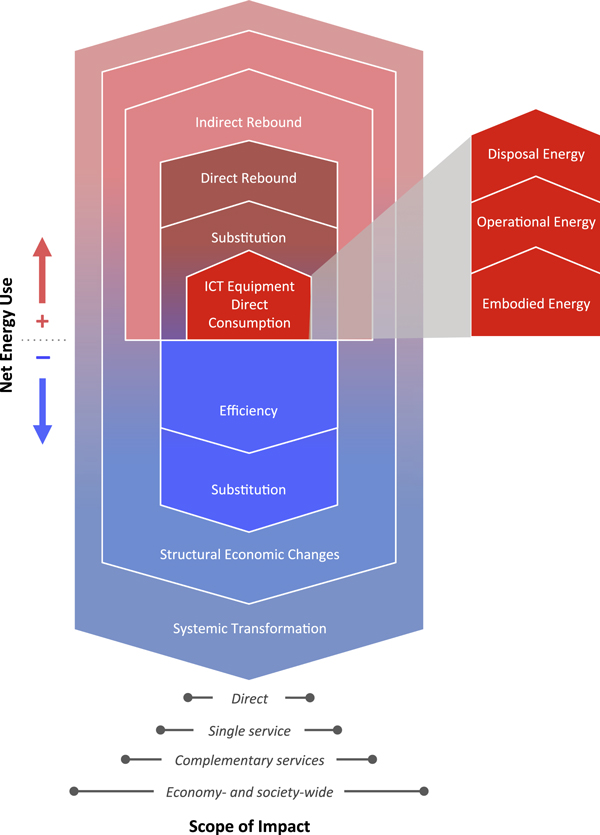
Figure 2. Taxonomy of ICT energy effects. Red effects increase energy use, blue effects decrease energy use, and shading intensity decreases as effect scope increases. (Effect magnitudes are only illustrative and not to scale.)
Download figure:
Standard image High-resolution imageTable 1. Taxonomy of ICT energy effects. Scope of effect increases from top to bottom. The third column provides an example of each effect type related to the deployment of Global Positioning System (GPS) technologya.
 |
aAlternate taxonomies are from Hilty et al (2006), Berkhout and Hertin (2004), Williams (2011), and Rattle (2010).
First, ICT adoption leads to efficiency in and substitution for conventional products and services. Efficiency improvement occurs when, for example, smart building technology reduces air conditioning energy consumption by tailoring climate-control to the real-time needs of building occupants. An example of substitution is the replacement of air travel with teleconferencing. There is no guarantee, however, that the substituted ICT service will be less energy intensive than the conventional service it replaces, and even evaluation of simple cases is not always straightforward. An electronic billboard, for instance, may use more energy than a static, printed billboard, since it uses electricity to display the image (Young 2013). This energy consumption can be compared to the energy required to print the same image. However, the electronic version also avoids energy associated with changing the billboard—i.e., sending a worker out to make the switch. An additional complication is that the services are not strict functional equivalents: the electronic version allows animated displays, which may lead to higher success rates and profits—perhaps making energy consumption per successful 'target' lower even as per-billboard consumption is higher.
Any energy reduction achieved through efficiency or substitution can be plagued by rebound effects, in which expected gains are offset by induced additional consumption. Borenstein (2013), Azevedo (2014), and Gillingham et al (2015) provide comprehensive introductions to rebound effect types. Rebound is typically broken into direct rebound, indirect rebound, and economy-wide effects. Direct rebound effects are energy service own-price-elasticity effects: as prices fall (due to improvements in efficiency or productivity), substitution and income effects increase consumption. For an ICT example, if an e-book is less costly than a conventional book, then consumers might purchase more books. Direct rebound is constrained by saturation: there is a limit to the number of books people will buy, no matter how cheap they become. Alternatively, these savings could be spent on other goods and services, which are indirect rebound effects. Indirect rebound effects result from cross-price elasticity of demand for other products and services due to increased real consumer income7 .
Economy-wide effects occur when the ICT introduction causes macroeconomic adjustments across economic sectors. That is, the ICT industry can promote or inhibit growth in other sectors of the economy, inducing structural changes that have energy use implications of their own. For example, e-commerce is having broad effects on the logistics industry (Hesse 2002), including growth in urban freight vehicle sales and changing patterns in distribution center floor space (Harrington 2015), increased trucking and adoption of new pricing strategies by freight carriers (Shorr Packaging Corp 2015), and use of more specialized packaging and a broader range of box sizes (Mohan et al 2014).
Finally, transformational effects refer to the altering of human preferences and economic and social institutions caused in part by the development of ICT (Greening et al 2000, Plepys 2002). Historical examples include the advent of the telephone and automobile, which heavily altered where and how people lived and worked. We might conceive of a similar transformation (one of many possible ICT-enhanced futures) in which the fundamental constraints on where people live and work continue to loosen: e-commerce and home delivery make proximity to traditional retail outlets less important, seamless telework results in less commuting, and driverless vehicles allow for more productive use of the commuting time.
As noted by Börjesson Rivera et al (2014), the existing literature uses several different sets of terms for this hierarchy of effects. The right half of table 1 maps the most commonly used categorizations to the taxonomy used in this paper.
ICT energy effects can be broadly grouped into first-order impacts due to direct consumption, second-order effects resulting from process changes, such as efficiency, and third-order effects due behavioral and economic changes (Berkhout and Hertin 2004, Hilty et al 2006). Williams (2011) adds a fourth level, essentially breaking third-order effects into rebound effects and broader systemic change.
Rattle (2010) categorizes indirect effects into five categories: optimization, substitution, induction, supplementation, and creation. The first two map directly to efficiency and substitution, while induction, supplementation, and creation align loosely with (or, perhaps more strictly, are special cases of) direct, indirect, and economy-wide rebound effects, respectively.
3. Indirect single-service effects
Though it is important to take a systemic, holistic view of ICT energy consumption (Allenby and Unger 2001), tractability concerns dictate that researchers attempting detailed quantitative estimates of energy impacts look at specific applications separately. These granular studies, which often use a life-cycle assessment (LCA) approach, can identify the key factors driving energy use and highlight opportunities for reduction in individual processes. However, they do so at the expense of scope, typically addressing only substitution and efficiency effects. Bull and Kozak (2014) discuss the challenges of LCA specific to the ICT domain. For a sample evaluation of ICT-related LCA studies, see Schmidt and Pizzol (2014).
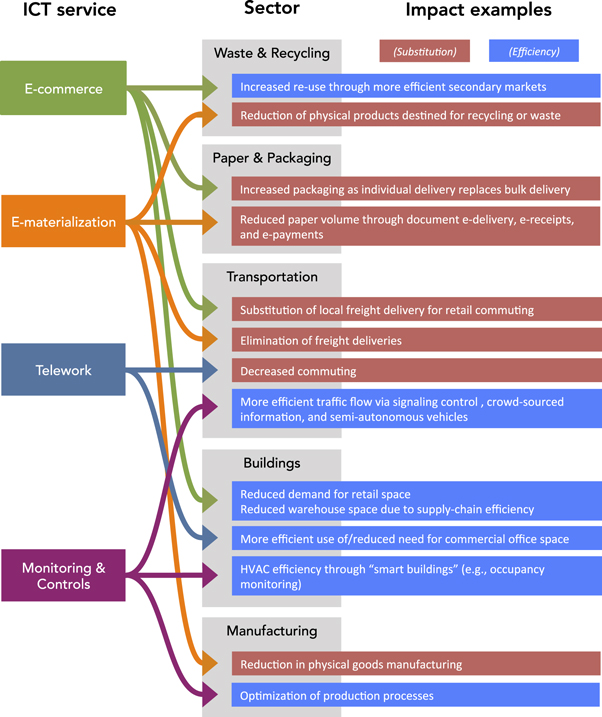
In this section, we review literature estimating energy consumption impacts attributable to the introduction of four ICT services—e-commerce, e-materialization, telework, and monitoring and controls—across the building, transport, manufacturing, packaging, and waste sectors. (See figure 3.) These four services were selected due to their broad impacts and coverage in the literature, but there are other energy-relevant ICT services, such as computer-aided design, which has expanded beyond drafting software to cover process planning, engineering, and quality control (European Commission Directorate-General for the Information Society and Media 2009). Furthermore, increased computing power has enabled system designers to solve more complex problems using optimization, modeling, and simulation techniques and thus more comprehensively cover the 'solution space,' yielding products with greater function, lower cost, less embodied energy, and increased use-phase efficiency (European Commission Directorate-General for the Information Society and Media 2009).
Figure 3. Relationships among ICT service types, economic sectors, and impacts.
Download figure:
Standard image High-resolution image
The aerospace industry provides a particularly clear example of the evolution of engineering design from manual methods to reliance on computational modeling and simulation. ICT has transformed all levels of aircraft design. First, the ability to solve complex design optimization problems supports development and use of new materials as well as enhanced design of aircraft components, such as airplane wings (Obayashi 1998, Keane and Nair 2005). In particular, multidisciplinary design optimization allows joint consideration of structures and aerodynamics in the design process (Sobieszczanski-Sobieski and Haftka 1997, Kennedy et al 2014). These efforts lead to both reduced material use in production as well as increased efficiency in flight. Second, ICT has made integration throughout the systems engineering process more efficient (Hobday et al 2005). Commoditization and outsourcing of components can increase the energy efficiency of production, although potential increases in the transport involved in a global supply chain may increase energy use (Siikavirta et al 2002). Finally, ICT has replaced wind-tunnel testing and even some flight testing, decreasing the manufacturing and embodied energy of physical prototypes and reducing fuel use (Airbus 2016).
Similar effects could doubtless be found in other manufacturing or material-intensive industries, including consumer goods, automobiles, and construction (Basbagill et al 2013, European Commission Directorate-General for the Information Society and Media 2009).
3.1. E-commerce
E-commerce, the buying and selling of goods and services using electronic networks, includes familiar business-to-customer (B2C) Internet outlets like eBay and Amazon, but it also includes back-end business-to-business (B2B) functions such as services that enable just-in-time inventory management. Though focused on GHG emissions, table 1 in Siikavirta et al (2002) outlines different means by which e-commerce affects energy consumption throughout the supply chain.
A review of e-commerce studies, summarized in table 2, shows mixed results. On balance, most studies find a positive potential energy savings, though this conclusion is not universal, and results are highly sensitive to assumptions (Hesse 2002). The series of studies examining book retail is instructive on this point, since these analyses were completed by the same research community8 using similar methods with similar (though not identical) system boundaries.
Table 2. Summary of e-commerce studies. Net savings is energy savings of the ICT service vs. the conventional baseline. Where point estimates rather than ranges are provided, the value is placed in the High column, though it may be an average. Qualitative conclusion is an assessment of where the bulk of the evidence in the study falls ▴/▾ indicate positive and negative ICT energy savings, respectively; ◊/▾ represents a balanced finding (i.e., savings offset or are balanced between positive and negative results depending on parameters). Assignment of these icons is based on the original authors' results discussion in each paper, augmented by our interpretation. Method abbreviations are: LCA = Life Cycle Assessment, EIO = Economic Input-Output, MC = Monte Carlo, SD = System Dynamics.
| Study | Service | Region | Effects | Sectors | Metrics | Net Savings | Method | |||||||||||||
|---|---|---|---|---|---|---|---|---|---|---|---|---|---|---|---|---|---|---|---|---|
| Direct | Efficiency | Substitution | Direct rebound | Indirect rebound | Economy-wide rebound | Transformation | Transport | Buildings | Manufacturing | Packaging | Waste | Air emissions | Energy | Low | High | Qualitative conclusion | ||||
| Siikavirta et al (2002) | Food retail | Finland | ■ | ■ | ■ | 18% | 87% | ▴ | Simulation | |||||||||||
| Romm et al (1999) | Book retail | US | ■ | ■ | ■ | ■ | 93% | ▴ | Calculation | |||||||||||
| Matthews et al (2001a) | Book retail | US | ■ | ■ | ■ | ■ | ■ | ■ | 16% | ▴ | LCA (EIO) | |||||||||
| Matthews et al (2001b) | Book retail | US | ■ | ■ | ■ | ■ | ■ | ■ | −7% | 9% | ◊ | LCA (EIO) | ||||||||
| Scott Matthews et al (2002) | Book retail | US | ■ | ■ | ■ | ■ | ■ | −32% | 18% | ◊ | LCA (EIO) | |||||||||
| Matthews et al (2002) | Book retail | Japan | ■ | ■ | ■ | ■ | ■ | ■ | −500% | 28% | ◊ | LCA (Process) | ||||||||
| Williams and Tagami (2002) | Book retail | Japan | ■ | ■ | ■ | ■ | ■ | ■ | −51% | 44%a | ▾ | LCA (Process) | ||||||||
| Kim et al (2008) | Book retail | US | ■ | ■ | ■ | ■ | 51% | ▴ | Simulation | |||||||||||
| Sivaraman et al (2007) | DVD rental | US | ■ | ■ | ■ | ■ | ■ | ■ | ■ | ■ | 23% | 50% | ▴ | LCA (Hybrid) | ||||||
| Shehabi et al (2014) | DVD rental | US | ■ | ■ | ■ | ■ | ■ | ■ | ■ | ■ | 35% | ▴ | LCA (Hybrid) | |||||||
| Weber et al (2010) | Music retail | US | ■ | ■ | ■ | ■ | ■ | ■ | ■ | ■ | −97%b | 71% | ◊ | LCA (Process) w/ MC | ||||||
| Erdmann et al (2004) | "Tele-shopping" | EU-15 | ■ | ■ | ■ | ■ | ■ | ■ | ■ | ■ | ■ | ■ | 1% | ◊ | Simulation w/ SD | |||||
| Weber et al (2008) | Consumer retail | US | ■ | ■ | ■ | ■ | ■ | ■ | ■ |
 c
c
|
36% | ▴ | LCA (Process) w/ MC | |||||||
| Edwards et al (2010) | Consumer retail | UK | ■ | ■ | ■ | n/ab | ▴ | Simulation | ||||||||||||
aDerived from seeking the minimum value for e-retail. Main scenario results were all negative. bThis study does not report the scenario differences from the Monte Carlo runs, so the bounds shown here are the maximum possible positive and negative savings based on the confidence intervals reported in the study. It is likely, however, that there is correlation among the scenarios and the range is not this large. Median savings estimates are reported as 20%-30%. cThe study does not report results in enough detail to determine the full range of values, but cites a 20% probability that the traditional channel has lower energy use than the e-commerce channel. dLast mile transport only, so results not comparable to other studies in this table. Generally, e-commerce had much lower per-item energy use in this study.
In the transport sector, a switch from brick-and-mortar retail to electronic retail changes how products are delivered to the consumer, with personal travel and bulk freight delivery to stores replaced by home delivery. E-commerce may make 'last mile' transport more efficient due to optimization of shipping routes by delivery companies, but it can increase energy use by substituting air for ground freight. It also lowers package density, since traditional stores receive multiple items in each box, while home delivery entails fewer items per box, leading to higher embodied packaging energy (Williams and Tagami 2002). Additionally, the long reach of e-commerce gives retailers the capacity to serve geographically larger markets, which could increase cost efficiency at the expense of energy efficiency. Most e-commerce studies focus on these transport and packaging effects. Among those in table 2, key sensitivities driving results are population density (related to last-mile delivery), freight mode, product return rate, trip allocation (proportion of multipurpose trips), and packaging type.
As an example of how system assumptions affect results, we highlight the negative 500% net savings (that is, a 5x increase in energy consumption) from Matthews et al (2002). The primary driver of results in this study is transport distance, which is a function of population density. This particular estimate reflects the high-density Tokyo scenario, in which customers live within half a kilometer of a bookstore and are thus likely to walk or ride a bicycle when shopping. In the e-commerce case, courier trucks are used for delivery. As a result, e-commerce requires ten times as much total transport energy compared to traditional retail. The Tokyo result is, of course, an outlier when compared to the U.S. scenarios and the other Japan scenarios in the same paper. However, it represents a valid model of the system and is thus a particularly clear—if extreme—example of how results are driven by the assumed characteristics of the system.
In the buildings sector, Romm et al (1999) estimate a potential for 53 billion kWh in operational and construction energy reductions in retail, warehouse, and office space due to B2C e-commerce from 1997 to 2007. Mechanisms for achieving this reduction primarily include shrinkage, consolidation, or replacement of brick-and-mortar retail outlets but also, e.g., more efficient use of hotel rooms through Internet bookings and auctions. In the B2B segment, they estimate supply-chain efficiency will reduce inventories by 25%–35%, leading to elimination of 1 billion square feet of warehouse space from 1995 levels. Matthews and Hendrickson (2002) find a net reduction in logistics energy use through the centralization of inventory, much of which is likely enabled by ICT.
Through greater coupling between consumers and producers, e-commerce may reduce overproduction. E-commerce also leads to more efficient secondary markets. Through sites like eBay, Craigslist, and Freecycle, goods that were either destined for the landfill or sitting unused in storage are put to use, eliminating waste, avoiding some manufacturing, and reducing storage requirements. At the same time, these secondary markets can induce energy consumption, specifically in transport (Rattle 2010, p 71).
3.2. E-materialization
In addition to altering delivery channels for physical products, Internet-based retail allows for the substitution of some products with electronic equivalents, i.e., e-materialization, virtualization, or digitization. Consumer examples include electronic versus print newspapers, e-books versus bound books, and streaming audio and video versus physical media such as CDs and DVDs. In business operations, e-materialization can lead to reduction in paper communications and records. The theoretical energy impacts of e-materialization across the transport, manufacturing, packaging, and waste sectors are straightforward: elimination of physical products eliminates the need to manufacture, package, transport, and dispose of those products. Offsetting these gains is the direct energy consumption of the ICT used to deliver the virtual substitutes.
Results from e-materialization studies are summarized in table 3. Online media streaming (versus shipping CDs/DVDs by mail) is a popular e-materialization use case, and comparison of results for this service highlights the variability common to LCA studies, even when the dynamics of the service are well known and fairly straightforward. Additionally, Bull and Kozak (2014) argue that the inherent complexity and interconnectedness of ICT systems weaken LCA's ability to provide meaningful comparative results.
Table 3. Summary of e-materialization studies. See table 2 caption for explanation of symbols and abbreviations.
| Study | Service | Region | Effects | Sectors | Metrics | Net Savings | Method | |||||||||||||
|---|---|---|---|---|---|---|---|---|---|---|---|---|---|---|---|---|---|---|---|---|
| Direct | Efficiency | Substitution | Direct rebound | Indirect rebound | Economy-wide rebound | Transformation | Transport | Buildings | Manufacturing | Packaging | Waste | Air emissions | Energy | Low | High | Qualitative conclusion | ||||
| Seetharam et al (2010) | Video delivery | US | ■ | ■ | ■ | ■ | ■ | ■ | ■ | ■ | ■ | ■ | 21% | 70% | ▴ | LCA (Process) | ||||
| Shehabi et al (2014) | Video delivery | US | ■ | ■ | ■ | ■ | ■ | ■ | ■ | ■ | ■ | −1% | ◊ | LCA (Process) | ||||||
| Weber et al (2010) | Music delivery | US | ■ | ■ | ■ | ■ | ■ | ■ | ■ | ■ | ■ | −30% | 90% | ▴ | LCA (Process) w/ MC | |||||
| Mayers et al (2014) | Game delivery | UK | ■ | ■ | ■ | ■ | ■ | ■ | ■ | ■ | −32% | −5% | ▾ | LCA (Process) | ||||||
| Moberg et al (2010) | News media | EU | ■ | ■ | ■ | ■ | ■ | ■ | ■ | ■ | ■ | 60% | ▴ | LCA (Process) | ||||||
| Erdmann et al (2004) | Virtual goods | EU-15 | ■ | ■ | ■ | ■ | ■ | ■ | ■ | ■ | ■ | ■ | ■ | 0% | 11% | ▴ | Scenarios w/ SD | |||
| Gard and Keoleian (2002) | Library journals | US | ■ | ■ | ■ | ■ | ■ | ■ | ■ | ■ | −643% | 69% | ◊ | LCA (Process) | ||||||
| Zurkirch and Reichart (2000) | Mail delivery | Switzer-land | ■ | ■ | ■ | ■ | ■ | ■ | ■ | ■ | *a | * | −80% | 0% | ▾ | LCA (Process) | ||||
| Zurkirch and Reichart (2000) | Phone book | Switzer-land | ■ | ■ | ■ | ■ | ■ | ■ | ■ | * | * | 0% | 93% | ▴ | LCA (Process) | |||||
aZurkirch and Reichart (2000) use Ecopoints, an LCA metric that is a weighted combination of a suite of environmental effects.
Key assumptions driving this variability include energy consumption by the network and end-user devices, media file size, and media re-use; the electronic delivery option becomes less competitive as network energy, file size, and frequency of re-use increase.
As we did above, we highlight an example study with wide-ranging results. Gard and Keoleian (2002) investigate six different scenarios comparing electronic and paper library journals, finding effects ranging from a 643% increase to a 69% savings in energy use. The large increase in energy use for digital journals occurs in a scenario in which each article is read a thousand times (spread across 100 different libraries). Multiple readings skew the results in favor of paper journals, since each read beyond the first is essentially free, whereas each read of an electronic copy incurs ICT energy consumption. However, subsequent scenarios added printing and copying of articles and personal transport to and from the library, which reduced the advantage of the traditional publication. The 69% savings occurred when readers drive to the library to read the paper copy but can access the digital copy from home. Clearly, some of the scenarios are less reflective than others of how the journal publication system exists today; yet, fifteen years ago, these conclusions identified factors which could inform the evolution of this system. For instance, providing library patrons access to journal articles from home not only increases convenience, but can flip the net savings effect for this service from negative to positive—in some sense, rendering concerns about direct ICT consumption of this service moot.
3.3. Telework
Telework refers to the use of virtual collaboration and teleconferencing software, networks, and electronic file systems to enable employees to work remotely from an alternate location. Telework can potentially reduce energy used in personal transport as employees avoid commuting by working from home and as face-to-face meetings are replaced by teleconferencing. In the buildings sector, home offices might increase residential energy consumption while decreasing commercial consumption through higher utilization of existing offices (through space-sharing) and avoided new construction.
Table 4 summarizes estimates of these energy effects. Varying greatly in method and scope, the telework studies do not lend themselves to comparing quantitative results, so we report findings specific to each study rather than savings percentages. Many of the studies are optimistic about energy savings, while some are more guarded—either finding savings to be modest in the overall energy picture or finding that savings can be positive or negative depending on parameters. The most important driver of savings is frequency of teleworking; infrequent telecommuters may cause a net increase in energy use due to redundancy in home and central offices, whereas regular telecommuters allow for larger reductions in commercial consumption.
Table 4. Summary of telework studies. See table 2 caption for explanation of symbols and abbreviations.
| Study | Region | Effects | Sectors | Metrics | Net Savings | Method | |||||||||
|---|---|---|---|---|---|---|---|---|---|---|---|---|---|---|---|
| Direct | Efficiency | Substitution | Direct rebound | Indirect rebound | Economy-wide rebound | Transformation | Transport | Buildings | Air emissions | Energy | Qualitative conclusion | ||||
| Romm et al (1999) | US | ■ | ■ | ■ | ■ | ■ | Savings = 1.5% of residential & commercial electricity | ▴ | Calculation | ||||||
| Aebischer and Huser (2000) | Germany | ■ | ■ | ■ | ■ | 24% reduction in vehicle travel | ▴ | Empirical survey | |||||||
| Aebischer and Huser (2000) | Switzer-land | ■ | ■ | ■ | ■ | ■ | −115 to 282 kWh/y/telecommuter, saved depending on frequency | ◊ | Case study | ||||||
| Baer et al (2002) | US | ■ | ■ | ■ | ■ | ■ | 32 TWh electricity saved in 2001; 48-216 TWh by 2021a | ◊ | Scenario analysis | ||||||
| Robert et al (2002) | US | ■ | ■ | ■ | ■ | 5.1 million gals. gasoline saved over 68K employees for 1 year | ▴ | Empirical survey + calculation | |||||||
| Hopkinson and James (2003) | UK | ■ | ■ | ■ | ■ | ■ | ■ | ■ | 0-50% commercial space saved; Commute decrease; business travel inconclusive | ▴ | Case study | ||||
| Erdmann et al (2004) | EU-15 | ■ | ■ | ■ | ■ | ■ | ■ | ■ | ■ | Telework & virtual meetings energy savings 1% | ▴ | Scenarios w/ SD simulation | |||
| Scott Matthews et al (2005) | US, Japan | ■ | ■ | ■ | ■ | ■ | ■ | 0.01-0.4% net national energy savings | ◊ | Calculation | |||||
| Roth et al (2008) | US | ■ | ■ | ■ | ■ | ■ | ■ | ■ | ■ | 7-80 MJ annual savings per telecommuter | ▴ | LCA (hybrid) | |||
| Kitou and Horvath (2008) | US | ■ | ■ | ■ | ■ | ■ | ■ | ■ | ■ | Avg direct energy cost savings of 18% | ▴ | Simulation w/ MC | |||
aThe study does not break out the proportion of ICT direct energy use allocated to solely telework applications, so the net effect is ambiguous. These are efficiency and substitution savings due to telework, without deducting increases in direct energy use. Overall ICT impacts in this study (for teleworking and other services) vary based on scenario.
Importantly, while a few of these studies do incorporate some aspects of direct rebound—usually by acknowledging that personal errands usually combined with the work commute must be undertaken separately—broader rebound considerations are not included, and thus these results may be optimistic. Conversely, Aebischer and Huser (2000) note a reason for net benefits being underestimated: the definition of teleworking in most studies excludes those workers for whom ICT enables self-employment.
3.4. Monitoring and controls
ICT has increased the frequency and precision with which we are able to monitor and control energy-consuming processes, enabling a higher degree of process optimization. Table 5 summarizes a wide range of studies across the transport, buildings, and manufacturing sectors. While the energy savings are positive in most of these studies—being, as they are, focused on efficiency—most do not account for the direct ICT energy use, and so the net savings will be less than reported.
Table 5. Summary of monitoring and controls studies. See table 2 caption for explanation of symbols and abbreviations.
| Study | Service | Region | Effects | Sectors | Metrics | Net Savings | Method | |||||||||||
|---|---|---|---|---|---|---|---|---|---|---|---|---|---|---|---|---|---|---|
| Direct | Efficiency | Substitution | Direct Rebound | Indirect Rebound | Economy-wide rebound | Transformation | Transport | Buildings | Manufacturing | Air Emissions | Energy | Low | High | Qualitative conclusion | ||||
| Ganti et al (2010) | Vehicle routing | Urbana, IL | ■ | ■ | ■ | 6% | 13% | ▴ | Experiment + calculation | |||||||||
| Ericsson et al (2006) | Vehicle routing | Lund, Sweden | ■ | ■ | ■ | 8% | ▴ | Simulation | ||||||||||
| Gonder (2008) | Vehicle drivetrain | n/a | ■ | ■ | ■ | 2% | 4% | ▴ | Simulation | |||||||||
| Huang et al (2008) | Vehicle drivetrain | US | ■ | ■ | ■ | 1% | 3% | ▴ | Simulation | |||||||||
| Brown et al (2014) | Vehicle automation | US | ■ | ■ | ■ | ■ | ■ | ■ | −173% | 95% | ◊ | Kaya Identity estimation | ||||||
| Erdmann et al (2004) | Intelligent Transport | EU-15 | ■ | ■ | ■ | ■ | ■ | ■ | ■ | -3% | ▾ | Scenarios w/ SD simulation | ||||||
| Erdmann et al (2004) | BEMS | EU-15 | ■ | ■ | ■ | ■ | ■ | ■ | 4% | 6% | ▴ | Scenarios w/ SD simulation | ||||||
| Erdmann et al (2004) | Supply chain/ process mgmt | EU-15 | ■ | ■ | ■ | ■ | ■ | ■ | 0% | 2% | ▴ | Scenarios w/ SD simulation | ||||||
| Meyers et al (2010) | Residential energy | US | ■ | ■ | ■ | 33% | 62% | ▴ | Calculation | |||||||||
| Mattern et al (2010) | Smart meters | n/a | ■ | ■ | ■ | 2% | 4% | ▴ | Meta-analysis | |||||||||
| Davis et al (2013) | Smart meters | n/a | ■ | ■ | ■ | 1% | 3% | ▴ | Meta-analysis | |||||||||
| Doukas et al (2007) | BEMS | Greece | ■ | ■ | ■ | 10% | ▴ | Case study | ||||||||||
| Yuvraj et al (2010) | HVAC | San Diego, CA | ■ | ■ | ■ | 10% | 15% | ▴ | Pilot deployment | |||||||||
| Yuvraj et al (2011) | HVAC | San Diego, CA | ■ | ■ | ■ | 8% | 16% | ▴ | Pilot deployment | |||||||||
| Henderson and Waitner (2013) | BEMS | DC | ■ | ■ | ■ | 7% | 23% | ▴ | Case study | |||||||||
| Rogers et al (2013) | BMS & Ind. Process | US | ■ | ■ | ■ | ■ | 5% | 75% | ▴ | Literature review | ||||||||
| Masanet (2010) | Industrial controls | US | ■ | ■ | ■ | ■ | 50–3000 MMBTU/yra | ▴ | Empirical data analysis | |||||||||
ICT deployment in the transport sector is broad and multiscale. Focusing our discussion on road vehicles, components like the fuel injectors and throttle are monitored and controlled in real time to optimize fuel economy and provide fault-detection alerts; at the system level, networked vehicles and road infrastructure sensors monitor traffic, enable rerouting, and inform variable speed limits. Route optimization studies find fuel savings on the order of 10%, with additional savings of 1%–4% achievable through utilization of route information in adaptive drivetrain control. Other ICT-enablers include weigh-in-motion sensors (reducing truck diesel consumption), car- and ride-sharing (reducing urban car ownership), and real-time bus tracking (increasing appeal or convenience of public transport). Brown et al (2014) provide a comprehensive review of various vehicle automation technologies and summarize literature estimates of eleven energy effects they might yield. Langer and Vaidyanathan (2014) describe the ways in which ICT-enabled 'smart-freight' can reduce energy use in cargo transport.
Turning to buildings, Meyers et al (2010) estimate that average U.S. residences waste around 40% of their primary9 energy consumption due to inefficiency. Much of this waste is addressable by ICT interventions. Smart meter technology coupled with displays can provide real-time load information, which should cause a rational (in the classical economic sense) customer to reduce consumption. However, many studies find underwhelming savings from smart metering (Mattern et al 2010), and such studies may be biased (Davis et al 2013) or confounded by the Hawthorne effect, in which participants alter their behavior simply because they are aware that the study is taking place (Schwartz et al 2013).
Building energy management systems (BEMS), including technology like programmable thermostats and occupancy sensors, can reduce the need for human hands (and minds) to make routine energy-saving interventions. BEMS match heating, ventilating, and air conditioning (HVAC) operation to required load and analyze consumption patterns to detect faults. Empirical studies of BEMS have found energy savings of 7%–23%. Rogers et al (2013) estimate reductions of between $37 and $85 billion in annual energy costs by 'intelligent efficiency' technologies in the commercial and manufacturing sectors by the year 203510 . Aebischer and Huser (2000) express some concern over both rebound and direct consumption, positing that those installing advanced lighting control technology may be more likely to also wire more lights and noting that standby consumption for such systems is also higher. The advent of low-power sensors and controllers (Koomey et al 2013) may mitigate this last concern.
In manufacturing, industrial control systems increase efficiency, fault-detection, and productivity, reducing per-unit energy consumption and wastage (Baer et al 2002, Berkhout and Hertin 2004). The vision for achieving this potential energy savings through smart manufacturing is laid out in the DOE's 2015 Quadrennial Technology Review (U.S. Department of Energy 2015) and a European Commission report (European Commission Directorate-General for the Information Society and Media 2009). Actual savings results are hard to tease out, as modern manufacturing processes are already heavily integrated with ICT, with much of the publicly-available insight coming from DOE case studies (Masanet 2010, U.S. Department of Energy 2015). Nonetheless, ICT is a key enabler in energy-efficient manufacturing (Bunse et al 2011, Duflou et al 2012), and industry stakeholders are emphasizing ICT-enabled efficiency over the next decade (Smart Manufacturing Leadership Coalition 2011, Davis et al 2012).
ICT monitoring and control has also proved beneficial in the power sector, enabling more aggressive demand-side management (DSM); however, many DSM programs simply shift use to reduce peak loads rather than avoid the energy use overall (Palensky and Dietrich 2011). If, however, such load shifting ultimately avoids the construction of power plants or deployment of diesel generators, then the embodied energy of that infrastructure is saved.
4. Indirect complementary, economy-wide, and systemic effects
Service-specific studies like those discussed above can highlight individual pathways for ICT to alter energy consumption, but they rarely address the higher-order effects beyond efficiency and substitution. These rebound and systemic effects are crucial to an integrated picture of whether—or under which conditions—ICT services lead to in a net increase or decrease in system-wide societal energy use. If obtaining conclusive results for a particular service can be complex and uncertain, the macro picture is even more so.
The inability to draw concrete conclusions reflects, in large part, uncertainty regarding the rebound effect for ICT and the inability to disentangle root causes of interrelated economic effects. The dynamics of these effects are hugely dependent upon human behavior, which is laden with uncertainty and confounds efforts to achieve the full technical potential of ICT interventions (Sui and Rejeski 2002).
While rebound could apply to all the services discussed in section 3, telework-related rebound seems to have garnered the most interest in the literature—though a similar discussion surrounding more recent innovations such as ride-sharing services and self-driving cars is also emerging. Matthews et al (2005) note that indirect effects from telework are likely much larger than the energy savings from substitution, though the sign could be positive or negative depending on which type of effect dominates. Mokhtarian (2009) notes that travel in the U.S. has increased over the decades during which ICT might have been expected to reduce it and explains a number of ways, ranging from direct rebound through systemic change, in which ICT could stimulate more travel. For instance, ICT might generally decrease the personal cost of travel by making transportation more efficient, cheaper, and productive, and people might respond by commuting farther or taking more vacations. The model in Erdmann et al (2004) presumes a priori that this phenomenon of actually increasing energy use via large rebound—known as backfire (Sorrell 2009)—will exist for intelligent transportation systems.
However, it should be noted that these studies rely on either theorizing or speculative models rather than empirical results. Indeed, empirical data are hard to come by, with a recent review of ICT rebound studies highlighting a literature heavier on conjecture and discussion than on results (Gossart 2015). A set of case studies conducted in the EU find ICT-related rebound effects from e-commerce and telework ranging from 14% to 73% (Jørgensen et al 2006, table 3.10). Yet, even the careful attempt to base model parameters on empirical findings found in Mokhtarian (1998) demonstrates the uncertainty in assigning parameter values and the high sensitivity of the results to these assumptions.
Another way of estimating rebound effects is to analyze macroeconomic data. Choo et al (2005) attempt to assess the aggregate effect of telecommuting on vehicle miles traveled (VMT) empirically using an econometric time-series model on macroeconomic variables. They find that telecommuting had a statistically significant reduction on VMT, but note that the average magnitude of this reduction estimated by the model seems implausibly large. They rely on external evidence to argue that the actual reduction is at the low end of their estimated confidence interval.
This macroeconomic approach can be applied to the overall ICT net effect as well. A batch of studies conducted near the turn of the century note that several years of accelerated decrease in energy intensity of the U.S. economy might in part be attributed to both structural and efficiency changes caused by ICT adoption (Romm et al 1999, Laitner et al 2001, Laitner 2002). Several economic studies test this sort of hypothesis using regression—i.e., estimating coefficients representing the relationship between energy consumption and explanatory variables like ICT investment, gross domestic product, and population. Laitner and Ehrhardt-Martinez (2008) estimate that each kWh of direct electricity consumption by ICT equipment is responsible for between 6 and 14 kWh in energy savings in the US through efficiency and substitution. Other econometric studies of the U.S. and Japan find that ICT investment has led to decreased energy intensity (Takase and Murota 2004, Ishida 2015), though the latter study suggests that as developed economies complete their energy-reducing transition from 'smokestack' industries to ICT industries, ICT will eventually lead to increasing energy use due to the economic income effect.
In a sector-by-sector analysis of energy trends, however, Murtishaw and Schipper (2001) attribute decreasing energy intensity of the U.S. economy from 1988 to 1998 to structural economic changes rather than efficiency gains, and they are unable to conclude that these structural changes resulted from ICT. Cho et al (2007), looking at individual sectors of the South Korean economy, find mixed results. Furthermore, Koomey et al (2013) note that economic models are generally not good at assessing situations where the structure of the economy is undergoing rapid change and that disentangling and attributing broad effects are difficult.
Other researchers use scenario analysis to consider sets of plausible alternate pathways, rather than trying to model existing dynamics. The hope is that thinking about how possible futures could unfold will make us better prepared to monitor and direct progress. Possible energy benefits highlighted in ICT futures include information access promoting 'environmental literacy' in consumers (Rejeski 1999, Berkhout and Hertin 2004), innovation and agility in businesses (Atkinson and McKay 2007, Koomey 2012), and the easier integration of distributed and renewable generators on the electric grid (Baer et al 2002).
A 2002 RAND report uses scenarios to assess possible ICT impacts on electricity consumption through 2021 (Baer et al 2002). The report includes estimates of direct ICT electricity use, efficiency gains resulting from BEMS and industrial process controls, and indirect effects from telework and e-commerce. (Since the report focuses on electricity use, these effects generally do not include impacts in the transport sector.) The ICT-driven electricity effect in the year 2021 ranges from negative 203 TWh to positive 200 TWh across the four scenarios.
Hilty et al (2006) take a scenario-based approach for Europe, though the study looks at other environmental impacts beyond energy. Unlike the RAND study, although there is uncertainty in overall future energy consumption (with total energy consumption in Year 2020 increasing by 37% in the worst-case scenario but decreasing by 17% in the best case), the expansion of ICT universally decreases overall energy consumption versus the counterfactual base case where the level of ICT deployment remains constant. This decrease was small in aggregate, which the authors explain is the result of ICT-related energy savings in one area (e.g., process control) being offset by ICT-related energy gains in another (e.g., increased freight transport). Additionally, their model incorporates elasticity values that temper energy savings potential with significant rebound effects (Erdmann et al 2004).
Which future will manifest is hard to guess, with a recent review of macroeconomic studies showing inconclusive results (Erdmann and Hilty 2010, table 1). Rejeski (1999) highlights ways in which ICT-enabled changes sweep beyond the effects usually analyzed in these studies, changing 'the notions of property and ownership, the boundaries affecting jurisdiction, the dynamics of value creation, and the nature of competition.' The energy impacts of such systemic changes are all but impossible to quantify.
5. Conclusion
5.1. Persistent uncertainty in understanding the net energy effects of ICT
While both conceptual discussion and analytical modeling of ICT energy and environmental impacts have been occurring for nearly two decades, the jury is still out on the net effects of ICT adoption for several reasons. First, the complexity and variability of ICT deployment schemes make it difficult to isolate a standard implementation to analyze. Second, the lack of empirical data on how human users interact with ICT systems hinders the ability to assess actual energy effects. Third, the difficulties in disentangling the causes of interconnected effects lead to a tendency to fall back on theory—and on modeling exercises that conform to these theories, particularly where rebound is concerned. Finally, as the impact scope increases up the effect taxonomy (table 1), the potential effect's magnitude and uncertainty increase dramatically. The emerging theme from service-specific studies suggests a consensus that ICT has large energy saving potential, but that the realization of that potential is by no means assured. In studies of rebound and systemic effects, the uncertainty only increases.
The variation of results in tables 2–5 should drive home the conclusion that uncertainty plagues even the study of basic efficiency and substitution effects in fairly narrow, specific ICT applications. These differing results demonstrate a simple truth: it is possible to integrate ICT into a system in very inefficient ways—the mere addition of ICT to a system is not sufficient for net energy savings. The current state of understanding can be summarized with three related statements: the technical potential of ICT net energy savings is likely positive; the sign and magnitude of realized net energy savings are highly sensitive to the specific instantiation of ICT and how users interact with it; and, finally, the actual net energy effect is unclear and difficult to assess, especially when higher-order impacts are considered.
5.2. Research priorities
Though the overall net effect of ICT is likely to remain unknown, our review of the literature suggests several guidelines for improving the utility of research in this area, described below and summarized in table 6. While some of these guidelines should already be normal research practice, they are not universally employed. Others will no doubt increase the burden on researchers and raise the bar for meaningful studies in this area; nonetheless, we believe their adoption is necessary to move the field towards greater understanding of ICT's true impact on energy use.
Table 6. Guidelines for conducting future research on quantifying ICT indirect effects.
| Issue | Remediation guidelines |
|---|---|
| Lack of empirical data | • Conduct more empirical case studies; transition from 'back-of-the-envelope' calculations and scoping studies. Focus on measuring realized savings rather than on estimating potential savings. |
| • Broaden data collection and benchmarking programs such as DOE's energy consumption surveys and Center of Expertise programs (Lawrence Berkeley National Laboratory 2016) to collect and publish more comprehensive ICT deployment and energy use data. | |
| • In econometric work, focus on natural experiments to provide more evidence that results are ICT-driven. | |
| • Reconsider conducting studies where insufficient data to make robust conclusions exist. | |
| • Exhaustively document limitations and their anticipated effect on study conclusions. | |
| Overly simplified point estimates | • Integrate Monte Carlo techniques to cover a broader range of inputs. |
| • Conduct sensitivity analysis and report results. | |
| • Focus on identification of key parameters rather than on quantifying the aggregate impact. | |
| Inconsistent system boundaries | • Refrain from face-value comparison of studies with different scopes. |
| • When comparing new results to previous work, exhaustively document differences in data, methods, and assumptions. | |
| • Publish complete data, assumptions, and results so that others can fully replicate the study and can make adjustments to scope and assumptions to aid comparison with other work. | |
| Narrow effect scoping | • Integrate higher-order impacts wherever possible. |
| • Increase inclusion of behavioral aspects of ICT service deployment. |
Collect and make publicly available data on energy use for a wide range of ICT technologies, strategies and systems. In a 2009 survey, the majority of experts rated the quality and availability of data to assess ICT's effect on energy efficiency as Poor or Very Poor (Hilty et al 2009). Gathering more data in empirical studies allows assessment of how ICT systems are actually being deployed and used, further elucidating how specific conditions and parameters affect energy consumption and characterizing the 'ICT energy savings gap'—the degree to which the realized energy performance of ICT fails to attain its estimated potential. At a broader level, a large-scale, survey-based data collection initiative similar to the EIA's Residential Energy Consumption Survey and Commercial Buildings Energy Consumption Survey for IT systems deployed in the residential, commercial, industrial, and transportation sectors would be helpful in providing insight into deployment strategies and baseline energy consumption measurements.
Use simulation and sensitivity analysis more broadly in impact estimates. Many studies use point values or relatively narrow ranges for input parameters. As a result, the estimated energy impacts reflect one or two specific views of ICT deployment and ultimately do little to advance the aggregate understanding of the ICT energy effect, since a different set of assumptions can usually be found that negates or reverses the findings. Exploring more of the solution space using stochastic modeling techniques such as Monte Carlo simulation would allow for statistically robust identification of driving factors and greater insight into the uncertainty surrounding such estimates. See Weber et al (2008) for an example of how LCA can be enriched with Monte Carlo techniques.
Pay more attention to study scope, particularly when comparing different studies. In lieu of providing a broader range of results in each study, one might argue that a sufficient set of separate point estimates can be aggregated to provide a bigger picture view. Such meta-analysis, indeed, formed part of the early vision for this paper. However, data sets, modeling methods, assumptions, and scopes vary so greatly as to make a straightforward synthesis of estimates nearly impossible.
Focus on identification of key parameters rather than aggregate impacts. Rather than focusing too heavily on estimating aggregate impacts—an exercise that, as this review shows, is unlikely to yield satisfying results—researchers should focus on identification of important parameters driving the energy use in ICT-infused systems (as several of the LCA studies do). Armed with such information, both public and private decision makers can design and implement intelligent, tailored, ICT-enabled systems that adapt to minimize energy use in deployment.
Increase focus on the behavioral aspect of ICT services. The studies here are generally technical in nature, depending heavily on assumptions about system structure and human behavior that may not reflect ground truth (Hesse 2002). Focusing on behavioral aspects of ICT systems in concert with their technical properties would teach us how to align energy savings with user priorities. Amazon's shipping policies provide an illustrative example of how ICT pulls towards more energy consumption while also providing greater possibilities for reducing it through behavioral nudging. While faster delivery methods (e.g., same-day delivery, drones) are likely to be more energy-intense, Amazon has created incentive programs both for consolidating deliveries11 and for using slower, more flexible freight modes where possible12 . Since behavior can shift the direction of ICT impact, researching these sorts of ways to more precisely tailor ICT-enabled services to consumer needs could help temper the energy costs of ICT without appreciably sacrificing the quality of the customer experience.
Integrate higher-order effects. Few of the studies reviewed here address both second-order and third-order effects concurrently. Studies that present estimates of substitution and efficiency savings without addressing higher-order effects risk painting an overly simplistic picture of the ICT dynamic. Researchers should find ways to do more synthesis and integration across the taxonomy—i.e., evaluating possible higher-order effects in concert with an estimate of direct consumption, substitution, and efficiency. We can envision, for instance, a study examining whether the rapid growth of streaming video has increased the amount of content watched and placing this rebound estimate in the context of the direct energy use and substitution effects.
Notwithstanding these suggestions, developing an accurate and complete picture of the net energy effect of ICT remains a difficult task. However, we can continue to gain insight if we recognize that the specific implementation details, user behavior, and evolution over time are critically important and should not be oversimplified in the quest to compute an effect magnitude. Understanding the system dynamics as comprehensively as possible while remaining cognizant of limitations is a crucial step in ensuring that, as ICT continues its inevitable infusion in our economy and society, it functions as a dampener on energy consumption growth and a force multiplier for energy efficiency.
Acknowledgments
This work was funded by the Department of Engineering and Public Policy at Carnegie Mellon University and by the Center for Climate and Energy Decision Making (SES-0949710 and SES-1463492), through a cooperative agreement between the National Science Foundation (NSF) and Carnegie Mellon University. Work at Lawrence Berkeley National Laboratory is supported by the US Department of Energy under contract number DE-AC02-05CH11231. We wish to thank Jonathan Koomey for his helpful comments on this manuscript and the two anonymous referees for their feedback. An abbreviated version of these findings have been published as Chapter 5 of Shehabi et al (2016), a federally sponsored report on U.S. data center energy use.
Footnotes
- 3
Many, but not all, of the GHG emissions abatements result from decreased energy use.
- 4
I.e., not including manufacturing or disposal energy consumption.
- 5
See figure 2 in referenced paper and figure 9 in Koomey et al (2013) for a comparison of embodied versus operational energy for different ICT components and devices.
- 6
Masanet et al (2013) report emissions, rather than energy, but their emissions estimates are derived from an energy model and the U.S. average fuel mix and are thus proportional to energy consumption.
- 7
Note that direct and indirect rebound do not correspond to the distinction between direct and indirect energy effects used in this and other papers; all rebound effects are indirect energy effects. See first two columns of table 1.
- 8
- 9
The authors conduct their analysis on primary energy—i.e., 'inclusive of energy use upstream in the fuel cycle.'
- 10
See table 4 in the reference for a list of savings ranges for specific energy efficiency technologies in the commercial sector.
- 11
'Subscribe-and-save' offers a discount on a periodic shipment (e.g., monthly) to replenish consumable goods. The predictability of the order allows Amazon to use slower modes as well as group recurring items into a single shipment. Amazon Pantry requires customers to fill a box with eligible items before it can be shipped, which incurs a flat fee. Add-on-items are small items that can be ordered through Amazon but that will not ship individually—they must be combined with other items. (Of course, some of these policies likely induce consumption, reducing the energy savings.)
- 12
By offering video streaming credits to customers who choose a 'no-rush' delivery option.