

Abstract
Several key studies have found that a small minority of producers, polluting at levels far exceeding group averages, generate the majority of overall exposure to industrial toxics. Frequently, such patterns go unnoticed and are understudied outside of the academic community. To our knowledge, no research to date has systematically described the scope and extent of extreme variations in industrially based exposure estimates and sought to link inequities in harm produced to inequities in exposure. In an analysis of all permitted industrial facilities across the United States, we show that there exists a class of hyper-polluters—the worst-of-the-worst—that disproportionately expose communities of color and low income populations to chemical releases. This study hopes to move beyond a traditional environmental justice research frame, bringing new computational methods and perspectives aimed at the empirical study of societal power dynamics. Our findings suggest the possibility that substantial environmental gains may be made through selective environmental enforcement, rather than sweeping initiatives.
Export citation and abstract BibTeX RIS

Original content from this work may be used under the terms of the Creative Commons Attribution 3.0 licence. Any further distribution of this work must maintain attribution to the author(s) and the title of the work, journal citation and DOI.
1. Introduction
As many have noted, society's impact on the environment is best characterized by its unevenness—both within and between groups. For example, some societies pollute significantly more than other societies (Chambers et al 2000); some groups within society use far more resources than others (Baer 2009); and some individuals produce much more environmental harm (Ash and Boyce 2011). Freudenburg coined the term disproportionality to describe this pattern, defined as 'the strikingly unequal patterns of privileged access to environmental rights and resources' that characterize modern societies and economies (Freudenburg 2005, p 89). Although highly skewed patterns in pollution intensity within industrial sectors were documented as early as the mid-1990s (Streitwieser 1994), a clear understanding of why such highly reproducible and extreme unevenness exists (and persists) remains understudied or simply overlooked by researchers and practitioners. The research herein strives to lay foundational groundwork related to the characterization and description of both highly unequal patterns of pollution production among US industries and links to disproportionate exposure among environmental justice (EJ) communities. If we are to make strides against today's most wicked environmental problems (Rittel and Webber 1973), we must know more about what gives rise to these observed patterns.
Disproportionality has two dimensions—disproportionality in the production of environmental harm, polluter disproportionality, and disproportionality in exposure, often discussed within the broader framework of EJ (Collins 2011). Of these two dimensions, the latter has received the most attention, covered extensively by EJ scholars who explore the social structures linking race and class to limited access to environmental 'goods' and harmful exposure to environmental 'bads' (Mohai et al 2009; see also: Boyce 1994). On the other hand, polluter disproportionalities, or extreme variations in polluter-based production, have received only sporadic attention since the early 1990s. Although notable findings exist, which will be outlined later, this body of scholarship falls short of answering questions related to why such unevenness may exist. To our knowledge, the study herein is the first large-scale study to show industrial polluter disproportionality patterns across both a broad study area and a diverse group of polluters. Although we recognize that a complete understanding of why such patterns exist is likely dependent on a wide range of factors (such as facility characteristics, environmental context, regulatory climate, etc), we find striking evidence that extreme emitters are likely impacting EJ communities even more significantly than typical EJ scholarship might predict.
We ask the following questions:
- (I)Are producer disproportionalities present and consistent across the study area?
- (II)Are particular communities (low income and/or those of color) disproportionately impacted by producers who generate a disproportionate amount of pollution?
Our findings suggest affirmative answers to both these questions. Using public data and open-source software, we assess industrially based exposure estimates and proximate socio-demographic characteristics on a polluter-by-polluter basis across the continental United States. We find a highly skewed distribution of polluter-based harm generation with fewer than 10% of the nearly 16 000 study area facilities generating greater than 90% of estimated exposure (question (I)). When describing the socio-demographic exposure profiles, we show that although polluters are likely to disproportionately impact poor and nonwhite communities, these disproportionalities become even more pronounced when considering the smaller group of facilities who generate the majority of exposure risk (question (II)). We refer to this small group of disproportionate generators as toxic outliers.
An implication from our study is that these two sides of disproportionality are connected in a 'double disproportionality' framework. This type of connection has both applied and scholarly significance. First, double disproportionality would predict that industrial impacts overall, and in EJ communities specifically, would decrease if toxic outliers could be compelled to reduce their emissions. Second, double disproportionality adds to our understanding of how society's polluter-industrial complex works by explicitly incorporating measurable power dynamics. Future studies should consider disaggregating polluters rather than looking at polluters in the aggregate.
Our paper proceeds as follows: first, we briefly review the young, evolving body of work related to polluter disproportionality and make links to the more established body of EJ scholarship. Following this, we share methodological details, present analysis results, and provide a brief discussion to contextualize our findings both in terms of the existing science and with respect to potential new research directions.
2. Polluter inequalities and EJ: a double disproportionality?
A disproportionality perspective challenges several fundamental assumptions regarding the nature and meaning of environmental harm production while questioning prevailing theoretical perspectives about human-environmental relationships in a postindustrial world. For example, in many social science disciplines, it is common to assume that environmental harm is proportional to economic well-being. This proportionate assumption is commonly represented in the formula for analyzing the effects of human activities on the environment: I = PAT, where 'I' represents impacts, 'P' is population, 'A' is affluence, and 'T' is technology. IPAT emerged out of the Ehrlich and Holdren (1971)/Commoner (1972) debate in the 1970s as a way to define the anthropogenic forces that drive environmental impacts. There have been critiques of this formula, most recently in terms of the possible benefits of technological advancement, but few find problems with the assumption that all growth in population or affluence is problematic. Since this time, there have been surprisingly few focused efforts to test this proposition (Freudenburg 2005). The remainder of this section presents initial evidentiary support showing that, rather than problematizing increases in population and affluence in the aggregate, it may be more accurate to view anthropogenic impacts as being driven by just a few privileged actors.
More specifically, the disproportionality perspective centers on the significance and consequences of 'the socially structured and strikingly disproportionate patterns that characterize human access to the biophysical environment, both in terms of benefiting from 'goods' (resources and rights) and in terms of avoiding 'bads' (wastes and responsibilities)' (Freudenburg 2005, p 90). Such inequalities, or 'privileged access' (Freudenburg 2005, p 90) to the environmental commons, are often overlooked and unchallenged because many people assume that the harm is economically necessary for jobs, incomes, or the production of essential products. In fact, there is little evidence to support a positive association between degree of environmental harm and economic good.
To test this empirically within societies and across/within economic sectors, Freudenburg (2005, p 93) looked at the 'differential access to the assimilative capacity of the biophysical environment'. He found that approximately 60% of all toxic emissions in the United States resulted from the chemicals and primary metals sectors, which together contributed less than 5% of the gross national product and only 1.4% of the nation's jobs. Moving to intrasectoral analyses, he also found striking disproportionalities, with the major polluters being poor economic performers both in terms of overall emissions/jobs ratios and in comparison to peer companies in the same sector. At an even finer level of analysis—facilities under common corporate ownership—overall levels of pollution were driven by individual facilities that were emitting far more than their 'share' of toxins. The revealed patterns of disproportionality hold or become more extreme when one considers related factors of interest, such as the relative toxicity of releases, the relationship to income equality within nations, technological imperatives, and other economic controls. As Freudenburg points out, early studies by others have shown that arguments that attempt to explain or justify observed disproportionalities are unsupported: such poor environmental performance does not seem to be due to facilities being engaged in the production of 'critical' materials; more stringent regulation of the prime polluters would not tend to cause them to go out of business or to shift their operations to countries with weaker standards; and would not bring economic ruin to the larger society. In a broader analysis of the significance of such findings, Freudenburg notes that there have been few attempts by social scientists to understand the social construction of environmental privileges as opposed to environmental problems, or to analyze the societal and communicative mechanisms that support the perpetuation of related inequities.
Empirical work on disproportionality was taken one step further by Berry (2007) when she was able to show that many policies do not recognize the fact that a few outliers tend to be responsible for a large fraction of environmental harms. This means that, at least in some cases, the disproportionality perspective holds and implies that economic-environmental relationships will approximate a log-normal distribution (rather than standard Gaussian normal distribution), making it possible to achieve dramatic improvements in environmental quality with low economic costs. There is a clear need for future research to examine the degree of disproportionality in other areas of economic–environmental relationships, but it is equally clear that the proportionality assumption can no longer be considered empirically credible (Freudenburg 2006).
The disproportionality perspective provides an interesting overlay to some of the most prominent theories in environmental sociology. It directly challenges an important although generally unstated assumption within the theoretical perspective of ecological modernization, that is, the assumption that all types of early development efforts (economic and industrial) are environmentally harmful and that this initial harm then decreases as society becomes modern and technologically savvy. The disproportionality perspective challenges the universality of this idea by positing that it is not that all development is environmentally harmful, but rather that a select few actors drive the majority of the environmental harm. Further, in regard to the treadmill of production (Schnaiberg 1980)—another prominent theory—the disproportionality perspective does not necessarily find capital investment and capitalism to be a problem. Rather, it questions a few capitalists rather than the system at large as drivers of environmental degradation. As pointed out by Dunlap (2008, p 53), the disproportionality perspective represents a much needed 'finer-grained' approach for investigating the links between economic activity and environmental degradation. It may also lead to greater unification of the predominant theories in environmental sociology today, including the relevance of environmental state theory and the relationship of emissions levels to measures of ecological efficiency (see Fisher and Freudenburg 2004). Regarding the perpetuation of environmental inequalities, and in particular the tendency to focus on disproportionalities in environmental problems rather than environmental privileges, the social constructivist perspective also offers insight. As originally noted by Turk (1982, p 252) 'it is likely that status-quo inequalities will be maintained 'mainly by ideological power, secondarily by political and economic power, and only minimally and occasionally by the threat and use of violence'.
Empirical work along these lines is relatively rare, but certainly identifiable. Several studies have found dramatic disproportionalities in the production of environmental harm both within a given polluting sector and among the major polluters within communities or regions (Bouwes et al 2001, Nowak et al 2006, Abel 2008, Berry 2007, Ash and Boyce 2011, Prechel and Zheng 2012, Prechel and Touche 2014). Consistent with Freudenburg's work, these studies have found that a small minority of firms can drive overall pollution levels. Such findings also hold when considering community-based health risk. For example, Bouwes et al (2001) found a significant correlation between minority status and cumulative risk in specific spatial areas, with high risk facilities having average risk scores 320 times greater than their lower risk counterparts. In the same study, researchers found that the vast majority of facilities actually had very low risk scores, while a select few had scores up to thousands of times greater than a standardized mean. A study by Ash and Boyce (2011) was one of the first at the intersection of EJ and corporate responsibility. They found that of the 100 worst polluters, the top ten imposed disproportionate impacts on disadvantaged communities. They found that minorities living in communities surrounding these ten polluters were bearing more than half of the human health risk generated in the region. In 2008, Abel conducted a case study in urban St. Louis, MO, showing that minority and low-income residents live closer to industrial polluters compared to their non-minority counterparts, and that 20% of the region's air pollution exposure risk generated over the last decade was spatially concentrated among only six facilities. Nowak et al (2006) found that environmental behaviors interacted with biophysical variables to explain variations in levels of phosphorous loading in Lake Mendota, WI (see also Cabot and Nowak 2005, Harlan et al 2008). In recent work, Freudenburg et al (2009) maintained that the damage done in Hurricane Katrina was not a 'natural disaster,' but rather a case of a small number of economic beneficiaries creating extreme environmental harm that left marginalized populations in the region subject to catastrophe (see also: Bullard and Wright 1987).
Explication of the disproportionality perspective is an important step toward shedding light on potentially overlooked dynamics regarding how environmental domination of the powerless by the powerful happens. Grant et al (2002, 2010) suggest that research at the intersection of polluters and those who bear the brunt of pollution should analyze environmental actors individually (rather than in aggregate), and also treat the relationship between organizations, organizational structures, and issues of environmental privilege in a more nuanced fashion. Herein, we look for pollution disproportionalities on a polluter-by-polluter basis across the US and link such disproportionalities to EJ impacts.
3. Data and methods
This research relies on two data sources—the US Environmental Protection Agency's Risk Screening Environmental Indicators-Geographic Microdata (RSEI-GM) from 2007 and the US Census of Population and Households from 2000. Additional information about these data sources is provided below as well as a brief description of the methods leading to our results.
3.1. RSEI
Although we rely solely on the RSEI-GM, it is useful to first describe the EPAs aggregated version of RSEI, herein referred to as RSEI public-release.
3.1.1. RESI public-release data
Exposure estimates to airborne toxics originating from industrial facilities across the US are generated by the US EPA's RSEI project. The RSEI project uses release-based data of more than 600 chemicals reported annually by permitted industrial facilities in the US. These reports are mandated by EPA's toxics release inventory (TRI) program. The TRI program tracks the release of toxic chemicals, which may pose both environmental and human health threats. As per TRI reporting requirements, facilities across industrial sectors must report how much of each chemical is released to the environment and/or managed through recycling, energy recovery and treatment on an annual basis5 . Although a touted resource in itself, TRI information does have some shortcomings; of most relevance, TRI reports do not account for differences in chemical toxicity (pound-for-pound, chemicals can vary widely) thereby making between chemical comparisons difficult or simply impossible.
EPAs RSEI project addresses TRI-based chemical-to-chemical comparison limitations. On a release-by-release basis, RSEI estimates exposure, accounting for environmental fate and transport and chemical toxicity. More specifically, for each chemical release, a Gaussian-plume fate-and-transport model is employed, which estimates how the chemical spreads from its point of release to the surrounding geography. Geography, in the RSEI case, is delineated into a network of non-overlapping grid cells of 810 m2 in size. This network of grid cells extends over the entirety of the continental US. The modeling results in exposure estimates for each reported release for each grid cell. To produce such exposure estimates, EPA combines data on temperature and local wind patterns with facility-specific information (stack heights, exit velocities) and chemical specifics (molecular weights, decomposition rates). Estimates represent an ambient exposure concentration. The RSEI project then overlays the grid of toxicity-weighted exposure concentrations on population figures from the US Census. RSEI's population weights account for age and sex, since the volume of air inhaled per unit body weight is known to depend on these characteristics. Since the main purpose of the RSEI program is to aid in the prioritization of facilities for enforcement, only facility-based estimates are publically released (public release 'RSEI scores,' are a measure of human health hazard aggregated over every release-grid cell impacted by each industrial facility). RSEI public-release data does not include information on a cell-by-cell basis. EPA does provide such cell-by-cell estimates to the research community by request.
3.1.2. Risk screening environmental indicators–geographic microdata
Our measure of exposure relies on the RSEI-GM which provide disaggregated industrial toxicity exposure estimates (unlike RSEI public-release). The RSEI-GM raw data provide an exposure estimate on a release-grid cell basis. This means that for every chemical release reported by every facility in a given year (nearly one billion releases in 2007, our study year), RSEI-GM provides an exposure estimate for the network of 810 m2 grid cells extending over the continental US. Exposure estimates account for environmental conditions, facility characteristics and chemical specifics, per the RSEI program model mentioned in the previous section. Since our analysis is not chemical specific, we aggregate across all chemicals up to the 810 m2 grid cell-level resulting in an exposure estimate for each 810 m2 grid cell. The following formula represents how we accomplished this aggregation. We will use ToxicConcf,c,g to denote the exposure estimate of chemical, c, generated by facility, f, within grid cell, g. By adding over all facilities and all chemicals, we end up with a grid cell-based exposure estimate
In addition to aggregation at the grid cell-level, data can also be aggregated to the facility-level (ToxicConcf). This type of aggregation was used to assess producer disproportionalities, prior to theefforts made to link extreme polluters to EJ demographics (research question (I)).
Unlike the aggregated RSEI public-release data, we do not employ the age and sex weighting and instead, link to race and class demographic characteristics when answering research question (II).
3.2. United States 2000 census of population and households
Socio-demographic information to support evaluation of question (II) comes from the US Census of population and households. The US constitution mandates that a census of population and households be conducted every 10 years. Besides its use in determining the number of seats per state in the US House of Representatives, census data are an extremely important source of information for population scientists. The census data are available at various scales, from statistics at a large national scale, to those at the state and county levels; to those at extremely fine geographic areas such as blocks (approximately one city-block) or block-groups (corresponding approximately to neighborhoods). For our purposes, we use population demographics available at the block (race variable) and block-group (income variable) levels. The study year is 2000.
3.3. Study area stratified random sampling: linking pollution to demographics
In order to link RSEI-GM-based exposure estimates and local socio-demographic characteristics (research question (II)) we generated a large sample (over four million points) across the study area. Our sample is stratified by population density at the US county-level. Our sample reaches every county in the United States and includes chemical releases from every facility. For each of our 4, 172, 835 sample points, we note the following characteristics: (1) the exposure estimate of each release impacting the grid cell in which the point is located; (2) the number of facilities that contribute releases to the grid cell in which the point is located (3) the total population in the census block in which the point is located; (4) the total number of people who report their race as 'white alone' in the census block in which the point is located; (5) the total number of households in the census block group in which the point is located; and (6) the total household income of all households in the census block group in which the point is located. A schematic presenting a visual representation of this procedure is shown in figure 1. The mean income associated with sample points is $64 581 and mean proportion reported 'white alone' as their race is 82.5%. These figures are comparable to US Census figures, indicating that our sample can be considered representative of the US population.
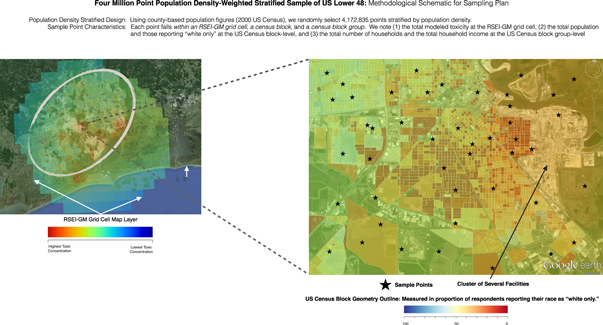
Figure 1. Sampling methodology schematic.
Download figure:
Standard image High-resolution image3.4. Computing strategy
These computations are carried out on more than 100 GB of exposure estimate data (RSEI-GM) and population data (US Census). Conducting and visualizing our analyses proved to be a highly demanding task, both in terms of processing power and data management. Although other national scope studies exist (Bullard et al 2007, Clark et al 2014), leveraging the RSEI-GM data at this scale requires some strategic computing efforts. Our main platform is an open-source Ubuntu Linux environment. Our particular machine had 24 GB RAM and 16 CPUs running Ubuntu 14.04 Trusty. To perform analyses, we used a highly indexed PostgreSQL database with a PostGIS spatial extension. As a point of reference, our analysis includes over 1billion chemical releases spanning 8, 080, 464 810 m2 grid cells originating from 15 758 facilities. Using RStudio server, running R version 3.02 and several helpful packages, we used explicitly parallel algorithms to aggregate and compile sample statistics.
4. Results and discussion
As stated earlier, our central aim is to document the extent to which industrial hyper-polluters, or toxic outliers, exist nationwide and whether they have disproportionate effects on EJ communities. Toward this end, we systematically evaluate the proportional contribution of all facilities included in our study (research question (I)) and the relationship between pollution generation extremes and local EJ variables (research question (II)).
4.1. Finding the toxic outliers
Results provide strong support for research question (I): that toxic outliers exist. We examine the distribution of facility-based exposure estimates to determine the degree of variation and disproportionality. A common way to measure this is with the Gini coefficient. A Gini coefficient of 0.96, our finding, indicates extreme distributional unevenness—providing strong support for our first research question. In point of fact, 90% of toxic concentration present in the study area is generated by only 809 (about 5%) of facilities. Results are presented in figure 2. These 809 facilities span many sectors, which provides additional support for earlier intrasectoral studies (Freudenburg 2005). They are geographically distributed across the study area.

Figure 2. Disproportionality evaluation.
Download figure:
Standard image High-resolution image4.2. Sampling: linking disproportionate exposure to EJ demography
To link demographic characteristics and exposure estimates, we sampled across the study area, noting exposure estimates and population information at every point. Figure 3 shows three probability density function (PDF) plots. The left most plot includes all sample points, the middle plot includes only points that account for the most severe 25% of those sampled, and the third includes only points that account for the most severe 10% of those sampled. Within each of the intensity groups, we present a race-income PDF. In each case, as we isolate the points with the highest exposure estimates, we find a greater density of low income households and nonwhite populations. Most EJ studies do not disaggregate in this way, thereby masking some of the most significant effects.
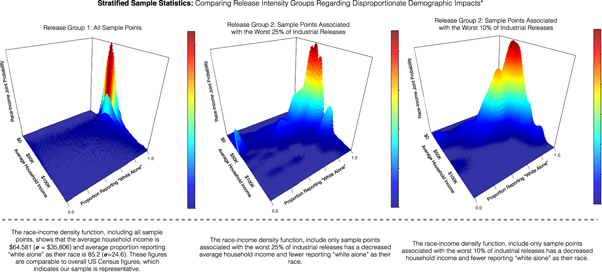
Figure 3. Stratified sample statistics: comparing release intensity groups regarding disproportionate demographic impacts.
Download figure:
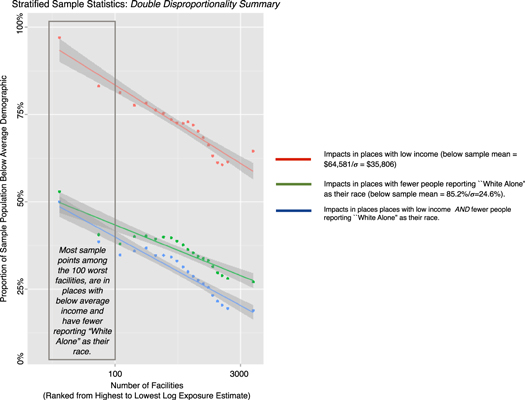
Standard image High-resolution imageWe also include a summary plot (figure 4) illustrating how demographic impacts change when you consider a small group of the most toxic polluters as compared to the entire group of polluters. In this plot, all facilities are ranked from highest log exposure estimate to lowest log exposure estimate and we assess the proportion of sample points impacting communities with below average income and fewer than average reporting 'white alone' as their race. To restate, as more facilities are considered, below average impacts decrease, meaning that the small group of the most toxic facilities are located in places where residents tend to be lower income and people of color.
Figure 4. Stratified sample statistics: double disproportionality summary.
Download figure:
Standard image High-resolution image
5. Conclusion
We are interested in drawing attention to polluter disproportionality in general and in exploring how it might relate to EJ measures. These two sides of environmental inequality are rarely drawn together in integrated research designs, yet we find evidence of their connection. We contend that an explication of these relationships is important in gaining a deeper understanding of the theoretical underpinnings of environmental injustice and in identifying potential solutions.
Although some researchers recognize the relationship between socially structured factors (i.e. privilege, power, etc) (see: Grant et al 2002, 2010) and facility-based variations in industrial pollution (see: Streitwieser 1994, Grant et al 2002, Prechel and Zheng 2012, Prechel and Touche 2014), meaningful operationalization of such concepts in a broad quantitative framework is often difficult or outside of the research scope. Herein, we strive to link such socially structured factors to pollution production disproportionalities, suggesting that environmental privilege is inherently intertwined with environmental disadvantage. For example, our results support the possibility of Lerner-style sacrifice zones—or high minority, low income neighborhoods where toxic outliers can exist without the focus they might receive in other locations (Lerner 2010). If so, the ability of such facilities to impose health risk on populations with the least capacity to resist would contribute to the persistence of these patterns and, potentially, help inform our understanding of the societal machinery that supports such unequal patterns.
Current EJ studies have been criticized as having potentially weak theoretical underpinnings (Pellow 2000). Work is needed to reinforce this base and to give the EJ body of knowledge greater sophistication and policy relevance. Other fruitful EJ research areas include stronger social class analyses; better integration with social movement theory, environmental sociology, history and ethnic studies; research that takes advantage of alliances between community activists and scholars; and studies focused on identifying solutions rather than quantifying problems (Pellow and Brulle 2005, Brulle and Pellow 2006). Sze and London (2008, p 1344) contend that research is needed that 'weaves together multi-leveled, multi-scalar, and multi-method analyses of historical, spatial, political, economic, and ecological factors' and cite the disproportionality perspective as one such approach.
At the intersection of power, pollution, and environmental policy, Boyce (1994) puts forth two hypotheses that seem especially applicable: (1) that environmental degradation depends on the balance of power where winners derive benefits and losers bear net costs; and (2) that all else equal, greater inequality in power and wealth leads to more environmental degradation. His analyses focus on which groups win and which lose, and why the winners are able to impose the consequences of their activities on the losers. The losers, in this context, could be future generations or populations that are unaware of the damage that they are absorbing, but Boyce is most interested in a third category of loser: those without sufficient power to prevent the winners from imposing the costs on them. He hypothesizes that in societies with powerful winners and powerless losers, more environmental degradation will occur because the winners are likely to be unconcerned with the effects of their actions on the losers.
More recent studies embody Boyce-style societal power dynamics, linking inequity to issues of environmental quality. For example, in a historical analysis of the relationship between environmental policy and societal power in the US, Prechel (2012) found that political mobilization of powerful organizations serves to weaken existing policy (and presumably leads to poorer environmental quality) and is inexorably intertwined with economic agendas. In a synthesis, Cushing et al (2015) reviews existing evidence related to health disparities, concluding that social inequality in the US is not only bad for the environment, but also may contribute to what, in some cases, are surprisingly poor population health outcomes.
While the global implications of environmental inequalities have been largely beyond the scope of our work, such issues obviously represent paramount concerns for the future. In relation to global climate change and environmental politics, issues of inequality in environmental and economic impacts are at the forefront. O'Brien and Leichenko (2000, p 221) have pointed to the dual factors of climate change and economic globalization as leading to 'winners' and 'losers'. In a reflection of the disproportionality perspective, Robbins (1996) and others have emphasized the role of the transnational corporations as high emitters of greenhouse gases and as power brokers in global environmental governance. At the same time, studies on the imposition of disproportionate environmental burdens on marginalized populations are increasingly focusing on areas outside the US, such as in Asia, Africa, and Latin America. Such studies need to include not only the transnational toxics trade (see also: Pellow 2007) but the disproportionate effects of weather related 'unnatural disasters' (Freudenburg et al 2009).
In an age where large amounts of environment data are available, scholars are increasingly able to gain more insight into how the winners win and who the losers really are. It is our hope that a synthesis of available knowledge coupled with innovative methodologies will guide us toward a deeper understanding and potential solutions for the people underneath the statistics.
Acknowledgments
The authors would like to thank ERL reviewers for the thoughtful and careful review of this manuscript. This work benefited by support from the University of Maryland and National Science Foundation award number DBI-1052875 to the National Socio-Environmental Synthesis Center (SESYNC).
Footnotes
- 5
TRI does not include all facilities, rather facilities must meet all of the following criteria: (1) the facility must be classified into a 'TRI-covered' North American Classification System (NAICS) code; (2) the facility must have ten or more full-time employees (or employee equivalents); and (3) the facility must manufacture, process, or use a chemical mentioned by section 313 in quantities greater than the currently established threshold. section 313 chemicals are those thought to cause cancer, chronic human health effects, significant non-cancer adverse acute human effects, or significant adverse environmental effects.