

Abstract
A lack of basic information on optimal nitrogen (N) management often results in over- or under-application of N fertilizer in small-scale intensive rice farming. Here, we present a new database of N input from a survey of 6611 small-scale rice farmers and rice yield in response to added N in 1177 experimental on-farm tests across eight agroecological subregions of China. This database enables us to evaluate N management by farmers and develop an optimal approach to regional N management. We also investigated grain yield, N application rate, and estimated greenhouse gas (GHG) emissions in comparison to N application and farming practices. Across all farmers, the average N application rate, weighted by the area of rice production in each subregion, was 210 kg ha−1 and ranged from 30 to 744 kg ha−1 across fields and from 131 to 316 kg ha−1 across regions. The regionally optimal N rate (RONR) determined from the experiments averaged 167 kg ha−1 and varied from 114 to 224 kg N ha−1 for the different regions. If these RONR were widely adopted in China, approximately 56% of farms would reduce their use of N fertilizer, and approximately 33% would increase their use of N fertilizer. As a result, grain yield would increase by 7.4% from 7.14 to 7.67 Mg ha−1, and the estimated GHG emissions would be reduced by 11.1% from 1390 to 1236 kg carbon dioxide (CO2) eq Mg−1 grain. These results suggest that to achieve the goals of improvement in regional yield and sustainable environmental development, regional N use should be optimized among N-poor and N-rich farms and regions in China.
Export citation and abstract BibTeX RIS

Content from this work may be used under the terms of the Creative Commons Attribution 3.0 licence. Any further distribution of this work must maintain attribution to the author(s) and the title of the work, journal citation and DOI.
1. Introduction
Globally, China ranks first in annual rice production, accounting for 29% of the world's rice output in 2012 (FAO 2013). Nitrogen (N) application rates for rice production (Zhang et al 2012) have increased over the past 20 years, and excessive N fertilization has been reported in some regions (Peng et al 2006, Yang et al 2012), such as the Lake Taihu region (Xia and Yan 2012, Yang et al 2012). Significant increases in fertilizer application and a lack of proportional yield response has resulted in low N-use efficiency (NUE) and serious environmental problems (e.g., reactive N losses, and greenhouse gas (GHG) emissions) (Grassini et al 2013, Peng et al 2009). Linquist et al (2012) reported that the GWP (expressed in terms of global warming potential) of GHG emissions from rice systems is roughly four times higher than either wheat or maize. Quantification of current N fertilization and improved N management practices and policies in different Chinese rice production regions is a national and global concern. These regions use different crop rotations, with a single rice crop per year in Northeast China, rice–wheat rotation in the Yangtze River region, and rice–rice rotation in South China.
Informed decisions on the use of N fertilizer require knowledge of the expected crop yield in response to N application, which is a function of the N needed for crops, the N supply from indigenous sources, and the short- and long-term fate of applied fertilizer (Dobermann et al 2003, Ladha 2005). However, the yield response to N fertilizer may vary among fields (Bundy and Andraski 1995, Cui et al 2008, Wang et al 2012), and the effort and cost required to perform in-field sampling and processing for N analysis discourages routine monitoring. In small-scale farming, a lack of knowledge on crop responses to N fertilizer and an optimal regional N rate often results in over- or under-application of N fertilizer (Huang et al 2008). Some recent field studies have reported exponential increases in direct N2O emissions and nitrate leaching to increases in the N application rate, indicating large increases in N losses following small increases in application at high N application rates (Goulding 2000, Van Groenigen et al 2010, Hoben et al 2011, Linquist et al 2012, Pittelkow et al 2015b). It is not yet clear whether regional uniform N management can balance agronomy and ethics to meet human needs in an environmentally sustainable (e.g., reducing N2O emissions per unit crop yield) way in the future.
In a given region, optimal N application rates will be more uniform under geographically similar soil and climatic conditions, and when the main factors causing variation in optimal N rates are either addressed or removed (Sawyer et al 2006). Optimal N rates between regions often vary depending on soil-specific criteria or crop management variables, such as soil productivity, producer management level, and geographic location (Sawyer et al 2006). More recently, a regional approach has been developed to optimize crop yield (Iowa State University—Agronomy Extension 2003). The maximum return to N (MRTN) is designed to determine the most economically efficient N application rate by using large pools of response trial data grouped according to criteria that indicate different N responses for regions of similar management, climate, and soils (Sawyer et al 2006).
Here, we present a new database created from a survey of 6611 small-scale rice farmers and on-farm experimental rice yield responses (n = 1177) to added N in intensive smallholder rice production across eight agroecological subregions of China (figure 1). This database will help develop guidelines for regionally optimal N management. The objectives of this study were (1) to evaluate the current status of N management in relation to farmers' practices within the primary agroecological regions of Chinese rice production, (2) to evaluate yield responses to added N fertilizer and develop a regional N management plan, and (3) to investigate the opportunity for increasing grain yields and mitigating GHG emissions using this regional N management approach instead of the current practices in each region.
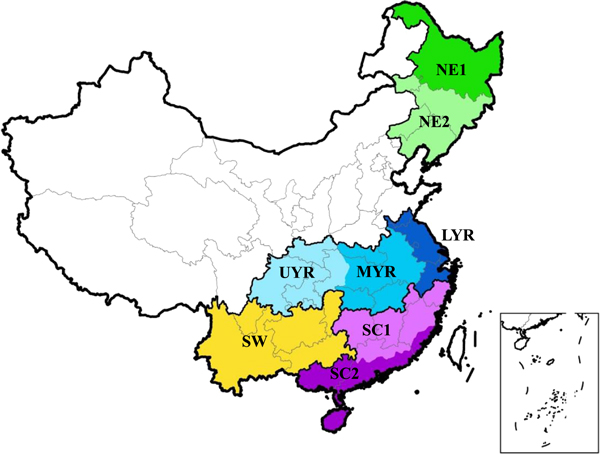
Figure 1. Map of the four major rice-planting agroecological regions (thick lines) and their subregions in China (different colors).
Download figure:
Standard image High-resolution image2. Materials and methods
2.1. Description of China's agroecological rice regions
In China, rice is grown primarily in four major agroecological regions and eight agroecological subregions: Northeast China (NE1, NE2), the Yangtze River Valley (YRV: Upper Yangtze River, UYR; Middle Yangtze River, MYR; Lower Yangtze River, LYR), South China (SC1, SC2), and Southwest China (SW; figure 1). The total area of rice production in the eight subregions is approximately 29 million ha (table S1), which represents 96% of the total rice production in China. Detailed information for location, weather and rice management on each of these subregions are provided in text S1.
2.2. Farmer survey
We used a multistage random sampling technique to select representative farmers for a face-to-face, questionnaire-based household survey conducted in 2008 and 2009. Surveys were carried out in all major rice production regions throughout the agroecological regions of China. In total, 6611 farmers from 55 counties in 21 rice-producing provinces were surveyed to collect information about N fertilizer application rates and rice yields (table 1). In each province, two to three counties were randomly selected, two townships were randomly selected from each county, two to four villages were randomly selected as sample villages from each township, and 20–25 farmers from the villages were randomly surveyed.
Table 1. Descriptive statistics of surveyed farm nitrogen (N) fertilizer application rate, rice grain yield, partial factor productivity of N (PFPN), partial N balance (PNB), and estimated greenhouse gas (GHG) emissions intensity among 6611 farm fields between 2007 and 2009 in China.
| Subregion | Cropping system | na | N rate (kg N ha–1)d | Grain yield (Mg ha–1)d | PFPN(kg kg–1)d | PNB (kg N ha−1)d | Estimated GHG emission intensity (kg CO2 eq Mg−1 grain)d,e | ||||
|---|---|---|---|---|---|---|---|---|---|---|---|
| Mean | Range | N fertilizer use | N fertilizer production | Others | Total | ||||||
| NE1 | Single-harvest rice | 327 | 131 ± 53b | 7.60 ± 0.79 | 60 ± 20 | 7 | −94–329 | 67 ± 35 | 143 ± 62 | 610 ± 35 | 821 ± 103 |
| NE2 | Single-harvest rice | 214 | 163 ± 87 | 8.07 ± 1.69 | 50 ± 30 | 31 | −90–348 | 77 ± 65 | 168 ± 91 | 575 ± 54 | 820 ± 145 |
| UYR | Single-harvest rice | 483 | 199 ± 110 | 7.07 ± 1.09 | 38 ± 26 | 66 | −107–554 | 108 ± 78 | 233 ± 101 | 1026 ± 145 | 1368 ± 302 |
| MYR | Double-harvest early (spring) rice | 423 | 197 ± 101 | 6.66 ± 1.30 | 35 ± 24 | 71 | −110–577 | 113 ± 71 | 245 ± 111 | 1158 ± 156 | 1516 ± 296 |
| Double-harvest late (summer) rice | 993 | 193 ± 70 | 6.94 ± 1.26 | 37 ± 20 | 62 | −116–535 | 106 ± 57 | 230 ± 105 | 1359 ± 134 | 1696 ± 232 | |
| Single-harvest rice | 494 | 206 ± 98 | 7.05 ± 1.47 | 35 ± 11 | 73 | −107–588 | 113 ± 80 | 242 ± 116 | 933 ± 121 | 1288 ± 244 | |
| LYR | Single-harvest rice | 356 | 316 ± 127 | 7.61 ± 1.16 | 25 ± 14 | 173 | −110–560 | 195 ± 98 | 345 ± 125 | 873 ± 87 | 1413 ± 222 |
| SC1 | Double-harvest early (spring) rice | 333 | 206 ± 106 | 7.00 ± 1.56 | 34 ± 20 | 73 | −93–536 | 114 ± 74 | 245 ± 104 | 1103 ± 146 | 1462 ± 291 |
| Double-harvest late (summer) rice | 450 | 212 ± 96 | 6.85 ± 1.61 | 32 ± 13 | 83 | −83–480 | 120 ± 69 | 257 ± 110 | 1377 ± 210 | 1754 ± 303 | |
| Single-harvest rice | 213 | 223 ± 118 | 7.43 ± 1.85 | 35 ± 21 | 83 | −107–520 | 118 ± 78 | 249 ± 99 | 898 ± 114 | 1265 ± 261 | |
| SC2 | Double-harvest early (spring) rice | 1268 | 217 ± 115 | 6.54 ± 1.78 | 32 ± 20 | 94 | −96–515 | 130 ± 82 | 275 ± 114 | 1184 ± 178 | 1589 ± 352 |
| Double-harvest late (summer) rice | 565 | 244 ± 105 | 6.47 ± 1.66 | 27 ± 19 | 123 | −111–584 | 153 ± 85 | 314 ± 119 | 1465 ± 186 | 1932 ± 338 | |
| SW | Single-harvest rice | 492 | 203 ± 114 | 7.10 ± 1.64 | 36 ± 21 | 69 | −102–567 | 110 ± 75 | 237 ± 89 | 1115 ± 199 | 1462 ± 328 |
| Nationalc | — | 6611 | 210 | 7.14 | 37 | 82 | −116–588 | 119 | 245 | 1026 | 1390 |
a n: number of observations. bMean ±SD. cNational values are computed from the regional values weighted by area. Detailed information is provided in text S2. dN rate, grain yield, PFPN, PNB and estimated GHG emission intensity were derived from the 6611 farms. eThe estimated GHG intensity based on Cui et al (2014).
2.3. On-farm field experiments
In total, 1177 on-farm N fertilizer experiments were conducted in 173 counties of 21 provinces from 2005 to 2010 in the NE (n = 136), YRV (n = 543), SC (n = 334), and SW (n = 164) regions (table 2). All of the counties included in the farmer surveys were also part of these 173 counties.
Table 2. The number of on-farm experiments, medium nitrogen (N) rate (MN), mean grain yield with different N treatments, maximum yield (max. yield), and increased yield to applied N fertilizer (IYN) at different sites.
| Subregion | Cropping system | na | MN (kg ha−1) | Yield without N (Mg ha−1) | Yield at 50% MN (Mg ha−1) | Yield at MN (Mg ha−1) | Yield at 150% MN (Mg ha−1) | Max. yield | IYNd |
|---|---|---|---|---|---|---|---|---|---|
| NE1 | Single-harvest rice | 47 | 102 ± 4b | 4.74 ± 2.00 | 6.75 ± 1.52 | 7.82 ± 1.24 | 7.51 ± 1.06 | 7.90 ± 1.30 | 3.17 ± 1.21 |
| NE2 | Single-harvest rice | 89 | 153 ± 27 | 6.71 ± 1.22 | 7.96 ± 1.17 | 9.17 ± 1.88 | 8.27 ± 1.60 | 9.22 ± 1.19 | 2.51 ± 1.15 |
| UYR | Single-harvest rice | 77 | 162 ± 11 | 6.39 ± 1.11 | 7.66 ± 1.15 | 8.53 ± 1.17 | 8.05 ± 1.11 | 8.58 ± 1.17 | 2.20 ± 0.94 |
| MYR | Double-harvest early (spring) rice | 202 | 165 ± 22 | 4.50 ± 1.16 | 6.02 ± 1.07 | 6.84 ± 1.10 | 6.43 ± 1.04 | 6.87 ± 1.10 | 2.37 ± 0.90 |
| Double-harvest late (summer) rice | 177 | 174 ± 22 | 4.99 ± 0.91 | 6.41 ± 0.92 | 7.22 ± 0.95 | 6.69 ± 0.95 | 7.25 ± 0.93 | 2.26 ± 0.83 | |
| Single-harvest rice | 51 | 182 ± 13 | 6.11 ± 1.27 | 7.25 ± 1.46 | 7.99 ± 1.29 | 7.51 ± 1.50 | 8.09 ± 1.29 | 1.98 ± 0.95 | |
| LYR | Single-harvest rice | 36 | 226 ± 5 | 5.95 ± 0.87 | 7.99 ± 0.90 | 9.10 ± 0.86 | 8.43 ± 0.82 | 9.13 ± 0.84 | 3.18 ± 0.91 |
| SC1 | Double-harvest early (spring) rice | 67 | 159 ± 8 | 5.17 ± 1.07 | 6.35 ± 1.01 | 7.11 ± 0.92 | 6.75 ± 0.85 | 7.16 ± 0.90 | 1.99 ± 0.73 |
| Double-harvest late (summer) rice | 82 | 160 ± 11 | 5.34 ± 0.80 | 6.37 ± 0.70 | 7.03 ± 0.81 | 6.76 ± 0.73 | 7.07 ± 0.80 | 1.73 ± 0.71 | |
| Single-harvest rice | 47 | 178 ± 9 | 6.24 ± 1.07 | 7.48 ± 0.95 | 8.27 ± 1.09 | 7.77 ± 1.01 | 8.29 ± 1.08 | 2.05 ± 0.73 | |
| SC2 | Double-harvest early (spring) rice | 61 | 171 ± 26 | 5.50 ± 1.08 | 6.21 ± 1.11 | 6.78 ± 1.12 | 6.30 ± 1.07 | 6.84 ± 1.12 | 1.79 ± 0.89 |
| Double-harvest late (summer) rice | 77 | 165 ± 23 | 4.99 ± 0.91 | 6.19 ± 0.99 | 6.75 ± 0.93 | 6.70 ± 0.97 | 6.81 ± 0.94 | 1.82 ± 0.65 | |
| SW | Single-harvest rice | 164 | 165 ± 27 | 5.20 ± 1.19 | 6.54 ± 1.15 | 7.23 ± 1.12 | 6.88 ± 1.27 | 7.28 ± 1.21 | 2.09 ± 0.81 |
| Nationalc | — | 1177 | 166 | 5.24 | 6.94 | 7.44 | 7.33 | 7.84 | 2.32 |
a n: number of observations. bMean ±SD. cNational values are computed from the regional values weighted by area. Detailed information is provided in text S2. dIYN, the difference between maximum yield and N0 yield for each experiment.
All experimental fields received the same treatments without replication: no N fertilizer (N0), medium N application rate (MN), 50% MN, and 150% MN. The MN rate was determined by local agricultural extension employees according to their experience and target yield (1.1 times the average yield of the past 5 years). All experiments received 97–270 kg N ha−1. The granular urea was applied 40% at sowing or transplanting, 25% at the tillering stage, and the remainder at the panicle differentiation stage. All experimental fields also received 30–180 kg P2O5 ha−1 and 24–165 kg K2O ha−1 (table S2), which were applied by broadcasting before sowing or transplanting rice. No manure was used.
Individual plots were about 50 m2 (5 m × 10 m). The management of all 1177 on-farm experiments, including sowing or transplanting rice, and control of diseases, insect pests and weeds, was done by local farmers according to their experience. Local farmers determined the timing of planting or transplanting, the variety of rice, and the time of harvest. At the time of harvest, a 2.5 m × 4 m section was harvested from each experimental plot to measure yield. The grain yield was adjusted to a moisture content of 14%.
2.4. Estimated regionally optimal N rate (RONR)
A RONR was calculated for each subregion through several steps. First, a quadratic regression model was used to assess the grain yield response to N application rate for the 1177 on-farm N response trials using PROC NLIN of SAS (version 9.1.3; SAS Institute Inc. 2006), showing that yield significantly (P < 0.05) responded to the N rate (Wallach and Loisel 1994). Next, from the response curve equation for each experiment, we calculated the following variables for each 1 kg N increment from 0 to 250 kg N ha−1: yield increase (amount above the yield in the N0 treatment), the gross return in Chinese yuan for the yield increase (rice grain yield times grain price), the N fertilizer cost (N application rate times fertilizer price), and the net return on N application (gross return in Chinese yuan minus the cost of N fertilizer). Finally, for each incremental N rate, we averaged the net return across all N response models for each subregion and rotation type. The N application rate with the greatest average net return on investment was defined as the RONR for rice in each subregion (Sawyer et al 2006). A range of N rates around the RONR rate can be defined to be within the economically profitable N rate range (PNRR) when it results in a net return to N within ±14.87 yuan ha−1 (US$1.00 acre−1; Sawyer et al 2006) can be defined as the smallest and largest profitable N rate (PNRR low, PNRR high), respectively. N application rates outside this range were defined as under- or overapplication in each subregion.
2.5. Date analysis
The partial factor productivity (PFP) was defined the ratio of crop yield per unit of applied N fertilizer (Dobermann 2005). The partial N balance was defined as N application minus above-ground N uptake (Zhang et al 2013). The details of these two parameters were shown in text S2.
Total GHG emissions during the entire life cycle of rice production, including CO2, methane (CH4), and nitrous oxide (N2O), comprise three components: GHG emissions during and following N, P, and K fertilizer application, production, and transportation; GHG emissions from pesticide and herbicide production (delivered to the gate); and diesel fuel consumption during sowing, harvesting, and tilling (Forster et al 2007).


where GHGmt is the GHG emission originating from mining and manufacturing and N fertilizer transportation (table S3). Total N2O (kg N ha−1) included direct and indirect N2O emissions from ammonia volatilization, N leaching and N runoff. The N losses from direct N2O, ammonia volatilization and N leaching and N runoff were calculated based on an empirical N loss model (Cui et al 2014). N rate is the N fertilizer application rate (kg N ha−1).
GHGother represents GHG emission of P and K fertilizer production and transportation, pesticide and herbicide production, and transportation, diesel fuel consumption (table S3). GHGCH4 was calculated with 1625 kg CO2 eq ha−1 for single rice cropping system in northeast China, 5225 kg CO2 eq ha−1 for rice-upland crop rotation system in south China, and 6125 and 8075 kg CO2 eq ha−1 for early rice and late rice in the double rice cropping system, respectively (Feng et al 2013). The other details of this calculation of GHG emission were shown in text S4.
3. Results
3.1. Farmers' practices for rice production
Across all 6611 farms, the average rice grain yield, weighted by the area of rice production in each subregion, was 7.14 Mg ha−1 and the N application rate averaged 210 kg N ha−1 (table 1). Across all farms, the N application rate ranged from 30 to 744 kg N ha−1, with a coefficient of variation (CV) of 50%, and grain yield ranged from 2.5 to 12.8 Mg ha−1. No significant correlation was observed between the N rate and crop grain yield, indicating overuse and misuse N fertilization as being common occurrences in Chinese rice production (figure S1). As a result, large variation in the partial N balance existed across the farms, which ranged from −116 to 588 kg N ha−1, with a CV of 125% (table 1).
Large variation in N fertilizer application and grain yield was observed across the eight agroecological subregions (table 1). N application rates ranged from 131 kg ha−1 (NE1) to 316 kg ha−1 (LYR) and rice grain yields ranged from 6.47 Mg ha−1 (SC2-ER) to 8.07 Mg ha−1 (NE2). Across all eight subregions, the PFPN averaged 37 kg kg−1 (table 1) and ranged from 25 kg kg−1 (LYR) to 60 kg kg−1 (NE1). The PNB averaged 82 kg N ha−1 and ranged from 7 kg N ha−1 (NE1) to 173 kg N ha−1 (LYR) (table 1). The estimated GHG emission intensity, weighted by the area of rice production in each subregion, averaged 1390 kg CO2 eq Mg−1 grain (table 1) and ranged from 820 kg CO2 eq Mg−1 grain (NE2) to 1932 kg CO2 eq Mg−1 grain (SC2-LR; table 1). This large variation in the intensity of GHG emissions was due to high N fertilizer use (244 kg N ha−1), low grain yield (6.47 Mg ha−1), and high emission factors for soil CH4 emission (8026 kg CO2 eq ha−1) in SC2-LR, and low N fertilizer use (163 kg N ha−1), high grain yield (8.07 Mg ha−1), and low emission factors for soil CH4 emission (1634 kg CO2 eq ha−1) in NE2.
3.2. Regionally optimal N management
Across all 1177 on-farm experiments, the national rice grain yield under the N0 treatment, weighted by rice area in each subregion, was 5.24 Mg ha−1 (NE2; table 2). The MN rate, as determined by local agronomists, averaged 166 kg ha−1 and ranged from 102 kg ha−1 (NE1) to 226 kg ha−1 (LYR). The corresponding grain yield under the MN rate averaged 7.44 Mg ha−1 and ranged from 6.75 Mg ha−1 (SC2-LR) to 9.17 Mg ha−1 (NE2; table 2). Adding more N beyond MN (+50%) did not increase yields from the MN levels, but reduced PFPN; treatments below MN (−50%) produced 7% lower yield, 6.94 Mg ha−1, compared to MN (table 2).
The RONR, weighted by the area of rice production in each subregion, averaged 167 kg N ha−1 and ranged from 114 (NE1) to 224 kg N ha−1 (LYR) (figure 2 and table 3). Grain yield averaged 7.67 Mg ha−1 and ranged from 6.69 Mg ha−1 (SC2-ER) to 8.97 Mg ha−1 (LYR; table 3). The estimated N balance, weighted by rice area in each subregion, was 23 kg N ha−1 (table S4). The estimated GHG emission intensity averaged 1236 kg CO2 eq Mg−1 grain (table 3), including contributions of 84, 182, and 970 kg CO2 eq Mg−1 grain from N fertilizer application on farmland, N fertilizer production, and transportation, respectively (data not shown). The estimated GHG emissions intensity ranged from 735 kg CO2 eq Mg−1 grain (NE2) to 1709 kg CO2 eq Mg−1 grain (SC2-LR).

Figure 2. Rice grain yield and fertilizer economic components of calculated net return across N rates with regional optimal N rate and profitable N rate range within 14.87 yuan ha−1 ($1.00 acre−1) of the maximum return in the 8 agro-ecological subregions. The N fertilizer to rice price ratio used is 1.83 (N price 4.82 yuan kg−1 and rice price 2.63 yuan ha−1).
Download figure:
Standard image High-resolution imageTable 3. Nitrogen (N) rate, yield, and estimated greenhouse gas (GHG) emissions intensity of the regional optimal N rate and profitable N rate range within 14.87 yuan ha−1 ($1.00 acre−1) of the maximum return.
| The regionally optimal N rate (RONR) | Low profitable N rate (PNRR low) | High profitable N rate (PNRR high) | ||||||||||
|---|---|---|---|---|---|---|---|---|---|---|---|---|
| Subregion | Cropping system | n | N rate (kg ha−1) | Yield (Mg ha−1) | PFPN (kg kg−1) | Estimated GHG emission intensity (kg CO2 eq Mg−1 grain) | N rate (kg ha−1) | Yield (Mg ha−1) | Estimated GHG emission intensity (kg CO2 eq Mg−1 grain) | N rate (kg ha−1) | Yield (Mg ha−1) | Estimated GHG emission intensity (kg CO2 eq Mg−1 grain) |
| NE1 | Single-harvest rice | 47 | 114 | 7.78 | 69 | 778 | 108 | 7.76 | 771 | 118 | 7.78 | 784 |
| NE2 | Single-harvest rice | 89 | 155 | 8.90 | 57 | 735 | 148 | 8.88 | 726 | 163 | 8.91 | 744 |
| UYR | Single-harvest rice | 77 | 163 | 8.40 | 51 | 1104 | 154 | 8.38 | 1094 | 173 | 8.41 | 1117 |
| MYR | Double-harvest early (spring) rice | 202 | 167 | 6.75 | 41 | 1453 | 157 | 6.73 | 1441 | 176 | 6.76 | 1468 |
| Double-harvest late (summer) rice | 177 | 170 | 7.10 | 42 | 1620 | 160 | 7.08 | 1608 | 179 | 7.11 | 1633 | |
| Single-harvest rice | 51 | 172 | 7.88 | 46 | 1111 | 161 | 7.86 | 1099 | 182 | 7.90 | 1125 | |
| LYR | Single-harvest rice | 36 | 224 | 8.97 | 40 | 1051 | 214 | 8.95 | 1039 | 234 | 8.98 | 1065 |
| SC1 | Double-harvest early (spring) rice | 67 | 162 | 7.03 | 43 | 1377 | 152 | 7.01 | 1365 | 172 | 7.04 | 1393 |
| Double-harvest late (summer) rice | 82 | 162 | 6.95 | 43 | 1638 | 152 | 6.93 | 1626 | 173 | 6.96 | 1654 | |
| Single-harvest rice | 47 | 171 | 8.14 | 48 | 1075 | 161 | 8.12 | 1063 | 181 | 8.15 | 1089 | |
| SC2 | Double-harvest early (spring) rice | 61 | 163 | 6.69 | 41 | 1453 | 153 | 6.67 | 1441 | 174 | 6.71 | 1468 |
| Double-harvest late (summer) rice | 77 | 164 | 6.70 | 41 | 1709 | 153 | 6.68 | 1695 | 174 | 6.72 | 1721 | |
| SW | Single-harvest rice | 164 | 162 | 7.13 | 44 | 1391 | 153 | 7.11 | 1380 | 172 | 7.14 | 1405 |
| National a | — | 1177 | 167 | 7.67 | 47 | 1236 | 158 | 7.65 | 1225 | 176 | 7.68 | 1249 |
aNational values are computed from the regional values weighted by area. Detailed information is provided in text S2.
The lowest and largest profitable N rate, weighted by the area of rice production in each subregion, was 158 and 176 kg N ha−1, yielding 7.65 and 7.68 Mg ha−1, the estimated GHG emission intensity averaged 1225 and 1249 kg CO2 eq Mg−1 grain (table 3). Compared to RONR, adding more N (PNRR high) did not increase yields, but increased GHG emission intensity; adding less N (PNRR low) did not reduce yields, but reduced GHG emission intensity (table 3).
3.3. Opportunities to increase yield, and reduce the N application rate and GHG emission intensity by regional N management
If all famers were to use a uniform N rate with average of 210 kg N ha−1, the estimated GHG emission intensity among 6611 farm fields was reduced by 6%, from 1390 to 1305 kg CO2 eq ha−1 (table S5). Further, a regional N management approach would reduce the N fertilizer application rate by 20.5% (from 210 to 167 kg N ha−1), compared to current practices. Grain yield would increase by 7.4% (7.14 versus 7.67 Mg ha−1) and estimated GHG emission intensity would decrease by 11%, from 1390 to 1236 kg CO2 eq Mg−1 grain. As a consequence of increased grain yield, reduced N rates and GHG emission, the regional N management significantly increased net economic gains by 10.2% from 2669 to 2941 $ ha−1 compared to current farmer's practice (table S6).
In this study, we define N overuse as the amount of N application greater than the largest profitable N rate (118–234 kg N ha−1) and N deficiency as N application lower than the smallest profitable N rate (108–214 kg N ha−1) in each subregion. Across all farms, 3734 sites (56%) had N overuse and 2153 sites (33%) had N underuse (data not shown). Across the eight agroecological subregions, all except NE2 showed a high proportion of N overuse (>50% sites), ranging from 50% (UYR) to 74% (LYR; data not shown). NE2 had a high proportion of N underuse at 56% of the sites. The proportion of sites with N underuse in other subregions ranged from 19% (LYR) to 41% (UYR and SW; data not shown).
Of the eight agroecological subregions, NE2, NW1, UYR, MYR-Sr, LYR, and SC1-Sr, showed the highest increase in yield potential (>0.53 Mg ha−1 mean yield increase; figures 3(a) and S2(a)), ranging from 0.71 to 1.37 Mg ha−1 and accounting for 44% of the total area in rice production. The subregions with the highest potential for N reduction (>43 kg N ha−1 mean N reduction; figures 3(b) and S2(b)) were LYR, SC1-ER, SC1-LR, SC1-Sr, SC2-ER, and SC2-LR, ranging from 44.3 to 92.3 kg N ha−1 and accounting for 39% of the total area in rice production. Reduced N rates in other subregions ranged from 7.8 to 40.4 kg N ha−1. Subregions with a high potential to decrease GHG emission intensity (>154 kg CO2 eq Mg−1 grain; figures 3(c) and S2(c)) included UYR, MYR-Sr, LYR, SC1-Sr, and SC2-LR, ranging from 177 kg CO2 eq Mg−1 grain to 362 kg CO2 eq Mg−1 grain and accounting for 43% of the total area in rice production. Reduced estimated GHG emissions in other regions ranged from 42 kg CO2 eq Mg−1 grain to 136 kg CO2 eq Mg−1 grain.

Figure 3. Difference in grain yield (a), nitrogen (N) application rates (b), and GHG emission intensity (c) between the regional N rate and farmer's practice in the eight agroecological subregions.
Download figure:
Standard image High-resolution image
4. Discussion
In China, high N application rates and large variation (210 kg N ha−1 from 30 to 744 kg N ha−1) in fertilizer use by farmers across 6611 farms resulted in a low PFPN of 37 kg kg−1. Similar results were reported by Peng et al (2006), who showed that the PFPN averaged 35 kg kg−1 in farmers' fields in Zhejiang, Jiangsu, Hunan, and Guangdong provinces. In comparison, grain yield in Japan and South Korea was similar to that in China (Peng et al 2010, Grassini et al 2013), but the PFPN was 75 kg kg−1 in Japan (Dobermann and Cassman 2005) and 48 kg kg−1 in South Korea (Lee et al 2004). A large variation in PFPN among subregions was observed and ranged from 25 to 60 kg kg−1. Higher NUE was observed in the low PNB subregions, such as 60 and 50 kg kg−1 in NE1 and NE2, respectively (table 1). Lower NUE occurred in the high PNB subregions, such as 25 kg kg−1 in LYR (table 1).
A high N application rate and low PFPN are associated with large N losses and GHG emissions. We found that the estimated GHG emission intensity across all farms, depending on fertilizer use by farmers and weighted by the area of rice production in each subregion, averaged 1390 kg CO2 eq Mg−1 grain, which is significantly higher than the 781 kg CO2 eq Mg−1 grain reported in Japan (Breiling et al 1999), primarily because of large variation in N fertilizer use and higher CH4 release in Chinese rice production (161 kg CH4 ha−1 yr−1 in Japan versus 331 kg CH4 ha−1 yr−1 in China; Leip and Bocchi 2007, Feng et al 2013). Correspondingly, the GHG intensity in Philippines (1487 kg CO2 eq Mg−1 grain) and Thailand (1409 kg CO2 eq Mg−1 grain) was similar with this study (1390 kg CO2 eq Mg−1 grain) because of high methane emissions rate (Bronson et al 1997, Towprayoon et al 2005).
In small-scale farming, farmers' lack of general knowledge and information on yield responses of rice to N fertilizer are the primary reason for either over- or under-application of N fertilizer (Huang et al 2008). Here, we developed and assessed a regional N management approach using economic return to N application, with a large number of N-response trials as the basis for the suggested N rate in each region. The N rate with the largest average net return is the RONR for rice in each agroecological subregion. The RONR analysis (figure 2) revealed an interesting result that the net return to applied N was fairly relatively flat at rates around the maximum net return (figure 2). Similar results have been reported by Sawyer et al (2006). This indicates that choosing an N rate within the profitable range around the RONR minimizes the net loss for over- and under-application.
Around the RONR, a 7.8% increase in yield and a 11% reduction of GHG emissions are likely to be achieved through a combination of an increased N rate on farms with under-application of N (56% of area) and improved PFPN on farms in which N fertilizer use is already high (33% of area). This result is in agreement with previous observations whereby a decrease in the total N rate caused yield reduction in subsequent rice crops under optimal N management practices in China (Peng et al 2010). For example, field experiments conducted in China comparing farmers' N practices found that site-specific N management reduced N fertilizer use by 32% and increased rice grain yield by 5% (Wang et al 2001, Peng et al 2010). Meanwhile, regional N guidelines, such as those proposed here, could also reduce the need for intensive soil or plant sampling and processing, and could be easily applied in rapidly developing economies with a large number of small farms.
This analysis is an initial assessment based on currently available field data, thus several limitations exist. First, in addition to N application rate, N losses also depend on specific local conditions and other management practices; together these include topography, soil type, climate, and N application method (Stehfest and Bouwman 2006, Snyder et al 2009). Where possible, these environmental factors and crop practices with different regions affecting N losses should be taken into account in calculating N losses from any particular site or treatment. However, the intent of this study was to compare the GHG emission of different N management approaches on a very broad scale across crops and across regions, to determine if a regional N management could reduce potential GHG emission intensity. The soil, environmental conditions, and N application methods were the similar on each of these subregions.
Second, although CH4 emission is different with regions in this study, responses to N management were not estimated. CH4 is dominant GHG produced and emitted in rice system, with emissions being largely controlled by water and residue management practice (Wassmann et al 2000). The influence of N rate on CH4 is less well understand, with fertilizer management affecting CH4 fluxes at some reports (Linquist et al 2012), but not at other (Linquist et al 2012, Pittelkow et al 2015a).
Third, it should be noted that the results comes from comparing RONR from field trial data to farmers' practices from the farmer survey. Although both the farmer surveys and N response trials were conducted in the main rice-growing provinces over multiple years in China, this still introduces some uncertainty about potential N fertilizer reductions, yield gains, and GHG emissions. A treatment controlling for farmers' N application is needed to accurately assess the N application rates and grain yield in the future.
5. Conclusions
High N application and large variation (210 kg N ha−1 from 30 to 744 kg N ha−1) in small-scale Chinese rice farming was found to result a low PFPN (37 kg kg−1 on average) and high GHG emission intensity (1390 kg CO2 eq Mg−1 on average). In the present study, based on a large-scale farmer survey and N response experiments, RONR are predicted to lead to a 20.5% reduction in N fertilizer application with a 7.5% increase in rice grain yield, 10.2% increase net economic gains, and 11.1% reduction in GHG emissions. This regional N plan could be easily adopted in rapidly developing economies with a large number of smallholder farms, which are hot spots of N-induced environmental problems around the globe. Such improvements, bolstered by more financial and technical support around the world, would be valuable steps toward increasing grain yield and reducing N fertilizer application to ensure global food security and mitigate the environmental footprint of grain production.
Acknowledgments
We acknowledge funding support from the National Basic Research Program of China (973, Program: 2009CB118606), Special Fund for Agro-scientific Research in the Public Interest (201103003).