

Abstract
Methane is the second most powerful carbon-based greenhouse gas in the atmosphere and its production in the natural environment through methanogenesis is positively correlated with temperature. Recent field studies showed that methane emissions from Arctic thermokarst lakes are significant and could increase by two- to four-fold due to global warming. But the estimates of this source are still poorly constrained. By using a process-based climate-sensitive lake biogeochemical model, we estimated that the total amount of methane emissions from Arctic lakes is 11.86 Tg yr−1, which is in the range of recent estimates of 7.1–17.3 Tg yr−1 and is on the same order of methane emissions from northern high-latitude wetlands. The methane emission rate varies spatially over high latitudes from 110.8 mg CH4 m−2 day−1 in Alaska to 12.7 mg CH4 m−2 day−1 in northern Europe. Under Representative Concentration Pathways (RCP) 2.6 and 8.5 future climate scenarios, methane emissions from Arctic lakes will increase by 10.3 and 16.2 Tg CH4 yr−1, respectively, by the end of the 21st century.
Export citation and abstract BibTeX RIS
1. Introduction
The warming record of arctic regions was shown to be more than a factor of two greater than the global mean value in recent decades [Hansen et al 2007], and according to the projections of global climate models, the arctic could be warmed by 2 °C–7.5 °C by 2100 [IPCC 2013]. One possible ramification of this warming is the amplified vulnerability of arctic and boreal permafrost carbon, one of the largest organic carbon reservoirs [Schuur and Abbott 2011]. For instance, one estimate suggests that global warming could thaw 25% of the permafrost area by 2100, thus rendering about 100 Pg carbon vulnerable to decay [Davidson and Janssens 2006]. Thawing of ice-rich permafrost can also transform the hydrologic landscape to aid in the formation/expansion of water-covered lands such as lakes and wetlands [Zimov et al 1997, Shindell et al 2004]. Subsequently, anaerobic decomposition of thawed organic carbon in these inundated areas fosters emissions of methane (CH4), a greenhouse gas 12 times more potent than carbon dioxide (CO2), by mole, on a 100 year time horizon [Shindell et al 2009], which could constitute a positive feedback to the climate system [Zhuang et al 2004, Walter et al 2006, Striegl et al 2012].
In comparison to high-latitude wetlands, arctic lakes draw less attention in the global CH4 cycling research, although lakes occupy up to 30% of land surface area in some Arctic regions [Zimov et al 1997, Semiletov 1999, Riordan et al 2006]. While satellite-based studies suggested that lakes are disappearing in discontinuous, isolated and sporadic permafrost areas [Smith et al 2005], models with simple algorithms of thermokarst lake dynamics projected that the area of arctic thaw lakes will increase by 15–25% by 2100 [van Huissteden et al 2011, Gao et al 2013]. Recent field measurements showed that CH4 fluxes from thaw lakes may be five times larger than previously estimated and that the thawing permafrost along lake margins accounts for most of this CH4 release [Walter et al 2006]. When extrapolating the updated fluxes over arctic regions, thermokarst lakes could emit as much as 3.8 and 2 Tg CH4 yr−1 from northern Siberia and Alaska, respectively [Walter et al 2006, Walter Anthony et al 2012]. By using recent data on the area and distribution of inland waters, Bastviken et al (2011) estimated that the total CH4 emissions from lakes in the north of 60°N is from 7.1 to 17.3 Tg CH4 yr−1, which is nearly a third of CH4 emissions from northern high-latitude wetlands [Zhuang et al 2004, Chen and Prinn 2006, Riley et al 2011]. However, since the CH4 cycling in lakes involves many processes, including methanogenesis in anoxic sediments, diffusion or ebullition of aqueous or gaseous CH4 through sediments and water, and methanotrophy in oxic water [Valentine and Reeburgh 2000, Valentine et al 2001, Liikanen et al 2002], the extrapolation of measured CH4 fluxes from several sites to large areas could be questionable in quantifying regional lake CH4 emissions. For instance, the estimation of global CH4 emissions from lakes in the last 30 years scatters widely with 1–25 Tg CH4 yr−1 by Cicerone and Oremland (1988), 36–51 Tg CH4 yr−1 by Casper et al (2000), 8–48 Tg CH4 yr−1 by Bastviken et al (2004), and 103 Tg CH4 yr−1 by Bastviken et al (2011). Quantifying the contribution of arctic lakes to future global CH4 surface fluxes from a few site measurements is also problematic.
Herein we applied a one-dimensional (1D), process-based, climate-sensitive lake biogeochemical model [Tan et al 2015] with data of lake and permafrost distribution to estimate CH4 emissions and their temporal and spatial variations from lakes in the north of 60°N. Additionally, two model experiments driven with CMIP5 RCP2.6 and RCP8.5 scenarios [Taylor et al 2012] were also conducted to project the change of this CH4 source during the 21st century.
2. Methods
The 1D, process-based, climate-sensitive, lake biogeochemical model (bLake4Me) consists of a water thermal module (WTM), a sediment thermal module (STM), a sediment gas module (SGM), a bubble transport module (BTM), and a dissolved gas transport module (GTM) [Tan et al 2015]. In the bLake4Me model, CH4 is produced via anaerobic decomposition of organic carbon in sediments (methanogenesis) and consumed by aerobic reactions in the oxygenated water column (methanotrophy). The production and oxidation rates of CH4 at each water and sediment layer are modeled as functions of substrate availability and temperature. Within each layer of water and sediment columns, temperature and dissolved gas concentrations (CH4 and N2 in sediments; N2, O2, CO2 and CH4 in water) are calculated by solving 1D thermal and gas diffusion equations. The water phase change in both columns is driven by heat gain/loss, with air at the top and with permafrost at the bottom. As soon as the total pressure of CH4 and N2 in a sediment layer exceeds 40% of the hydrostatic pressure [Stepanenko et al 2011], bubbles could form, travel through sediments, and escape into the water column. For lakes underlain by a thick Pleistocene-aged, organic-rich, silty ice complex ('yedoma lake'), methanogens are fed by both younger 14C-enriched organic carbon at surface sediments and older 14C-depleted organic carbon at deep sediments [Zimov et al 1997, Walter et al 2006, 2008]. In contrast, for non-yedoma lakes, CH4 is produced through organic carbon decomposition from a single 14C-enriched organic carbon pool [Walter et al 2006, 2008]. In the thermokarst margin zones of yedoma lakes, bubbles from sediments join together to release CH4 with a consistently high flux, which is referred to as hotspot ebullition [Walter et al 2008]. In non-thermokarst zones of yedoma lakes and all areas of non-yedoma lakes, bubbles are formed from shallow sediments with a large amount of recalcitrant carbon, and bubbling rates are low with spatially homogeneous distribution, which is referred to as background ebullition [Walter et al 2008]. For bubbles moving at the water column, gas concentrations are determined by air pressure, bubble position and diameter, and ambient dissolved gas concentrations [Liang et al 2011]. The detailed model description and methods are documented in Tan et al (2015). The model has been validated using lake temperature, dissolved CH4 concentration, and CH4 flux observations from five arctic lakes (northern Siberia: Shuchi and Tube Dispenser Lakes; Alaska: Goldstream, Claudi and Toolik Lakes) [Tan et al 2015]. To apply it to regional simulations, we have constructed the thickness of water layers for different lakes with different schemes: (1) for very shallow lakes less than 0.5 m deep, each layer has a uniform 2 cm thickness; (2) for shallow lakes less than 5 m deep, each layer has a uniform 10 cm thickness; (3) for other lakes, the number of water layers is fixed at 50 and layer thickness increases exponentially from the lake surface to the bottom. The total thickness of soil layers, including thawed talik and frozen permafrost, is fixed at 25 m, the average depth of yedoma permafrost [Tarnocai et al 2009]. Unlike Tan et al (2015) who only used the observed CH4 fluxes from Shuchi Lake to calibrate the model parameters related to the 14C-enriched and 14C-depleted carbon pools, the optimum parameters in this work are evaluated by minimizing the difference of the observed and modeled CH4 fluxes at all five lakes with a Bayesian recursive parameter estimation method [Tang and Zhuang 2009, Thiemann et al 2001].
Regional simulation with the bLake4Me model is shown in figure 1. For each lake pixel, we run the bLake4Me model separately using the data of lake surface boundary layer conditions (air temperature, dew point temperature, air pressure, wind speed, snow fall and rain fall), lake depth, catchment soil organic carbon (SOC) density, thermokarst status (active or inactive), and yedoma status (yedoma or non-yedoma) [Tan et al 2015]. As described by Tan et al (2015), climate data was derived by interpolation from a 0.75° × 0.75° resolution dataset of the European Center for Medium-Range Weather Forecasts (ECMWF) Interim re-analysis (ERA-Interim) [Dee and Uppala 2009]. The catchment SOC for lakes underlain by permafrost was extracted from a 0.05° × 0.05° resolution static SOC map of the Northern Circumpolar Soil Carbon Database version 2 (NCSCDv2) [Hugelius et al 2013] and for lakes within permafrost-free zones from a 30 arc-second resolution Harmonized World Soil Database version 1.2 (HWSD v1.2) [FAO/IIASA/ISRIC/ISSCAS/JRC 2012]. The distribution and depth of arctic lakes were both extracted from a 30 arc-second resolution Global Lake Database (GLDB) [Kourzeneva et al 2012], in which lake coverage was derived from ECOCLIMAP2 and lake depth was collected from the ETOPO1 bathymetry dataset, the digitizing of graphic bathymetry maps, Kourzeneva's personal communications and Wikipedia [Kourzeneva et al 2012]. Another widely used lake coverage dataset is the Global Lakes and Wetlands Database [Lehner and Döll 2004], which is also 30 arc-seconds in resolution but does not provide depth information. The total area of arctic lakes (approximately 5.8429 × 10⁵ km2) in GLWD is about 5.96% lower than that in GLDB. The lake areas of major arctic regions are shown in table 1. Since the pixels of this high-resolution dataset are less than 0.5 km2 in high latitudes, it is feasible to deal with each lake pixel independently with homogenous bathymetry. We assigned a default depth of 3 meters to all lake pixels where depth information is unavailable in GLDB, as Benoy et al (2007) suggested that the maximum depth of arctic lakes is usually less than 3 meters. Using this default value might introduce errors to our estimates because Brewer (1958) showed that arctic thaw lakes fall into two depth classes of 0.6–0.9 m and 1.8–2.7 m and shallow waters usually have higher CH4 fluxes [Bastviken et al 2004, Walter et al 2006, Wik et al 2013]. In addition, we treated any lake pixel in GLDB as a lake marginal zone if it connected with land pixels. The distribution of yedoma lakes was determined by overlaying the GLDB map to the geospatial map of Late Pleistocene Ice-Rich Syngenetic Permafrost of the Yedoma Suite in East and Central Siberia and North America [Wolfe et al 2009, Grosse et al 2013]. We selected 90% of the lakes in the permafrost zone randomly as thermokarst-active lakes [Walter et al 2007] for model simulations. The distribution of permafrost was extracted from a 12.5 km resolution Circum-Arctic permafrost and ground ice map [Brown et al 2002].

Figure 1. A schematic of regional simulation with the bLake4Me model: black point indicates lake pixels; 'WTM' is the water thermal module; 'STM' is the sediment thermal module; 'SGM' is the sediment gas module; 'GTM' is the gas transport module; 'BTM' is the bubble transport module.
Download figure:
Standard image High-resolution imageTable 1. The total CH4 fluxes (units: Tg CH4 yr−1) from lakes in the north of 60 °N. The present-day CH4 fluxes are the average of simulations from 2005 to 2008. The future CH4 fluxes are the average of simulations from 2096 to 2099.
| Name | Range | Lake area (km2) | Lake area: land area | Present-day CH4 fluxes | Future CH4 fluxes under RCP 2.6 | Future CH4 fluxes under RCP 8.5 |
|---|---|---|---|---|---|---|
| Whole Arctic | 180°W–180°E | 6.2135 × 10⁵ | 4.26% | 11.86 | 22.19 | 28.06 |
| Alaska | 170°W–140°W | 3.0155 × 10⁴ | 2.41% | 1.22 | 1.85 | 2.36 |
| Northern Canada | 140°W–60°W | 3.1452 × 10⁵ | 8.74% | 5.02 | 11.00 | 14.46 |
| Northern Europe | 0°E–60°E | 1.2917 × 10⁵ | 5.94% | 0.60 | 1.38 | 1.80 |
| Northern Siberia | 60°E–180°E | 1.3976 × 10⁵ | 1.96% | 4.96 | 7.81 | 9.23 |
To estimate CH4 fluxes from arctic lakes in the period of 2005–2008, we first made a spin-up run of the model from 1990 to 2004 to construct the thermal and carbon pool initial states for arctic lakes. As described by Tan et al (2015), the organic carbon density of yedoma permafrost is set as 29.3 kg m−3 and the bottom water temperatures of yedoma lakes and non-yedoma lakes are set as 3 °C and 4 °C, respectively, at the start of the spin-up run. Both the spin-up run and the run in the period of 2005–2008 were driven by the ECMWF climate data. To assess the response of this CH4 source to future climate changes, we conducted two prognostic runs driven with climate data of the Coupled Model Intercomparison Project Phase 5 (CMIP5) RCP2.6 and RCP8.5 scenarios [Taylor et al 2012; table S1]. Following the approach taken by Hay et al (2000), we applied a delta-ratio bias-correction method based on the ECMWF climatology data in the 2000–2009 period and an inverse-square distance interpolation to correct the CMIP5 data. With the correction, the CMIP5 data was downscaled to a finer 0.75° × 0.75° resolution, and its mean climate during 2006 and 2009 is consistent with the ECMWF climatology.
3. Results and discussion
As shown in figure 2(a), lakes in the zones of permafrost, especially yedoma permafrost, have high CH4 emissions, e.g., in the Indigirka-Kolyma Lowlands of Russia, Seward Peninsula of Alaska and Mackenzie River delta of Canada, because the thawing carbon-rich permafrost at the margins of arctic lakes fuels CH4 production [Walter et al 2006, 2007, Walter Anthony et al 2012, Walter Anthony and Anthony 2013]. The mean daily emissions of lakes in Alaska and northern Siberia are 110.8 and 97.2 mg CH4 m−2 day−1, respectively, the highest in the arctic. Our estimate for northern Siberia is much higher than the measured daily flux (68.2 mg CH4 m−2 day−1) from several Siberian thaw lakes when aggregated to total lake area, but lower than that observed from the 15 m wide active thermokarst band (350.6 mg CH4 m−2 day−1) [Walter et al 2006]. There are two possible reasons for these differences. First, because many yedoma lakes are assigned by default a 3 meter depth and the area of thermokarst margins is hard to define, CH4 emissions from the central zones of yedoma lakes are thus probably overestimated. Second, other yedoma lakes in northern Siberia could be younger and shallower than the studied lakes by Walter et al (2006), thus emitting CH4 at different rates between observations and simulations. For Alaska, the estimate agrees with the observed fluxes from three Alaskan lakes (87 ± 25 mg CH4 m−2 day−1) [Walter Anthony and Anthony 2013]. The stronger CH4 emissions from Alaskan lakes imply that the relative abundance of yedoma thermokarst lakes in Alaska is higher, though the area of aeolian yedoma depositions is larger in Siberia [Wolfe et al 2009, Grosse et al 2013]. CH4 emissions from lakes in northern Europe are the lowest, only 12.73 mg CH4 m−2 day−1. The low emission rates of lakes in northern Europe were also confirmed by an investigation on three lakes located in northern Sweden. The observed CH4 emissions from those lakes were as small as 13.4 mg CH4 m−2 day−1 [Wik et al 2013]. Due to the extensive distribution of thermokarst lakes [Brosius et al 2012], the simulated CH4 emissions from lakes in northern Canada are, on average, about 43.73 mg CH4 m−2 day−1, higher than the value of northern Europe.
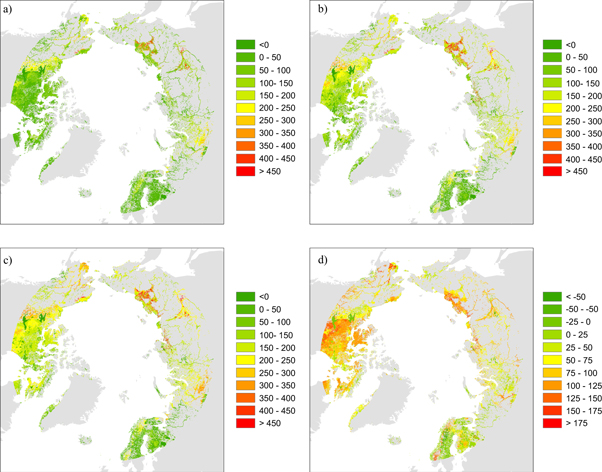
Figure 2. Distribution of CH4 emissions from arctic lakes (units: mg CH4 m−2 day−1). (a) CH4 emissions averaged from 2005 to 2008, (b) CH4 emissions averaged from 2096 to 2099 (RCP 2.6), (c) CH4 emissions averaged from 2096 to 2099 (RCP 8.5), and (d) the difference of future and present CH4 emissions.
Download figure:
Standard image High-resolution imageIn total, mean annual CH4 fluxes from all lakes in the arctic during 2005 and 2008 are 11.86 Tg CH4 yr−1, which is in the range of 7.1 to 17.3 Tg CH4 yr−1 estimated by Bastviken et al (2011), but lower than a recent first-order estimate of CH4 emissions from pan-arctic lakes (24.2 ± 10.5 Tg CH4 yr−1) [Walter et al 2007]. The modeled outgassing is equal to nearly one third of CH4 emissions from northern high-latitude wetlands (north of 45 °N) [Zhuang et al 2004, Chen and Prinn 2006, Riley et al 2011]. For the lakes of Alaska, northern Canada, northern Europe and northern Siberia, annual CH4 fluxes from 2005 to 2008 are 1.22 Tg CH4 yr−1, 5.02 Tg CH4 yr−1, 0.6 Tg CH4 yr−1 and 4.96 Tg CH4 yr−1, respectively (table 1). The larger emissions from northern Canada and northern Siberia can be attributed to two factors: (1) when measured by surface area, over 50% of arctic lakes are located in northern Canada (table 1), many of which are thermokarst lakes [Brosius et al 2012]; (2) due to the widespread distribution of ice-rich yedoma depositions, most yedoma lakes are located in the Beringian area of northern Siberia [Walter et al 2006, Strauss et al 2013]. For Alaskan lakes, our model estimates a lower CH4 emission than that of Walter Anthony et al (2012) (1.5–2 Tg CH4 yr−1). However, the addition of this CH4 evasion to the regional CH4 budget could still increase the present estimate of natural CH4 emissions from Alaskan wetlands (approximately 3 Tg CH4 yr−1 by Zhuang et al 2007) by 35%. Compared to the estimate (3.8 Tg CH4 yr−1) of Walter et al (2006), the simulated CH4 emissions from lakes in northern Siberia are larger. This discrepancy could be caused by two reasons: (1) our estimate includes CH4 emissions from non-yedoma thermokarst lakes and non-thermokarst lakes in northern Siberia, which were not considered by Walter et al (2006); and (2) as illustrated, the modeled mean daily CH4 emissions are much higher than the value used by Walter et al (2006). Using the average surface flux values from subarctic and arctic ponds, Laurion et al (2010) estimated annual diffusive flux from Canadian permafrost thaw ponds of 1.0 Tg CH4. Because diffusive flux is regarded as inferior to ebullition flux in transporting lake CH4 [Bastviken et al 2011], our modeled CH4 emissions of 5.02 Tg yr−1 from northern Canadian lakes is possible. However, as ground ice, land topography and drainage systems [McGuire 2013] are not included in this study to constrain the distribution of thaw lakes, the modeled thaw lakes and thus CH4 emissions in northern Canada could be overestimated.
Driven with CMIP5 RCP2.6 and RCP8.5 climate scenarios, the model estimated that CH4 emissions from arctic lakes could increase by 10.3–16.2 Tg CH4 yr−1 by the end of the 21st century when the evolution of lake landscape is not considered (table 1). Using the found strong correlations between seasonal energy input and CH4 bubbling in northern lakes, Thornton et al (2015) predicted that the seasonal average lake CH4 ebullition will increase by about 70% between the 2005–2010 period and the 2075–2079 period, a comparable magnitude to this study. Without using process-based biogeochemical models, Gao et al (2013) estimated a range of emission increases of 1.1–3 Tg CH4 yr−1 for all lakes north of 45°N. The low estimates of Gao et al (2013) were mainly caused by their extremely conservative calculations for the present-day CH4 emissions from boreal and arctic lakes (about 4 Tg CH4 yr−1). This large difference underscores the importance of using process-based biogeochemical models to address the nonlinearity of the response of future CH4 emissions to a changing climate. Given that previous studies suggested that the area change of arctic lakes would be, at most, 50% [van Huissteden et al 2011, Gao et al 2013], our estimated future emissions of 28.06 Tg CH4 yr−1 might be reasonable, which will not exert a large positive feedback to the global climate system. Spatially, as shown in figure 2, except for very large or deep arctic lakes, CH4 emissions from lakes across the arctic could rise due to energy input. CH4 emissions from lakes are projected to increase more in northern Europe (by 1.3 and 2.0 times) and northern Canada (by 1.2 and 1.9 times). Their higher increases could be caused by the inclusion of very shallow lakes (less than 0.5 m in depth) in GLDB. For shallow lakes, the response of sediment temperature to global warming is strong. In contrast, for yedoma lakes, as the mobilized labile carbon is usually in deep sediments, the climate warming will take a much longer time to affect CH4 production. Consequently, the estimated CH4 emissions from lakes in Alaska and northern Siberia increased less prominently.
Figure 3 shows the mean annual cycles of CH4 emissions from lakes in (a) Alaska, (b) northern Canada, (c) northern Europe, and (d) northern Siberia from 2005 to 2008 and from 2096 to 2099. Basically, the monthly CH4 fluxes from arctic lakes follow the variations of boundary conditions (figure 4 and supplement information (SI) available at stacks.iop.org/ERL/10/054016/mmedia): (1) CH4 emissions are much higher in summer than in winter; and (2) the peak of CH4 emissions occurs in August when the heat wave reaches surface sediments [Tan et al 2015]. These annual cycles are consistent with the claim that energy input is a primary control of CH4 bubbling in subarctic lakes [Wik et al 2014]. As the water convection associated with hotspot bubbling events could prevent ice from freezing when air temperature is higher than −15 °C and CH4 continues to be emitted from open holes at the thermokarst margin zones of yedoma lakes [Zimov et al 2001, Walter et al 2006, 2008], CH4 emissions from lakes in Alaska and northern Siberia are above zero in winter. Meanwhile, in yedoma lakes, with heat transporting from surface sediments to labile-carbon rich deep sediments, CH4 emissions from Alaska and northern Siberia do not decline in winter and even rise slightly in early spring (figures 3(a) and (d)). In contrast, as low-rate ebullition from non-yedoma lakes could be trapped in frozen water layers, the simulated CH4 fluxes from lakes in northern Canada and Europe drop to almost zero from November to March. When lake ice is totally melted in the late spring, bubbles trapped in ice layers through background and point-source ebullition (originating from the 14C-depleted carbon pool) are released quickly, producing the steepest CH4 emission increase (e.g., in April for northern Europe and in May for northern Canada) as shown in figures 3 and 4. Because northern Europe is much warmer than other arctic regions in winter (SI available at stacks.iop.org/ERL/10/054016/mmedia), the lake ice there is thinner and less persistent (figure 4). Our model simulations for the 21st century show that, with the warming of arctic lakes, the number of days when lakes are covered by ice will be greatly reduced. Consequently, CH4 can be emitted in early spring and even winter when lake ice has melted, as shown in figure 3. Compared to the difference between present-day and future simulations, the difference of CH4 emissions under the two future scenarios is less prominent, although the warming under RCP8.5 is much stronger (SI available at stacks.iop.org/ERL/10/054016/mmedia). In addition to the insulation effect of lake water, the minor difference can be explained by the fact that the current climate has changed the thermal equilibrium of the sediments of yedoma lakes and thus the mobilization of yedoma permafrost carbon persistently fuels methanogenesis.
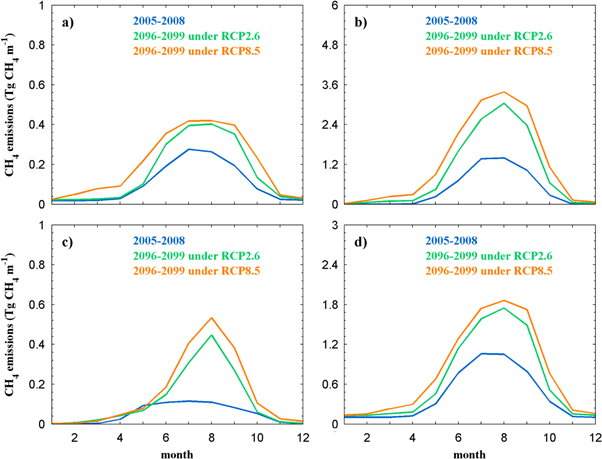
Figure 3. Mean annual cycles of CH4 emissions from arctic lakes for two time periods (2005–2008 and 2096–2099). (a) Alaska, (b) northern Canada, (c) northern Europe, and (d) northern Siberia. There are different scales on the Y-axes.
Download figure:
Standard image High-resolution image
Figure 4. Mean annual cycles of lake ice thickness for the period of 2005 to 2008 in the arctic. 'Maximum Ice' (solid lines) and 'Minimum Ice' (dashed lines) are defined as the maximum and minimum ice thickness of a lake in each month, respectively. Data have been weighted by lake area. There are different scales on the Y-axes.
Download figure:
Standard image High-resolution image
The accuracy of our estimates is limited by the reliability of data sources, the uncertainty of carbon pool sizes, and the absence of important landscape evolution processes. We find that the lake area in GLDB is 5% higher than that in GLWD. Similar to GLWD, GLDB might have missed small lakes with an area much less than 1 km2 [Lehner and Döll 2004, Kourzeneva et al 2012]. As illustrated, the lack of detailed lake bathymetry in GLDB could contribute to the discrepancy between model simulations and observations. Further, in GLDB, there are a large number of lakes without a mapped depth (about 4.75 × 10⁵ km2 as arctic lakes), especially in Alaska, northern Canada and northern Siberia. In the bLake4Me model, due to the lack of methods to model the linkage of the 14C-enriched organic carbon pool to runoff, ground water and catchment and in-lake productivity, the pool size is only modeled as a function of lake shape, catchment SOC, thermokarst erosion and dissolved oxygen level [Tan et al 2015]. This oversimplification could affect the reliability of applying the parameters derived from site-level studies [Tan et al 2015] to regional simulations. Another limitation of our estimates is the lack of calculating the change of CH4 emissions due to landscape evolution, such as the expansion and drainage of thermokarst lakes within the zones of thawing permafrost. As shown by van Huissteden et al (2011) and Gao et al (2013), CH4 emissions from the newly formed areas of arctic lakes under warming conditions could be significant.
4. Conclusion
We used a process-based, climate-sensitive, lake biogeochemical model with geographical soil and climate data to estimate CH4 emissions from arctic lakes from 2005 to 2008 and from 2096 to 2099. The mean annual CH4 emissions from arctic lakes are 11.86 Tg CH4 yr−1 during 2005–2008. This estimate is nearly one third of the wetland CH4 emissions in northern high latitudes. CH4 emissions are the highest in the lakes of Alaska and northern Siberia, due to the extensive distribution of carbon-rich yedoma permafrost. By the end of the 21st century, without considering the change of lake areas, CH4 emissions from arctic lakes could increase to 22.19 Tg CH4 yr−1 under a weak warming scenario (RCP2.6) and 28.06 Tg CH4 yr−1 under a strong warming scenario (RCP8.5). Model simulations show that the increase of CH4 emissions from arctic lakes will not cease immediately when global warming is reduced. Our study suggests that the feedback between the global climate system and arctic freshwater CH4 emissions should not be neglected in earth system models.
Acknowledgments
The authors are thankful to two anonymous reviewers for their valuable and constructive comments, which have led to a significant improvement to the study. The authors also acknowledge the World Climate Research Programme's Working Group on Coupled Modeling, which is responsible for CMIP, for producing and making available their model output. For CMIP, the US Department of Energy's Program for Climate Model Diagnosis and Intercomparison provides coordinating support and led development of the software infrastructure in partnership with the Global Organization for Earth System Science Portals. The research is funded by a DOE SciDAC project and an Abrupt Climate Change project. This study is also supported through projects funded by the NASA Land Use and Land Cover Change program (NASA-NNX09AI26G), Department of Energy (DE-FG02-08ER64599), the NSF Division of Information and Intelligent Systems (NSF-1028291), and the NSF Carbon and Water in the Earth Program (NSF-0630319). This research is also in part supported by the Director, Office of Science, Office of Biological and Environmental Research of the US Department of Energy under Contract No. DE-AC02-05CH11231 as part of their Earth System Modeling Program. The supercomputing resource is provided by Rosen Center for Advanced Computing at Purdue University.