

Abstract
Recent years (i.e., 2007–2014) have exhibited large declines in snow cover extent (SCE) in the Northern Hemisphere (NH), marked by earlier snowmelt in the springtime. In Northern latitudes, the snow-albedo feedback (SAF) is most pronounced in the spring and may be contributing to these decreasing trends in SCE. Rising surface air temperatures and changes in precipitation patterns could also vary the declining trends in SCE depending on latitude and elevation. Previous trend analyses of NH SCE are extended here to cover the period 1 October 1971 to 30 September 2014 using observed data from the National Oceanic and Atmospheric Administration snow chart climate data record. Trends in snow coverage (significant when p < 0.05) with latitude and elevation are investigated using the Mann–Kendall test. Over the 43 year period, strong polar amplification of negative trends in snow cover are observed. The majority of statistically significant negative trends are found in the mid- to high-latitudes, reaching a maximum reduction at 75.5°N. There is also elevation dependence of SCE over time as statistically significant negative trends occur at most elevations, with the strongest observed at 3950 m a.s.l. These significant negative trends exhibited in the mid- to high-latitudes and mid- to high-elevations provide evidence of polar amplification and elevation dependence of trends in snow cover in a warming climate, suggesting a leading role of the SAF on the recent retreat of NH snow cover.
Export citation and abstract BibTeX RIS

Content from this work may be used under the terms of the Creative Commons Attribution 3.0 licence. Any further distribution of this work must maintain attribution to the author(s) and the title of the work, journal citation and DOI.
1. Introduction
Increasing concentrations of greenhouse gases in the atmosphere are causing a global increase in surface air temperatures (IPCC 2013). Déry and Brown (2007) determined the springtime snow-albedo feedback (SAF) (along with the ice-albedo feedback) to be the leading cause of amplified warming in the Northern Hemisphere (NH), where snow cover is particularly sensitive to rising air temperatures. However, some climate model studies have shown that the SAF may not be the main contributor to polar amplification as warming may occur without any changes to snow and ice (e.g., Hall 2004, Graversen and Wang 2009, Pithan and Mauritsen 2014). Atmospheric warming affects precipitation mechanisms, which are influenced by air temperature, surface fluxes, moisture advection, cloud microphysical processes, stability and orographic lifting of air masses. Precipitation increases occur in a warmer atmosphere that carries more water vapor and with efficient precipitation-generating mechanisms, such as convergence and uplift (Callaghan et al 2011). A climate change of increasing temperature and precipitation leads to a complex snow cover response that varies depending on climate regime and elevation (Brown and Mote 2009). Climate change is expected not only to warm air temperatures, but also increase winter precipitation in the NH's mid- to high-latitudes. Räisänen (2008) suggests that in regions where winters are mild, a modest increase in air temperature will convert part of the snowfall into rainfall, thus increasing the frequency and intensity of melting episodes.
One of several important effects of the NH cryosphere on the climate system is the strong influence that snow cover has on positive albedo feedbacks (e.g., Groisman et al 1994, Flanner et al 2011). Snow cover is largely confined to the Arctic in spring and positive albedo feedbacks impart a stronger signal on snow cover duration (SCD) in particular, as feedback potential increases with latitude (Déry and Brown 2007, Derksen and Brown 2012). SAFs to air temperature are more important in spring because high net radiation is coupled with thin snow cover and thus positive air temperature anomalies correlate to earlier snowmelt (Peng et al 2013) and enhanced soil thawing (Park et al 2012). Studies report that rising air temperatures have contributed to substantial spring snow cover extent (SCE) retreat and earlier snowmelt leading to decreased SCD in the NH (Brown and Robinson 2011, Derksen and Brown 2012, Peng et al 2013). Brown et al (2010) reported linear decreases in spring SCE (14% in May and 46% in June), where variance is predominantly correlated to air temperature (i.e., 49% in May and 56% in June) as the winter Arctic Oscillation explains only 21% of the variance in May. Furthermore, surface net radiation changes driven by increasing air temperatures, decreasing snow surface albedoes, and increasing atmospheric water vapor pressures has decreased late spring and early summer snow cover in North America (NA) and Eurasia (EU) (Derksen and Brown 2012, Shi et al 2013).
The main objective of this study is to update the January 1972 to December 2006 trends in NH SCE presented in Déry and Brown (2007) to include data from 1 October 1971 to 30 September 2014 from the Rutgers University Global Snow Lab (RUGSL) and examine the effect of latitude and elevation on observed trends of weekly NH SCE for this 43 year study period. The trends in spatial distribution and temporal coverage of NH SCE are investigated by applying monotonic trend analyses to climatologies of SCE according to latitude and elevation, and employing the Mann–Kendall test (MKT) to examine latitudinal and elevational variations in the presence of snow. Insolation-weighted SCE trends will be explored to establish potential links between SAF and observed changes in SCE (Pielke et al 2000). Thus this study aims to address the following research questions: (1) Have the negative trends in NH SCE changed since 2006?; (2) How do the strength of SCE trends in the RUGSL time series vary seasonally?; and (3) Is there latitudinal and elevational dependence of snow cover changes over time and what are the potential impacts to the surface radiation budget?
2. Data and methods
This study focuses on the NH, but results are also provided at the continental-scale (EU and NA excluding Greenland). We employ the National Oceanic and Atmospheric Administration (NOAA) weekly snow chart data record (Brown and Robinson 2011) maintained, quality-controlled, and housed at RUGSL (http://climate.rutgers.edu/snowcover/). This long-term NH SCE dataset is a contribution to NOAA's Climate Data Record (CDR) program and is widely used by the climate community for investigating snow cover trends and variability (Estilow et al 2014). The NOAA dataset consists of weekly snow charts from 1967 to 1999 digitized onto a 89 × 89 cell grid laid over a 190 km polar stereographic projection of the NH, with cell resolution ranging from 16 000 to 42 000 km2 (Robinson et al 1993). A 50% threshold is used to determine snow presence and absence in each grid cell; thus a binary value of 1 indicates snow presence and 0 denotes snow absence.
In May 1999, the charting method changed to the 24 km resolution daily Interactive Multi-Sensor (IMS) snow cover product (Ramsay 1998), which was further updated and described by Helfrich et al (2007). The resultant daily IMS automatically derives a pseudo-weekly product that takes into account the Sunday analysis representative of the previous week. The spring and summer SCE over the Arctic and Northern Canada are sometimes overestimated due to low illumination when the solar zenith angle is high, the impact of cloud cover, and potential analysis confusion between ice covered lakes and a snow-free land surface (Wang et al 2005, Brown et al 2007, Déry and Brown 2007). Indeed, Brown et al (2010) determined that the NOAA dataset overestimates June Arctic SCE by 1–2 × 10⁶ km2 compared to other independent datasets. Despite this bias in June, spring season anomalies in SCE were consistent with the independent datasets, thus making the NOAA record reliable for studies deriving trends and investigating spring snow cover variability at the continental-scale. Of greater concern are inconsistencies in the direction of SCE trends in the NOAA CDR compared to independent datasets in October (Brown and Derksen 2013). Further discussion of this issue is provided in section 3. A full intercomparison of the NOAA record with independent SCE datasets over the complete annual cycle has not previously been conducted, and is beyond the scope of this study. We refer readers to Brown et al (2010), Brown and Robinson (2011), and Brown and Derksen (2013) for seasonally-focused dataset inter-assessments and discussions of uncertainties.
Weekly SCE values from 1 October 1971 to 30 September 2014 were extracted to investigate temporal and spatial trends in latitude and elevation. Missing snow charts from 1967 to 1971 restrict the study period to post-September 1971 (Robinson 2000). The analyses include NOAA weekly SCE at the continental scale for EU, NA, and the entire NH. A Greenland mask was applied to eliminate perennial snow cover and spurious latitudinal and elevation trends North of 80°N. Some land points located outside of Greenland near 80°N may contain a combination of nearly permanent snow or ice but were not masked from the present study. The analyses conducted in this study employed the NOAA land mask developed by RUGSL for the NH, in addition to a mask provided by Ross Brown (2013) that eliminates 33 grid cells that contain inhomogeneity in SCE values likely due to resolution induced shifts in land/sea masking and elevation effects (see supplementary table S1 available at stacks.iop.org/ERL/10/044010/mmedia). The elevation mask and mean sea level information for the land points over the 4 min averaged ETOPO2 values contained within the NOAA weekly snow grid was provided by Ross Brown (2013).
The MKT is a robust and non-parametric method to assess trends in a given quantity that remains insensitive to outliers (Mann 1945, Kendall 1975, Déry et al 2005, Wilks 2011). In this study, it is employed to investigate monotonic trends in weekly SCE (statistically significant when p < 0.05) for the period 1 October 1971 to 30 September 2014. Consideration of possible serial correlation effects on the trends is incorporated in the methodology by 'pre-whitening' the time series of SCE following Yue et al (2002). Monotonic trends are expressed as absolute values in SCE (×106 km2), percentage change from initial values, standardized units over the study period, and insolation-weighted anomalies to assess the potential influence of the SAF on observed trends of SCE. The standardized weekly SCE anomalies  for the 43 year period of record are computed from

where χ is the weekly SCE at year i, and where the overall 43 year mean and standard deviation in weekly SCE are denoted by  and σi, respectively. The insolation-weighted anomalies are computed following Pielke et al (2000), where the absolute SCE values are multiplied by the ratio of the weekly average and annual maximum incoming solar radiation at 60°N. Thus the maximum influence of snow on the surface radiation budget is represented by the insolation-weighted values as they do not encompass the effects of cloud cover and most surface types under the snowpack, except for vegetation over the snowpack.
The climatology of snow on the ground was determined for latitudinal bands of 1°N to isolate trends in SCE as a function of latitude from 1 October 1971 to 30 September 2014. For the climatological analysis, we summed the number of times a point falling into one band of latitude had snow over the entire study period and then divided this by the number of available times over the entire study period. Annual latitudinal trends in snow coverage (significant when p < 0.05) for each 1° band of latitude were determined using the MKT. For each band we compute trends in the fraction of time that it is snow covered, plot trends in the total area of snow cover, and assess the radiation potential (RP) over the study period. We follow equation (2) to determine the trend in solar RP over a flat surface by computing the mean daily potential incoming solar radiation (K↓) for each one degree latitudinal band for each week of the year. The resulting value is then divided by the NH overall maximum weekly mean potential incoming solar radiation (K↓max), which is 525.6 W m−2 centered on the summer solstice at 89–90°N. A summation was performed over the year with the solar RP multiplied by a factor Si = 0 in the presence of snow or Si = 1 if there is no snow, with the subscript i denoting a given week as follows

The presence of snow over the entire study period was stratified according to 100 m elevation bands ranging from 0 to 5500 m a.s.l. to investigate the influence of elevation on SCE trends. The MKT is used to explore annual trends (significant when p < 0.05) in the fraction of time that each elevation band is snow-covered over the study period.
3. Results
The 1 October 1971 to 30 September 2014 climatology of snow on the ground by latitudinal bands of 1°N shows a nearly linear increase in snow coverage with latitude (figure 1(a)). All of the land points above 79.5°N (n = 7) are likely to be subject to some land ice fraction and not just snow cover. This is related to most of the land at this latitude being at elevations where it is permanently snow covered, i.e., on glaciers/icefields, thus being classified as snow in the RUGSL database. In addition, there is extensive spatial coverage of each latitudinal band and a latitudinal pattern in the total area of snow-covered land points within a band where the majority of the points are found in the mid- to high-latitudes (figure 1(b)). The climatology of SCE according to elevation shows that the largest fractions of SCE occur at elevations >2000 m a.s.l., reaching a maximum at 4250 m a.s.l. (figure 2(a)). Low elevations (i.e., <500 m a.s.l.) have the most snow-free land extent, whereas high elevations have less land extent but greater snow cover presence (e.g., 57% at 3950 m a.s.l. and 71% at 4250 m a.s.l.) (figure 2(b)).

Figure 1. (a) Fraction of SCE over the entire seasonal cycle and (b) land extent and total area of snow covered land points within one degree latitudinal bands from 1 October 1971 to 30 September 2014. In (a) the solid red line indicates the linear regression over 22.5–79.5°N and results end at 80°N due to minimal land area between 80 and 90°N.
Download figure:
Standard image High-resolution image
Figure 2. (a) Fraction of SCE and the (b) land extent and total area of snow covered land points (gray) for each 100 m elevation band from 1 October 1971 to 30 September 2014.
Download figure:
Standard image High-resolution imageEU and NA spring SCE trends are strongly negative over the 43 year study period (figure 3(a)). Statistically significant trends in the absolute values of SCE persist from late March to mid-June for the NH, from early March and then from late March to mid-June for EU, and from late April to mid-June for NA. Even though there are statistically significant trends in July and August, they are unreliable because sensitivity to uncertainties due to snow charting procedures are amplified in the summer (because of the very small SCE during summer months, only a small change in SCE can result in a large anomaly). The NH experiences the largest declines in SCE during mid-June, consistent with Derksen and Brown (2012).
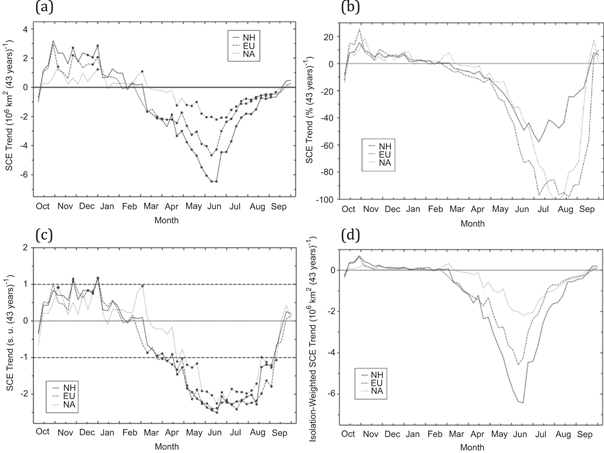
Figure 3. Weekly SCE monotonic trends for the NH, EU, and NA expressed in terms of (a) absolute SCE values (×106 km2), (b) percentage change from their initial values, (c) standardized units (s.u.), and (d) insolation-weighted anomalies from 1 October 1971 to 30 September 2014. Statistically significant (p < 0.05) trends are indicated with black circles.
Download figure:
Standard image High-resolution imageOnly November and December exhibit statistically significant positive trends for the NH, EU, and NA. A recent study by Cohen et al (2012) provides evidence for statistically significant increasing SCE trends during October in the NOAA data record over the period 1988–2010. However, an analysis by Brown and Derksen (2013) attributes these positive October SCE trends to the limited period selected from the available time series by Cohen et al (2012), and an internal positive trend found with four independent datasets. Of the five datasets examined by Brown and Derksen (2013) only the NOAA record contains a positive trend in October. In addition, the Arctic snow analysis of Liston and Hiemstra (2011), which was not included in the Brown and Derksen (2013) study, identifies a trend towards later snow cover onset in the fall. An analysis by Mudryk et al (2014) showed that October was the month with the largest discrepancy in SCE trends between the NOAA record and large ensembles of both coupled and uncoupled Community Earth System Model simulations. In light of these results, we suggest the fall trends in the NOAA record be interpreted and applied with caution.
Trends in standardized units of weekly SCE from EU and NA show a remarkable degree of similarity (figure 3(c)) with a significant correlation of r = 0.92 (p < 0.0001). Any trend above ±1 standardized units indicates a 'detectable' trend; hence two weeks in winter show detectable, positive trends in NH SCE while nearly all spring and summer negative trends are detectable (i.e., m < −1). Only weak trends are evident from January to March; however, the spring and summer months exhibit more pronounced trends with declines of up to 2.5 standardized units in NH SCE by mid-June. Temporal evolution of these trends extending from January to June is strongly linear in nature with the NH, EU, and NA exhibiting statistically significant (p < 0.0001) linear correlation coefficients of −0.98, −0.98, and −0.90, respectively.
Weekly insolation-weighted SCE trends are strongest during the summer solstice when the incoming solar radiation is highest in the NH (figure 3(d)). These findings indicate that the SCE trends in late spring and early summer have the greatest impact on the SAF and thus the surface radiation budget input to the atmosphere in the NH. The opposite is true for late fall and winter months when the impacts of any positive SCE trends are suppressed because incoming solar radiation is low.
Strong polar amplification of SCE trends are observed over the 43 year period, with their significance increasing at higher latitudes with the strongest trends between 61.5°N and 75.5°N (figure 4(a)). The negative SCE trends are greatest for regions that have the climatologically most persistent snow (figure 4(b)). The latitudinal trends are dependent on the total area of snow cover with the higher latitudes exhibiting statistically significant strong declines that peak at 68.5°N and become less pronounced further North, presumably because of the small land area (figure 4(c)). Over the 43 year period, strong polar amplification of statistically significant positive trends in the total solar RP for each latitudinal band is observed (figure 4(d)). Thus poleward declines in snow cover coincide with increased values of total solar RP, indicating a greater potential for absorption of incoming solar radiation at higher latitudes.

Figure 4. Trend in the (a) fraction of time that all land points are snow covered for each latitudinal band, (b) fraction of time that all land points are snow covered in relation to the climatological fraction of snow, (c) total area of snow cover for each latitudinal band, and (d) total solar radiation potential for each latitudinal band from 1 October 1971 to 30 September 2014. Large dots denote statistically significant trends (black = p < 0.05 and red = p < 0.01).
Download figure:
Standard image High-resolution imageFigure 5 shows some statistically significant negative trends in the fraction of the time during the year when an elevation band is snow-covered from 1550 to 2850 m a.s.l. in mid-latitude regions. At higher elevations there is a mix of negative and positive statistically significant trends, with the largest negative (positive) trend occurring at 3950 (4350) m a.s.l., illustrating that there may be a difference in snow cover response depending on elevation. Most of these mixed trends are found in central China along the Eastern border of the Tibetan Plateau, extending from the Mengduan Mountains in the South to the Qilian Mountains in the North. Other mixed trends are located in the Pamirs and Kunlun Mountains, and the Himalayas close to Mount Everest. The mixed trends may be related to higher elevations (i.e., >3250 m a.s.l.) having a fewer number of available grid points, thus small changes in SCE at these elevations may result in mixed trend anomalies (see figure 2(b)). Stratifying the data between 30 and 60°N and the Arctic shows some statistically significant negative trends up to 2050 m a.s.l. in mid-latitude regions with evidence of mixed positive and negative statistically significant trends at higher elevations from 3250 to 4650 m a.s.l. (see supplementary figure S1(a) available at stacks.iop.org/ERL/10/044010/mmedia). The Arctic region covering 60–90°N only exhibits small statistically significant decreasing trends in SCE at elevations up to 1450 m a.s.l., above that there are no data for most elevations (see supplementary figure S1(b) available at stacks.iop.org/ERL/10/044010/mmedia). Mid-latitudes (30–60°N) have a much larger elevation distribution ranging from 0 to 5270 m a.s.l at 35.5 °N in comparison to the smaller elevation distribution of the Arctic where a maximum elevation of 1500 m a.s.l. is reached at 72.5°N (see supplementary figure S2 available at stacks.iop.org/ERL/10/044010/mmedia). Thus, the mixed trends that are observed at elevations higher than 3250 m a.s.l. are found between 28.5 and 39.5°N where the elevation distribution between the land points is largest.
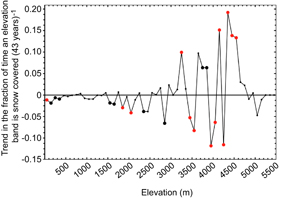
Figure 5. Trend in the SCE for each elevation band from 1 October 1971 to 30 September 2014. Large dots denote statistically significant trends (black = p < 0.05 and red = p < 0.01).
Download figure:
Standard image High-resolution image4. Concluding discussion
This study of the NH SCE covering 1 October 1971 to 30 September 2014 provides further evidence supporting significant declines in NH standardized spring SCE anomalies and polar amplification of trends previously reported. This conclusion is also consistent with the extensive 2008–2012 spring SCE reductions in May and June reported by Derksen and Brown (2012). From 2007 to 2014, the retreat of snow cover has accelerated with the strongest trends at high latitudes and in regions with the most frequent presence of snow. Figure 3(c) shows evidence of weak trends from January to March that are greatly amplified in the spring and summer when declines as high as 2.5 standardized units in NH SCE are observed in mid-June. The enhanced SAF over the NH plays a significant role in contributing to the poleward retreat of spring and early summer SCE. Of note, the greatest potential impacts to the surface radiation budget are at high latitudes (60–70°N) where the largest SCE declines are observed. There also appears to be a difference in SCE response depending on elevation, with elevations up to 2850 m a.s.l. characterized by negative trends, whereas mixed positive and negative statistically significant trends are observed at higher elevations with a maximum low (high) being reached at 3950 (4350) m a.s.l. in mid-latitude regions spanning 30–60°N. Moreover, the Arctic experiences small decreasing trends in snow cover at low elevations up to 1500 m a.s.l. These results provide further evidence of a polar amplification of SCE trends that exhibit dependence on latitude and elevation, with the SAF playing a significant role in the enhancement of these trends.
The retreat of snow cover has accelerated in recent years (i.e., 2007–2014); indeed the findings of the present study highlight much larger declining trends in SCE than those previously reported (from the same dataset) in Déry and Brown (2007). Figure 6 provides a comparison of the SCE trends from 1972 to 2006 (from Déry and Brown, 2007) with those from 1971 to 2014, which highlights the dramatic 2007 to 2014 retreat of spring SCE in the NH. The maximum reduction of −4.63 × 10⁶ km2 SCE occurs at the beginning of June for 1972–2006, whereas for 1971–2014 it occurs two weeks later in mid-June reaching a value of −6.46 × 10⁶ km2, corresponding to a 28.3% greater reduction in NH SCE (figure 6(a)). At a continental scale, the EU SCE trend for 1971–2014 has amplified in comparison to 1972–2006. The fall and winter months are relatively similar, but the SCE trends are much greater for 1971–2014 in the spring and early summer. A maximum reduction of −3.06 × 10⁶ km2 SCE and −4.66 × 10⁶ km2 SCE occur in mid-June for 1972–2006 and 1971–2014, respectively, corresponding to a 34.3% greater reduction from 2007 to 2014 (figure 6(b)). NA experiences similar SCE trends for 1971–2014 in the fall and winter months when compared to 1972–2006. There is a 20.8% mid-June reduction in the 1971–2014 NA SCE trend where a minimum of −2.21 × 10⁶ km2 SCE is reached compared to the 1972–2006 mid-June reduction of −1.75 × 10⁶ km2 SCE (figure 6(c)). Thus it is evident that EU is mostly responsible for driving the dramatic retreat of SCE in the NH from 2007 to 2014 due to the large differences in SCE trends in comparison to those experienced in NA.

Figure 6. Comparison between 1972–2006 and 1971–2014 trends in SCE for the (a) NH, (b) EU, and (c) NA. Large dots denote statistically significant (p < 0.05) trends.
Download figure:
Standard image High-resolution image
The current study also provides evidence of a more coherent SCE response over NA and EU (r = 0.92; p < 0.0001). In addition, it is evident that the NH, NA, and EU amplified trends extending from January to June increase in linear fashion with time (weaker trends early in winter; stronger trends late in spring) that is now stronger than previously reported.
Snow cover trends are significantly dependent on latitude, elevation, and the increasing spring solar radiation that can reinforce snow melting processes through augmentation of the SAF (Choi et al 2010). In particular, latitudinal trends in spring SCE are declining as a result of the enhanced SAF that is evident by the increases in total solar radiation. These findings are in accord with those of Déry and Brown (2007), where snow-albedo and ice-albedo feedbacks were determined to be the leading cause of amplified warming in the NH, contributing to the polar amplification of decreasing SCE trends during the spring months. Shi et al (2011) attributed changes in the pan-Arctic SCE primarily to warming atmospheric air temperatures that are augmenting surface net radiation (i.e., sum of net shortwave and downward longwave radiation). Foster et al (2013) report that observed warming spring air temperatures in recent decades correlate with the poleward retreat of spring snow cover that is occurring ∼4–7 days earlier in high latitudes, with snowmelt being slightly greater along coastal areas of the Arctic Ocean (70°N) than those further inland (60°N). Thus, there is a growing body of work that suggests the declining SCE trends observed in the NH coincide with enhanced SAF in the higher latitudes, especially between 60 and 70°N.
Comparison of our results with other datasets provides support for the robustness of decreasing trends in spring SCE. For instance, multi-data set estimates of Arctic spring SCE derived from ten data sources by Brown et al (2010) show significant SCE reductions in May and June (correlated to changes in air temperatures) consistent with the NOAA CDR (Derksen and Brown 2012). Furthermore, the results of this study are consistent with those presented by Estilow et al (2014) in showing modest increases in SCE during fall and winter followed by strong declining trends in SCE during spring and summer. We note again that unlike the decreasing spring trends, the positive SCE trends in fall are not reproduced in other SCE datasets. Analysis of four independent SCE datasets by Brown and Derksen (2013) provides evidence that the positive fall SCE trend in the NOAA CDR is due to an internal trend in the dataset. The underlying cause of this trend was not determined, but may be attributable to improvements in the quantity, quality, and resolution of satellite imagery available to NOAA analysts, and the challenges to snow charting posed by climatologically persistent autumn cloud cover over EU. We agree with the fall SCE trend conclusion reached by Brown and Derksen (2013) and recommend that further analysis be performed to (1) assess the source of uncertainties in fall SCE in the NOAA CDR compared to other independent SCE datasets and (2) produce corrected CDR fall season snow extent estimates for EU.
The decrease of −0.58 × 10⁶ km2 decade−1 in spring SCE over the period 1967–2014, provides further evidence that the NH is experiencing large reductions in springtime SCE that are particularly strong over the past decade (Estilow et al 2014). The earlier loss of spring snow cover in the NH is linked to the rise in surface air temperatures that are augmented by the SAF. Peng et al (2013) predict that the contribution of snow cover feedback to spring warming will be 0.10 °C (decade)−1. These spring air temperature increases will continue to have an impact on snow cover declines and thus may further advance the spring snow offset dates in the NH. In particular, projections show that the NH will experience a snow offset advance of 1.6–8.5 days by 2100 that may further amplify spring warming by 0.12–0.65 °C from an estimated 1.0–5.3 °C (Peng et al 2013). The snow analysis by Liston and Hiemstra (2011) indicates widespread changes in Arctic snow cover that they associate with increasing Arctic snow season temperatures, evident by the projected decreases in maximum winter snow water equivalent, late snow cover onset in autumn, earlier snow offset in spring, and decreases in SCD. Increases in surface and lower tropospheric air temperatures are the likely primary drivers of these cryospheric changes (Derksen et al 2012). Thus polar amplification of declining SCE trends will continue to affect the radiative balance of the NH induced by the SAF in the spring having a positive feedback on hemispheric warming.
Acknowledgments
Thanks to D A Robinson and T Estilow (Rutgers) for providing the NOAA weekly SCE data and ancillary data, and R Brown (Ouranos) for providing data (including elevation mask and mean sea level information for the land points, and unreliable grid points in the Rutgers University SCE dataset), as well as comments and assistance with this work, and two anonymous referees for their constructive comments. We acknowledge funding from the Natural Sciences and Engineering Research Council of Canada's Climate Change and Atmospheric Research initiative via the Canadian Sea Ice and Snow Evolution (CanSISE) Network and funding provided by the government of Canada's CRC program.