


Abstract
In adapting US agriculture to the climate of the 21st century, a key unknown is whether cropping frequency may increase, helping to offset projected negative yield impacts in major production regions. Combining daily weather data and crop phenology models, we find that cultivated area in the US suited to dryland winter wheat–soybeans, the most common double crop (DC) system, increased by up to 28% from 1988 to 2012. Changes in the observed distribution of DC area over the same period agree well with this suitability increase, evidence consistent with climate change playing a role in recent DC expansion in phenologically constrained states. We then apply the model to projections of future climate under the RCP45 and RCP85 scenarios and estimate an additional 126–239% increase, respectively, in DC area. Sensitivity tests reveal that in most instances, increases in mean temperature are more important than delays in fall freeze in driving increased DC suitability. The results suggest that climate change will relieve phenological constraints on wheat–soy DC systems over much of the United States, though it should be recognized that impacts on corn and soybean yields in this region are expected to be negative and larger in magnitude than the 0.4–0.75% per decade benefits we estimate here for double cropping.
Export citation and abstract BibTeX RIS

Content from this work may be used under the terms of the Creative Commons Attribution 3.0 licence. Any further distribution of this work must maintain attribution to the author(s) and the title of the work, journal citation and DOI.
Introduction
Recent research has highlighted the vulnerabilities and risks for US agricultural systems as they confront a 21st century climate [1, 2]. As these vulnerabilities mount, many have begun highlighting adaptations to future climate that may make the system more resilient, such as conservation tillage [3] or increased genetic diversity [4]. Multiple cropping has been explored as well, with research in Chile and Spain highlighting it as a potential adaptation in Mediterranean climates [5], and work in China documenting increased suitability for multi-crop systems in recent decades [6]. Additional work has also been done on the 'cropping frequency gap', or the difference between actual cropping frequency and the potential cropping frequency on cultivated land worldwide, that could be closed in order to increase world production [7]. Despite these efforts, comprehensive studies of how double cropping (DC) may evolve in a changing climate, or whether recent climate trends are indeed driving an increase in actual area devoted to DC, remain limited.
In the US, DC of winter wheat and soybeans in particular has potential to increase resiliency of agricultural production as temperatures increase. In such a system, key times for yield formation in both crops occur outside of July and August—the months most likely to experience extreme heat in the US. Recent economic analyses of this production system also indicate that it has the potential to create higher farmer profits, with an increase of profitability of 27% in a double-crop system in 2013 in Illinois as opposed to single-crop corn [8]. This is roughly in line with the canonical Lin analysis of agricultural growth in China which found that every percent increase in a multiple cropping index (average number of crops harvested per hectare) brought 0.2% increase in the value of agricultural production [9]. In agricultural areas of Mato Grosso, Brazil, where production is phenologically unconstrained and DC is common, a near doubling of income in areas of corn–soy DC compared to single cropping has been found [10].
Despite this potential, farmers face many risks and constraints when attempting to follow this practice. Where moisture is adequate, phenology is the main constraint [11]. This is especially true given that soybeans generate yield in the final stages of their life cycle, when they are most vulnerable to freeze. Notably, however, this constraint has diminished with time, as the growing season in the United States has increased by an average of one week between 1980 and 2000 [12]; though in Illinois, the pace of change may be slower, with one week of growing season length change taking approximately five times as long to occur [13]. In addition, thermal time accumulation is highly sensitive over an entire growing season, as in many circumstances a change in temperature by an average of 1 °C can result in an over 100 growing degree day change annually [14]. Given these circumstances, we examine both trends in winter wheat–soybean DC over the last quarter century as well as future scenarios where this production method has the potential to no longer be constrained by crop phenology.
Methods
Models
Wheat
For this study, we built a first-of-its-kind phenological model for the winter wheat–soybean DC for the United States east of the continental divide and where precipitation was greater than 750 mm per year, as outlined as a minimum for DC viability in [15]. For winter wheat, the Xue, Weiss and Baenzinger model was used for crop phenology. In its most general form, this model relies on a maximum daily development rate multiplied by beta functions that regulate crop response to thermal time and daylength as well as a vernalization function that controls entry into the reproductive period. Nonlinear models including this one have been shown to outperform linear phenology models for wheat in the United States [16, 17].
The planting date for the model is assumed to be the hessian fly free date as provided by [18]. The cultivar grown is assumed to be the early variety described in the original set of cultivar parameters in the model.
Soybeans
For the soybean crop following winter wheat, a model using similar beta functions is used to predict maturity date [19], though for thermal time and photoperiod only, as soybeans have no vernalization requirement. The maturity group grown is assumed to be the optimal full-season variety recommended by [20]. Planting date is assumed to be the maturity date for wheat, with relay intercropping. A soybean crop is deemed to have survived if it reaches maturity before the first freeze of the year (defined as a temperature of 0 °C).
Weather and climate
Daily PRISM data [21] from 1981 to 2012 at 4 km resolution were used as the temperature data for the model runs to examine the recent trends in DC. In order to examine future climate scenarios, monthly output from the Coupled Model Intercomparison Project—Phase 5 (CMIP 5), a compilation of global climate models, were used. These were subset to have a spatial extent over the continental United States and split into the following four periods: 2020–2040, 2040–2060, 2060–2080, and 2080–2100. Here, the mean monthly average temperature change was constructed for each period as the average of the 38 models run in common between the historical, RCP45 and RCP85 experiments, resulting in 48 final files for each representative concentration pathway (RCP), each representing one month in one period. The temperature changes for each GCM and RCP were added to the daily PRISM data on a per-pixel basis for a baseline period 1990–2010 to create simulated weather data for the mid and late 21st century. This process was repeated for the second lowest and second highest GCM in each period in each scenario in order to get uncertainties for area phenologically suitable. The precipitation-constrained area was static over time, as precipitation changes over the 21st century were not considered. The 750 mm constraint removed less than two percent of area currently planted to DC according to 2010–2013 National Agricultural Statistics Service (NASS) Cropland Data Layer (CDL) data. In order to address the consideration that water consumption in a DC system might change, either decreasing due to higher carbon dioxide levels leading to higher water use efficiencies as discussed in [22], decreasing due to more rapidly growing cultivars as seen in [23], or increasing due to increased mean temperatures as seen in [2], baselines and predictions using precipitation constraints of 650 mm, 850 mm and 1 m per year were also created. Detail on these analyses can be found in the supplemental materials, available at stacks.iop.org/ERL/10/024002/mmedia, but generally, lower precipitation constraints result in more baseline area suitable for DC, and even more area available for expansion, while higher precipitation constraints result in less.
Results
Validation
Simulated rates of DC survival, defined as the second crop reaching maturity before first autumn freeze, in a baseline period (1991–2010 harvest seasons) were compared with observed data for crop types available nationally at 30 m spatial resolution for 2010–2013 from the CDL [24] (figures 1(a) and (b)). A strong positive correlation was observed between the simulated probability of DC survival and the observed percentage of land devoted to soybean–winter wheat DC (figure 1(c)). After an inflection point at a survival probability of 75%, however, the warmest regions with the longest growing seasons shifted cropping area to different crops (sugarcane, peanuts, fruit trees etc). The correlation coefficient (Pearson's r) between simulated suitability and the observed fraction of cropland in DC was 0.73 for counties with approval from the United States Department of Agriculture Risk Management Agency (USDA RMA) for some form of DC, greater than 5% of land cultivated, DC survival percentages up to this inflection point.
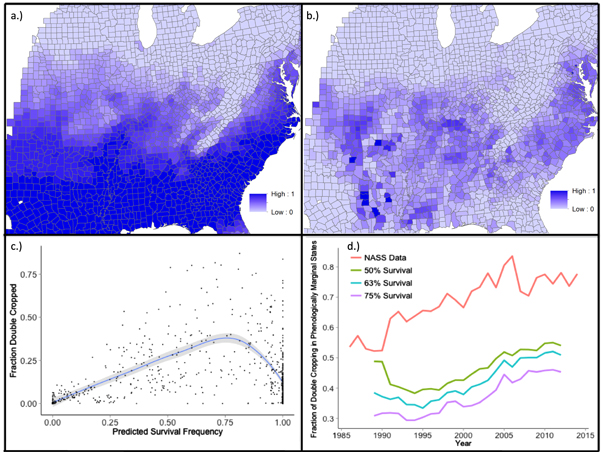
Figure 1. Model validation and suitability trends. (a) Model predicted probability of winter wheat–soybean DC survival in the study area during the baseline (1990–2010) period. (b) Percent of cultivated area used for winter wheat–soybean double cropping between 2010 and 2013. (c) Model predicted probability of survival versus percent double cropped in the 685 counties where the RMA has approved a double cropping practice. (d) Trend in double cropping in phenologically limited states from NASS data (in red) and by various percent survival thresholds from the model (green, cyan and purple).
Download figure:
Standard image High-resolution imageRecent trends in DC
In order to analyze data on trends in winter wheat–soy DC over time, we compared our model results with US government statistics from the June Area Survey conducted by NASS. These data track the statewide acreage of soybeans grown after wheat from 1986 to 2014 for 22 states, albeit at a much coarser resolution than CDL. The time series of total DC area exhibit high variability, given the wide swings in economic incentives for farmers to plant two crops [25], and therefore do not exhibit statistically significant trends. To isolate the role of climate trends, the data were divided into two regions. Fourteen states (Delaware, Illinois, Indiana, Kansas, Kentucky, Maryland, Missouri, New Jersey, North Carolina, Ohio, Oklahoma, Pennsylvania, Tennessee and Virginia) were deemed phenologically constrained, defined as having had an average of at least one instance of early freeze over the baseline period, while eight states (Alabama, Arkansas, Florida, Georgia, Louisiana, Missisippi, South Carolina, and Texas) were deemed to be phenologically unconstrained. A linear trend for 1986–2014 indicated the average proportion of total winter wheat–soybean DC in phenologically restricted states increased by .91 of a percentage point per year (p < .001) from around 50% of total production in the mid 1980s to over 75% of total production in the 2010s (figure 1(d)).
This trend in the observed data could have many causes. Crop insurance regimes have shifted over time, perhaps shifting farmer risk perceptions and therefore crop choices [26]; crop prices have also changed. In order to examine the likelihood that changing phenological suitability over time may be partly responsible, a timeseries of area suitable was calculated using the number of years the modeled DC reached maturity before freeze out of the previous eight years. For reasonable suitability thresholds of survival in 4, 5 and 6 out of the previous eight years (as informed by figure 1(c)), the area suitable in phenologically restricted states increased by .63, .83 and .81 of a percentage point per year, all slightly lower, but consistent with the observed trend. Easing phenological restrictions therefore appear partly responsible for the shift of double crop winter wheat–soybeans to phenologically marginal states (figure 1(d)). It should be noted that the gap between NASS data and modeled data exists due to the effect seen after the inflection point in figure 1(c)) where the warmest areas shift to higher value crops despite suitability for DC.
In addition to this shift, the United States also saw an increase in overall cultivated area suitable for winter wheat–soybean DC. Using the 4, 5, and 6 year survival thresholds, 12, 26, and 28% increases respectively are seen in cultivated land suitable on a national basis.
Projections for the future
To examine how suitability of DC will evolve in the 21st century, we extended our model through 2100 using output from CMIP 5 under the following two scenarios for future warming: an RCP with continued anthropogenic greenhouse gas emissions through the 21st century and a climate forcing of 8.5 watts m−2 and an RCP with peak emissions around 2040 and a decrease thereafter, causing a forcing of 4.5 watts m−2 (RCP85 and RCP45). For this analysis, the threshold for suitability was set at a 75% chance of survival—the inflection point of figure 1(c)) and most conservative definition for suitability used in the historical analysis. A cultivated area mask for 2013 from NASS was also used. As seen in figure 2, under both scenarios, DC steadily expands as temperatures increase. In the RCP85 scenario, the cultivated area suitable for DC increases from 191 785 to 650 764 sq km, an increase of 239% over the baseline. This increase occurs steadily over the 2020–40 and 2040–60 periods, increasing drastically in the 2060–80 period when the heart of the densely cultivated cornbelt becomes phenologically suitable.
Notably, the increase in area suitable between the 2060–80 and 2080–2100 is the smallest between any two periods at only 11%. In this scenario, formerly suitable area in the South is lost because winter wheat requires a period of low winter temperature (vernalization requirement [16]) that is no longer met, and the suitability loss due to vernalization inhibition nearly matches the pace at which new land is made suitable to the North. This pace is slowed in the 2080–2100 period, as there is little cultivated land left in the study area for winter wheat/soybean DC to expand into. In the most extreme model run—the GCM with the second highest mean temperature increase in RCP85 2080–2100—area is lost more quickly from vernalization inhibition than can be gained given that the mean model already has greater than 95% of cultivated area suitable. This results in a mean area suitable projection that is higher than both the low or high projections as seen in the rightmost error bar in figure 3.
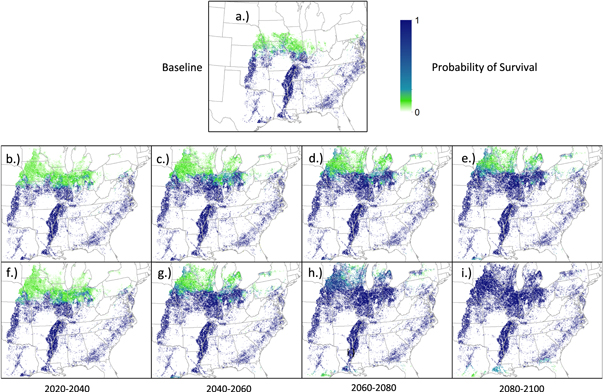
Figure 2. Maps of suitability projections. The simulated probability of winter wheat–soy double crop survival (% of years) in (a) baseline climate (1990–2010) and four future periods using (b)–(e) RCP45 and (f)–(i) RCP85.
Download figure:
Standard image High-resolution image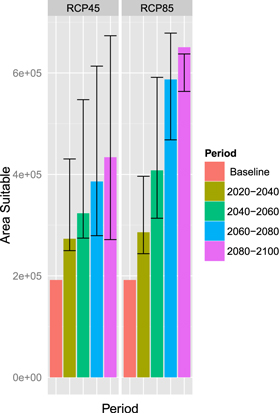
Figure 3. Area suitable for winter wheat–soybean double cropping by period, with suitability defined as survival in 75% of years. Colored bars show projections using the multi-model mean warming, while error bars show values using the GCM with second highest and second lowest temperature increases for each period relative to baseline.
Download figure:
Standard image High-resolution imageUsing the RCP45 scenario and the same threshold for suitability, the area under cultivation increases to 433 913 sq km, an increase of 126%. In this case, increases in suitability follow temperature trends, with increased wheat–soy DC over time, but the elimination of suitable area based on lack of vernalization does not occur to the same degree, and the trend in increased suitability is more linear. In this scenario, area suitable does not break into the northern cornbelt, (figure 2(e)) as temperature increases begin to level off by the end of the 21st century.
Attribution analysis
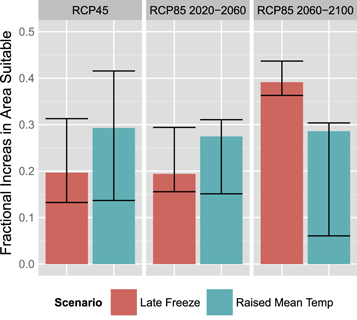
A sensitivity analysis was used to discern the factors controlling the expansion of DC suitability. Specifically, the model was run either with CMIP 5 modified temperatures and baseline freeze data, or CMIP 5 modified freeze data and baseline temperatures, which allowed estimates of DC area changes due to either later freezes or accelerated phenology from higher mean temperatures. As shown in figure 4, for the moderate temperature increases seen in RCP45 and the first two periods of RCP85, more area was added through increases in mean temperature as opposed to later freeze date. However, in the two extreme mean temperature increases, area increased more in the late freeze scenario, as the mean temperature increase resulted in relative area loss due to vernalization inhibition in winter wheat. Thus, for moderate temperature increases, raised mean temperature had a stronger bearing on the increase in area suitable.
Figure 4. Area suitable for winter wheat/double cropping by period. Error bars represent 75% survival using the GCM with second highest and second lowest temperatures for each 20 year interval and aggregating to the three periods shown.
Download figure:
Standard image High-resolution image
Discussion
The results indicate that even the modest climate changes over the past 25 years in the US Midwest have relieved phenological constraints on winter wheat–soybean DC, and resulted in a concurrent shift in this practice to areas that were formerly phenologically constrained. This trend is set to continue under the RCP45 and RCP85 scenarios, mainly due to increases in mean temperature. While the model developed here was specific to winter wheat–soybean DC, the principles that cause significant increases in phenologically suitable area for that practice should extend to other combinations such as winter wheat–corn and corn–corn DC. Overall, DC may benefit areas where it will be newly suitable, as it has been shown to increase returns to farming where it is currently practiced. As an upper bound, were DC to be practiced in all areas newly suitable in the RCP85 2080–2100 scenario, this could increase US agricultural production by 7% using the Lin number for production increases due to increased multiple cropping in China. For the RCP45 2080–2100 scenario, this would be 4%. DC may also help to reduce risks from extreme heat events during critical periods such as pollination, with these risks projected to increase for single-crop corn systems that pollinate in the middle of summer [27]. DC has also been shown to decrease soil erosion where practiced, since the ground has cover for the entire year, not just a portion of the growing season [28].
Despite these benefits, there are significant caveats. The model discussed in this study was only a phenology model, not fully incorporating yield or yield potential. Moisture requirements for DC were only treated in a rudimentary way, and did not consider the potential for changing moisture requirements with changing climate. Further work investigating this practice as a potential adaptation to climate change, and comparing models to observed trends in DC is therefore warranted. At the same time, it should be recognized that impacts on corn and soybean in this region are expected to be negative and larger in magnitude than the 0.4–0.75% per decade benefits we estimate here for DC [29, 2]. Thus, DC should be viewed as an important opportunity for adapting to climate change, but not as a reason to understate the risks of climate change to US agriculture.