

Abstract
The food production system is increasingly global and seafood is among the most highly traded commodities. Global trade can improve food security by providing access to a greater variety of foods, increasing wealth, buffering against local supply shocks, and benefit the environment by increasing overall use efficiency for some resources. However, global trade can also expose countries to external supply shocks and degrade the environment by increasing resource demand and loosening feedbacks between consumers and the impacts of food production. As a result, changes in global food trade can have important implications for both food security and the environmental impacts of production. Measurements of globalization and the environmental impacts of food production require data on both total trade and the origin and destination of traded goods (the network structure). While the global trade network of agricultural and livestock products has previously been studied, seafood products have been excluded. This study describes the structure and evolution of the global seafood trade network, including metrics quantifying the globalization of seafood, shifts in bilateral trade flows, changes in centrality and comparisons of seafood to agricultural and industrial trade networks. From 1994 to 2012 the number of countries trading in the network remained relatively constant, while the number of trade partnerships increased by over 65%. Over this same period, the total quantity of seafood traded increased by 58% and the value increased 85% in real terms. These changes signify the increasing globalization of seafood products. Additionally, the trade patterns in the network indicate: increased influence of Thailand and China, strengthened intraregional trade, and increased exports from South America and Asia. In addition to characterizing these network changes, this study identifies data needs in order to connect seafood trade with environmental impacts and food security outcomes.
Export citation and abstract BibTeX RIS

Content from this work may be used under the terms of the Creative Commons Attribution 3.0 licence. Any further distribution of this work must maintain attribution to the author(s) and the title of the work, journal citation and DOI.
Introduction
As the source of almost 20% of animal protein consumed by humans (FAO 2014) as well as essential fatty acids and micronutrients, fish and other aquatic food (hereafter, seafood) play an important role in global food security. This is especially true for many coastal and developing nations (Gephart et al 2014). In order to keep up with the growing human population, increasing per capita seafood consumption and stagnating global catch, aquaculture production has rapidly expanded (FAO 2014). The resulting diversity of production methods and species produced yields a wide range of environmental impacts of seafood production.
Further, seafood is one of the most highly traded commodities, making up about 10% of all food trade (by value) and exceeding the value of sugar, maize, coffee, rice, and cocoa trade combined (Asche et al 2015). Nearly 40% of seafood production (by volume) is internationally traded and this percent has been increasing in recent decades (FAO 2014). The business of seafood trade has also evolved during the recent period of growth in global seafood trade. The high level of international trade exposes the vast majority of seafood to trade competition and causes international seafood prices to impact domestic, non-internationally traded seafood prices (Tveterås et al 2012). Large transnational companies have emerged and increased the consolidation and vertical integration of the seafood industry (Österblom et al 2015). Increased international trade of seafood has facilitated the substitution of fish from new stocks, including new species, when a given stock declines. For example, when the North Sea cod stock was in decline, cod was imported from other regions and substituted with other whitefish (Crona et al 2015). These recent decades of rapid growth and industry change in production make seafood trade a particularly important study system.
However, despite the nutritional importance of seafood and the high level of international trade, seafood has been excluded from previous studies on global food trade networks. The frequently used food trade database, the Food and Agriculture Organization's FAOSTAT trade matrix, does not contain seafood trade data (Food and Agriculture Organization 2014a, 2014b). As a result, studies using this database do not consider seafood (e.g. Konar et al 2011, Dalin et al 2012, Carr et al 2013). Previous studies have shown an increase in seafood trade globally, increases in total imports or exports from specific countries (FAO 2014), the role of seafood trade in food security of developed and developing countries (Asche 2014), and a net movement of seafood from the global South to the global North (Smith et al 2010, Asche 2014). While these studies have provided important insights into global seafood trade, they cannot extract the trade network or identify changes in trade flow patterns within the network. The network structure indicates the degree of globalization, identifies influential trade partners, and connects consumers to the environmental impacts of food production.
Globalization provides both benefits and risks for food security and the environmental impacts of food production (D'Odorico et al 2014). International trade can improve food security by providing access to a greater variety of foods, buffering against local supply shocks, and providing surplus value through the export of high-value species. For example, seafood exports from developing countries can improve food security through economic stimulation and employment at the national level (Jaunky 2011), but the impact of fish trade for the most food insecure people is difficult to measure (McClanahan et al 2015). International trade may also lessen environmental impacts by increasing overall use efficiency for some resources (e.g. Yang et al 2006) or through the 'environmental Kuznets curve' where trade stimulates economic growth that allows wealthier populations to afford more environmental protections (Verburg et al 2009).
However, international trade by definition involves more than one country and distances producers from consumers. As a result, countries may become dependent on foods from foreign nations, which can be problematic if a government enacts a policy that limits exports. Both theoretical and case study research suggests that increased reliance on international trade exposes nations to external supply shocks (Puma et al 2015). Negative environmental impacts can also arise through international trade from the limited feedbacks between consumers and the ecological impacts of their food production (Crona et al 2015). Trade allows depleted resources to be exploited in new geographical areas leading to the possibility of serially-depleted stocks. This is a particularly high risk when regulations are insufficient. Thus, improved management may not reduce global fishing pressure, but instead shift the fishing pressure to areas with fewer fishing regulations (Worm and Branch 2012). For example when spiny dogfish trade from the United States decreased as a result of the implementation of a fishery management plan, there was an increase in exports from Canada, and new areas of exploitation developed in Africa, Asia, and South America (Dell'Apa et al 2013). More generally stock depletion in the Northern hemisphere has led to an increased pressure on tropical fisheries and has contributed to a net flow of seafood from developing to developed countries (McClanahan et al 2015).
These potential benefits and risks for food security, the environment, and resource management arising from global seafood trade cannot be evaluated without first characterizing the trade flows within the network. This study quantifies the structural changes that occurred in the global bilateral seafood trade network in terms of both value and quantity (tonnes). Following previous studies on structural changes in virtual water trade (e.g. Konar et al 2011, Dalin et al 2012, Carr et al 2013), we apply network methods to characterize the evolution of global seafood trade, provide metrics of the globalization of seafood, quantify shifts in bilateral trade flows, identify changes in the most central players, and compare the seafood trade network to agricultural and industrial trade networks. Based on the findings with this data, we also identify future data needs in order to connect seafood trade with more specific environmental impacts and food security outcomes.
Methods
The global seafood trade network was constructed for each year from 1994 to 2012 using data from the United Nations Comtrade database. The network structures were quantified based on the network average degrees, degree distributions, clustering coefficients, and eigenvector centralities (see below). The changes in trade flows were then evaluated and compared across trade relationships. Similar methods have previously been used to study patterns and changes in trade as, for example, study of the topological properties of the World Trade Web (Garlaschelli and Loffredo 2005, Fagiolo et al 2010), food trade within the United States (including seafood) (Lin et al 2014), and study of the structure and evolution of the global virtual water trade network (Konar et al 2011, Dalin et al 2012). Additionally, a series of papers used network analysis with virtual water trade data to look at the temporal variability (Carr et al 2012a), trade dependence (Suweis et al 2012), network inequalities (Carr et al 2012b, 2015), and network community structure (D'Odorico et al 2012). While these virtual water studies effectively investigate agriculture and livestock commodity trade, they do not consider seafood trade.
Data description
We used the United Nation's Comtrade database for this analysis because it contains bilateral trade information (i.e. data on trade from country A to country B, etc). This differs from the more commonly used FAO FishStat database, which contains only total imports and total exports (i.e. no information on from where the trade originates). Both databases contain data on imports and exports in US dollars. Comtrade does not contain data on quantity trade flows for all seafood trade, but we converted the dollar flows to metric tonnes using average tonne/USD factors for each country's imports based on FishStat data. The networks are constructed from both reported imports and exports in the Comtrade database, with the maximum value reported by the importer or exporter used. The network analysis is then conducted on both quantity and value data. The network for this analysis represents seafood products destined for human consumption (selected from Harmonized System codes 03 and 16) for 1994–2012. To compare the two databases (Comtrade and FishStat), we sum across each country's imports and exports in the Comtrade data and ran a linear regression through the origin against the FishStat total import and export data. We find that both the total imports and total exports from the Comtrade data explain a large proportion of the variability in the FishStat data (figures S1, S2 and table S1). The slopes near one indicates that the Comtrade data agree well with the FAO's estimates for both value and quantity across years.
About half of the imports globally are reported from 'World,' which does not specify import origins and were therefore excluded from the analysis. The percent of trade to each region from 'World' remained relatively constant for each year (figure S3). In order to test whether reporting to 'World' biased our assessment of the trade network, we compared the fit of the Comtrade total exports versus FishStat total exports when each country's 'World' imports are distributed proportionately to the known trade network versus distributed according to proportions (0 to 1) drawn from a Dirichlet distribution. The fit of the 'World' trade distributed proportionately to the known trade network fell in the upper tail of the distribution of fits, with 0.999 9994 of the distribution's density falling below it. This suggests that the reporting to 'World' is unbiased and that little structural information is masked by 'World'. As a result, removing this node decreases the total imports, but does not affect structural features of the network. See the supporting information for more details about the analysis of the 'World' node. Trade data were adjusted for inflation using the United States consumer price index from the World Bank using 2010 as the baseline (The World Bank 2015).
Additionally, countries which no longer exist were combined with the modern recognized nation following Carr et al (2013). The resulting dataset contains 205 nodes and includes territories with Comtrade (2010) country codes that operate and report trade independently, but are not independent states (e.g. Hong Kong). Nodes are occasionally referred to as countries in this paper, but actually represent both countries and territories. It is important to also note that this trade data provides information on the countries engaging in trade, but this does not necessarily represent the geographical origin of the seafood products.
Data analysis
Node degree measures how many trade partners each country has, while the degree distribution shows whether the network has a few countries with many trade partners and many countries with few trade partners or vice versa. Degree distributions are commonly used to describe the structure of large networks that cannot easily be depicted. Degree distributions are based on the unweighted, directed in-degrees ( and out-degrees (
 and calculated for the network using the adjacency matrix,
  where i represents the row and j represents the column. For n countries in the network,
  and
and  Note that the average in-degree equals the average out-degree across a network (Newman 2010).
The clustering coefficient, or network transitivity, is the probability that the adjacent edges of a node are connected, and is equal to six times the number of triangles (a loop of length three) divided by the number of paths of length two (Newman 2010). Clustering was calculated using the igraph package function 'transitivity' in R programming language (Csardi and Nepusz 2006).
Eigenvector centrality was chosen as the measure of centrality in the network because it evaluates both the number of connections (neighbors) a node has, as well as the connectedness of the neighbors. The eigenvector centrality for the undirected weighted trade network was calculated using the igraph package 'evcent' function (Csardi and Nepusz 2006). All analyses were conducted using R statistical software (R Core Team 2011). Because of the large number of countries (nodes) in the network, we aggregated results by region for presentation. Country groupings into regions are depicted in figure 1. This circlular data figure was generated by Circos software (Krzywinski et al 2009) and is similar to trade and flow figures produced by others (e.g. Dalin et al 2012).

Figure 1. The global seafood import trade network for 1994 and 2012. The width of each band represents value (in 2010 USD) or quantity (in tonnes) traded and the band color represents the importer. The circular figure areas are scaled to the total value traded in 1994 and 2012, respectively. Note that MENA stands for Middle East and North Africa.
Download figure:
Standard image High-resolution imageResults
The global seafood trade network grew rapidly from 1994 to 2012 in terms of the number of trading partners and the total trade flows. Thailand, the United States, and Chile exemplify some of the changes observed in the network structure (figures 2 and S4). Thailand experienced dramatic growth in the value of exports and in the number of countries to which it exports. In contrast, the United States increased the value of its imports by over 60%, with little change in the number of countries from which it imports. Chile had relatively few import or export partners at the start of the study period (1994). By 2012, the number of export partners grew and the export value more than tripled.
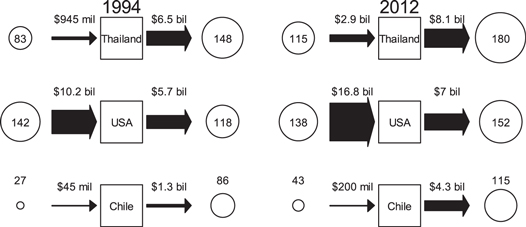
Figure 2. Example changes in the number of exporters (in degree), import flow, importers (out degree), and export flow for Thailand, USA, and Chile. Number of exporters and importers are indicated by the area of the circle and import/export flow (in 2010 US dollars) is indicated by the arrow width. See figure S2 for the equivalent figure produced with quantity data.
Download figure:
Standard image High-resolution imageAcross the entire network, the number of countries and territories (nodes) actively trading in the network remained relatively constant (194 in 1994 and 197 in 2012), while the number of trade partnerships (edges) increased by 65% (3988 in 1994 and 7141 in 2012). Further, each node had an average of 25.3 connections in 1994 and an average of 41.7 in 2012 (figure 3). Thus, the trade network became increasingly connected over time. The countries with the largest increases in number of export partners (difference between 2008–2012 average and 1994–1999 average) were South Africa (100.8), Vietnam (100.6, China (80.4), Namibia (76.6), and Indonesia (73.2), while the largest increase in number of import partners were South Africa (83.2), Vietnam (60), United Arab Emirates (48.4), and Nigeria (46.4). Few decreases in degree occurred. Of the 205 countries and territories, 86% increased or saw no change in the number of export partners and 88% increased or saw no change in the number of import partners. The decreases in degree that did occur were of much smaller magnitude than the increases. The largest decreases in the number of export partners are Venezuela (−14), Saint Vincent and the Grenadines (−7.6), and the Cayman Islands (−5.8), while the largest decreases in the number of import partners are Guadeloupe (−20.6), Martinique (−20.4), and Réunion (−12.8).
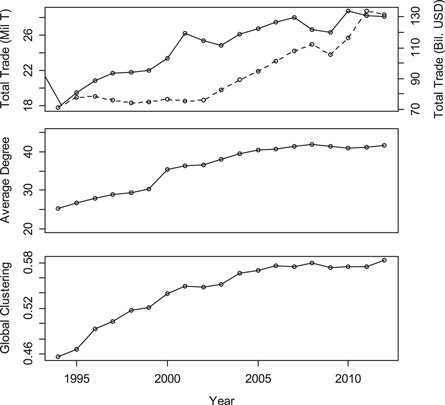
Figure 3. Increasing total trade (quantity in solid line and value in dashed line), unweighted degree, and unweighted global clustering coefficient of seafood trade from 1994 to 2012. Values are based on the trade network constructed from UN Comtrade data, adjusted to 2010 USD.
Download figure:
Standard image High-resolution imageThe network consists of many countries with few trade links (low degree), and few countries with many trade links (high degree). However, in more recent years the degree distribution has shifted so that there were more countries with more trade links (higher degree, figure S5). The clustering coefficient for the network also increased from 0.46 to 0.58, indicating the network has become more transitive in trade links (figure 3). This means countries increasingly tend to trade with countries that also trade with one another, forming more frequent triangles within the network (Fagiolo et al 2010). The network was dominated by short-lived trade relationships. Over the time period considered, there were nearly 5000 edges lasting a single year, around 3000 permanent edges, and fewer than 1000 edges lasting intermediate lengths (figure S6).
In 1994 the most central countries in the network (measured by eigenvalue centrality) were several Western and Northern European countries, the United States, Japan, and Thailand (table 1). By 2012 Thailand and China became the top two most central countries in the network (table 1). Over the entire network, most countries became more central, with most countries lying above the one to one line in figure 4. This effect is strongest for nations with the lowest centrality scores in 1994 (from 0.0 to 0.2), as represented by the distance from the one to one line.
Table 1. Top ten countries most central to the trade network based on eigenvalue centralities in 1994 and 2012. Eigenvalue centrality was calculated for the annual trade network constructed from UN Comtrade data.
| 1994 Ranking | 2012 Ranking | |
|---|---|---|
| 1 | United Kingdom | Thailand |
| 2 | France | China |
| 3 | USA | Germany |
| 4 | Thailand | France |
| 5 | Netherlands | USA |
| 6 | Germany | Canada |
| 7 | Japan | Indonesia |
| 8 | Italy | United Kingdom |
| 9 | Norway | Netherlands |
| 10 | Spain | Spain |

Figure 4. The eigenvalue centrality (a measure of the number of connections a node has as well as the connectedness of the neighbors) for each country in 1994 plotted against the eigenvalue centrality in 2012.
Download figure:
Standard image High-resolution image
At a regional level (countries grouped into 18 regions; see figure 1), the network was already highly connected in 1994, with trade links occurring in 90% of the possible edges. The network still became more highly connected by 2012, with trade links existing in 98% of the possible edges. The main changes increasing the connectivity were the nine new export partners for Central America, four new export partners each for Eastern Europe, and Southern and Central Africa, along with the ten new import partners for West Africa and seven new import partners for Central Africa (figure 1). The largest increases in value trade flows from 1994 to 2012 occurred within Northern Europe, from Southeast and Eastern Asia to North America, within Western Europe, within Southern Europe, and from Northern Europe to Central-Western Asia. The largest decreases occurred from North America to Eastern Asia, and from Southeast and South-Central Asia to Eastern Asia.
In terms of value, the largest trade flow increase was nearly three times the largest decrease. Changes in trade flows for individual countries represent the difference of the average trade flows for 2008–2012 and 1994–1999. Of total possible trade links among the 205 nodes in the network, 25% increased and 9% decreased (no change in the remaining edges, which were zero initially and remained zero), with the increases being much larger than the decreases. The largest increases in trade flows in terms of quantity occurred from the Russian Federation, the United States and Norway to China, from China to the Republic of Korea, and from Norway to Sweden (table 2). The largest decreases are from the United States, Indonesia, the Republic of Korea, Canada and India to Japan (table 2). In terms of value, the largest increases in trade flows were from Norway to Sweden, from China, Vietnam, Indonesia, Canada, Thailand and Chile to the United States, and from the Russian Federation and the United States to China (table 2).
Table 2. Top increases and decreases in average trade flows from the time period 1994–1999 to 2008–2012. Trade values are based on UN Comtrade data, adjusted to constant 2010 USD and trade flow quantities are based on UN Comtrade data and FAO FishStat price data. Since the increases are much larger over the time period, the top 20 increases are presented to reach changes in trade flows of similar magnitude as the top 10 decreases.
| Top increases | Exporter | Importer | Trade difference (Thousand Tonnes) | Exporter | Importer | Trade difference (Million USD) |
|---|---|---|---|---|---|---|
| 1 | Russian Federation | China | 486 | Norway | Sweden | 2102 |
| 2 | USA | China | 289 | China | USA | 2052 |
| 3 | China | Republic of Korea | 271 | Russian Federation | China | 1105 |
| 4 | Norway | Sweden | 263 | China | Republic of Korea | 998 |
| 5 | China | USA | 216 | Vietnam | USA | 901 |
| 6 | China | Nigeria | 188 | Indonesia | USA | 798 |
| 7 | China | Malaysia | 163 | Norway | Russian Federation | 700 |
| 8 | China | Phillipines | 161 | USA | China | 696 |
| 9 | Norway | Nigeria | 152 | Spain | Italy | 571 |
| 10 | Norway | China | 147 | Poland | Germany | 539 |
| 11 | Russian Federation | Republic of Korea | 130 | Canada | USA | 526 |
| 12 | Norway | Russian Federation | 119 | Russian Federation | Republic of Korea | 505 |
| 13 | Vietnam | Republic of Korea | 113 | Thailand | USA | 504 |
| 14 | China | Indonesia | 112 | Chile | Japan | 484 |
| 15 | Norway | Ukraine | 111 | Chile | USA | 483 |
| 16 | Sweden | Poland | 109 | China | Germany | 453 |
| 17 | Canada | China | 108 | Norway | Poland | 452 |
| 18 | China | Russian Federation | 106 | China | Hong Kong | 437 |
| 19 | China | Thailand | 103 | Sweden | Poland | 416 |
| 20 | Vietnam | USA | 101 | Sweden | France | 409 |
| Top decreases | ||||||
| 1 | USA | Japan | −223 | USA | Japan | −1519 |
| 2 | Hong Kong | China | −136 | Indonesia | Japan | −842 |
| 3 | Indonesia | Japan | −130 | Republic of Korea | Japan | −714 |
| 4 | Thailand | China | −122 | Canada | Japan | −566 |
| 5 | Norway | Germany | −121 | India | Japan | −522 |
| 6 | Denmark | Germany | −112 | Thailand | Japan | −368 |
| 7 | Republic of Korea | Japan | −109 | Mexico | USA | −327 |
| 8 | Russian Federation | Norway | −104 | Morocco | Japan | −308 |
| 9 | Canada | Japan | −83 | Russian Federation | Japan | −305 |
| 10 | India | Japan | −80 | Austrailia | Japan | −286 |
Discussion
This study provides the first description of the global seafood trade network, including its structural evolution from 1994 to 2012. During this period the network became more connected, with a 65% increase in the average number of trade partnerships (node degree). The increase in average degree occurred largely through a shift in the degree distribution resulting in more countries with high degrees in the network (figure S5). The trade relationships between countries tended to be short-lived, with a domination of trade links lasting only a single year (figure S6). The trade flows in the reported network increased from $71.2 billion and 17.8 million tonnes in 1994 to $131.6 billion (in 2010 US dollars) and 28.1 million tonnes in 2012, representing 58.2% growth in quantity 84.9% real growth in value (figure 3). This gives a real growth rate of 4.5% per year (figure 3). This rate of increase in total trade value agrees with the rate of increase in trade of all seafood products reported by the FAO, including their estimate of 4.1% real growth per year (FAO 2014). This period of real growth in terms of value corresponds to a period of decreasing average traded seafood prices in real terms (FAO 2014). The trade price of aquaculture has decreased at a faster rate due to lower production costs improved production technologies, and lower distribution costs (Asche and Smith 2009, FAO 2014). As a result, expanding aquaculture production has contributed to the decreasing overall traded seafood price. However, in the last few years production costs have increased and demand has remained high, causing trade prices to begin rising (FAO 2014). Higher prices for capture species has been attributed to higher energy costs for fishing vessels and increasing scarcity of capture fishery resources (Tveterås et al 2012, FAO 2014).
In addition to the growth in trade across the entire trade network, there were substantial shifts in the trade flows, with the largest increases in net imports in North America, Southern Europe, and Western Europe, and the largest decreases in net imports in Southeast Asia, South America, and Northern Europe (figure 1). A notable difference between the regional trade networks in terms of value versus quantity is that West Africa increased the tonnes of imports to a much greater degree than it increased the value of its imports, with large increases in imports from Northern Europe and Eastern Asia (figure 1). This indicates that West Africa is importing low-value seafood from these regions. These changes in trade patterns in figure 1 can only be derived from a network analysis.
The average node degree of 30 for 2012 is lower than the average node degree for the trade network of all commodities (∼90 in 2000) (Fagiolo et al 2010) and the agricultural product (represented by virtual water) trade network (>70 in 2008) (Carr et al 2012a). From 1994 to 2012 the average node degree for the seafood trade network increased by 65%, which is similar to the rate of increase in average node degree from 1986 to 2008 for the virtual water trade network (Carr et al 2012a). This result suggests that the rate of increase in trade partnerships is similar for both terrestrial and aquatic foods. Additionally, the increase in average node degree for food commodities differs from the relatively constant average node degree observed in the overall trade network from 1981 to 2000 (Fagiolo et al 2010). This means that food products are currently in a period of greater increasing globalization in terms of connectivity relative to other traded products. These two metrics of the increasingly globalized seafood system add to a recent study that found an increasing distance between seafood consumers and their seafood production (Watson et al 2015b).
While the increasing average degree and clustering coefficient indicate greater connectivity and transitivity in the overall network, an analysis of the trade flows reveals that the largest trade increases occur between countries in the same region, represented as arcs to the same region in figure 1 (and confirmed in the trade data matrices). This increasing regionalization of trade has been observed in other trade networks and has been attributed to the formation of regional free trade agreements (Iapadre and Tajoli 2014). However, this trend may weaken as new preferential trade agreements are now also being formed between geographically distant countries (Iapadre and Tajoli 2014).
In the future, further changes to the seafood trade network based on growing populations, increasing protein demand in developing countries, shifts in production systems, and redistribution of capture and aquaculture locations are likely. The largest increases in population are projected to occur in developing countries. At the same time, the demand for seafood products is expected to increase in these countries because of the growing demand for animal protein as per capita GDPs rise (Tilman et al 2011). This increased demand for protein in developing countries could cause greater imports and aquaculture development (Duarte et al 2009, Bostock et al 2010). Alternatively, developing countries may further increase exports of high value species and use the surplus to import staple foods (McClanahan et al 2015) or low value seafood (Smith et al 2010).
Marine and freshwater capture fishery production have leveled off in recent years (FAO 2014) and the increased demand for seafood products is currently being met through increased aquaculture production (Tidwell and Allan 2001). Aquaculture now comprises approximately half of the world's fish food supply, with the largest production growth in Asia (Bostock et al 2010). The increasing Asian aquaculture production is likely a primary factor for the observed changes in international trade flows. For example the increase in Thailand's exports (figure 1), and Thailand and China's centralities in the network (table 1) correspond to a period of increasing farmed shrimp exports from Thailand and overall growth in aquaculture production in China. If projections for the continued high growth rate in the aquaculture industry are correct, aquaculture production will likely continue to restructure the seafood trade network. Additionally, increases in aquaculture imports will shift the geographically distant environmental impacts of seafood production from those related to capture fisheries (e.g. bycatch, overfishing, gear abandonment, etc) to those related to aquaculture (e.g. coastal development, water withdrawal, nutrient release, fishmeal/fish oil and crop production for feeds, etc).
In the long-term, the seafood trade network may also be restructured by the changes in the ranges of target species that arise from global climate change (Barange et al 2014). Cheung et al (2010) predicts a 30–70% increase in catch potential in high-latitudes, but a 40% decrease in the tropics by 2055. Within countries' EEZs, Norway, Greenland, Alaska in the United States and Russia are expected to have the largest increases in catch potential, while Indonesia, mainland United States, Chile, and China are expected to have the largest catch potential decreases (Cheung et al 2010). These shifts will not only restructure the trade network, but also force the renegotiation of existing international fishery agreements. Such changes were already observed during a recent dispute between Iceland, Norway, the Faroe Islands and the European Union over mackerel, which have moved into new territories (Jolly 2013).
The increasing trade of food and increasing connectivity of international trade networks means that food security and sustainable food production cannot exclusively be studied with a local perspective. Adding a complimentary global systems perspective requires quality bilateral trade data. Our study analyzed aggregated seafood trade, but species-specific trade data is needed to analyze the trade of species of conservation concern and to connect seafood to the environmental impacts of its production. Hundreds of seafood species are produced using a wide variety of fishing and farming methods (Duarte et al 2009). While fewer species comprise the majority of seafood production, there is still large variation in production methods and resource demands. For example, salmon and oysters can both be harvested wild or farmed. When farmed, oysters require few feed inputs, whereas salmon require feed inputs that vary in amount and composition (Tacon et al 2011). Similarly, there are large differences in the water, energy, and nutrient impacts among these systems (Folke et al 1998, Pelletier et al 2009, Pahlow et al 2015). This variance in environmental impacts within and among species groups suggests that detailed bilateral trade data containing species information, production method, and location production are needed to quantify the environmental impacts of traded seafood trade.
A first step toward improving data on fish trade would be to implement the changes to the Harmonized System commodity codes suggested by Chan et al (2015). Further, data on reimports/reexports, country of origin, and production information (e.g. capture versus aquaculture) is scarce for all food trade data. Attempts to identify the geographical source of seafood requires substantial effort and several assumptions to connect total import data to mapped catch data (e.g. Watson et al 2015a). Such an approach could be complimented by the trade network structure detailed here. The difficulty disentangling seafood origin causes the current global seafood trade network to mask and dilute price signals that would otherwise serve as important indicators of the state of fisheries for consumers (Crona et al 2015). Improved trade data and product labeling would help address these missing feedbacks in the global seafood trade network. Such detailed trade data seems achievable in the future given the increasing capacity of data storage. The resulting detailed and more accurate trade data would not only improve research on sustainable food production and global food security, but it would allow for more informed policies and provide purchasing information to consumers.
This study analyzed the global seafood trade network, but it is important to note that this trade network is embedded in a larger socio-environmental network that includes marine ecosystems that support fish production, the fishing vessel and shipping transportation network, and the social and political networks of managers and market participants. Each component of the larger socio-environmental network influences the relationship of seafood production to present and future food security. A small number of seafood corporations produce and trade a large fraction of seafood products, as well as being active participants in policy-making (Österblom et al 2015). These 'keystone actors' are positioned to shape the direction of future seafood production and the marine ecosystems on which seafood relies (Österblom et al 2015). In terms of food security, seafood trade primarily contributes to the food availability pillar of the food security framework laid out by the World Health Organization. The other two pillars of food security, food access and food use, are largely influenced by the transportation, economic, social, and political components of the larger social-ecological network. This broader socio-environmental perspective is necessary to design and implement more sustainable food supply systems.
Conclusion
The total value of traded seafood (in real terms) nearly doubled from 1994 to 2012, with the largest trade increases occurring within regions and from exports from Southeast and Eastern Asia. These trade increases coincide with large increases in the influence of Thailand and China in the network. Concurrent with this restructuring, the overall globalization of seafood products increased, as indicated by the increasing average numbers of trade partnerships, the shift in the distribution of the number of trade partnerships, and the increasing network clustering. Applying network methods to the seafood trade data provides new insights into global seafood trade, including that the increase in trade and connectedness is similar in magnitude as the agricultural network and the increasing network influence of China and Thailand, coinciding with their periods of rapid aquaculture growth. With improved trade data consisting of detailed species, production method, and location information, this work can be extended to connect seafood trade to its specific food security and environmental impacts.
Acknowledgments
This research was funded by the University of Virginia Department of Environmental Sciences and the National Science Foundation Graduate Research Fellowship. We are grateful to Paolo D'Odorico, Joel Carr, David Seekell and the anonymous reviewers for their helpful feedback. All data used in this paper are openly available through the Food and Agricultural Organization of the United Nations and can be accessed using the web addresses in the references section.