

Abstract
Drought is a natural hazard triggered by a lack of precipitation that can last for several months or years. Droughts can affect a wide range of socio-economic sectors while the related direct and indirect impacts are often difficult to quantify. In this context, drought damage refers to the total or partial destruction of physical assets in the affected area. The main constraint in constructing a robust relationship between the severity of drought events and related damages is the lack of sufficient quantitative impact data. In this paper we propose the use of power-law damage functions to assess the relationship between drought severity and related damages in two economic sectors, namely cereal crop production and hydropower generation, across 21 European countries. The different shapes of the resulting damage functions can be explained by the specific drought vulnerability or adaptive capacity of each sector and country. Due to the scarcity of impact data linked to extreme climate events a bootstrap resampling was performed to assess the potential uncertainties associated with the sample size. This approach helps communicating potential drought impacts and related uncertainties to end users and policy makers in support to the development of drought management plans and long-term adaptation measures.
Export citation and abstract BibTeX RIS

Content from this work may be used under the terms of the Creative Commons Attribution 3.0 licence. Any further distribution of this work must maintain attribution to the author(s) and the title of the work, journal citation and DOI.
Introduction
Droughts result from a shortfall in precipitation over an extended period of time or from the inadequate timing or the ineffectiveness of the precipitation, often combined with high temperatures and increased water demands. It is a complex disaster due to its often long persistence and the propagation through the entire hydrological cycle.
While droughts are known to affect extended areas and a large number of people, the related impacts are often difficult to quantify: they are non-structural and spread over larger areas and longer periods than damages resulting from other natural hazards such as floods or forest fires (Wilhite 1993). These characteristics make it difficult to evaluate and quantify the damage caused by single drought events. While negative socio-economic impacts are frequently reported for agricultural production, public water supply, power generation, tourism, and other water-dependent industries, environmental impacts related to water quality, wetlands and biodiversity that in the long-run may lead to environmental degradation, are more difficult to quantify (Vogt and Somma 2000, Maia et al 2014).
Disaster impacts can be measured in terms of losses or damages, where the term loss represents negative economic impacts (measured in monetary units) while the term damage refers to the total or partial destruction of physical assets in the affected area (Smith and Ward 1998, de Groeve et al 2014). Damages occur during and immediately after the disaster and are measured in physical units (e.g., square meters of housing, kilometres of roads, kg ha−1, kWh). Their monetary value, the related loss, is expressed in terms of replacement costs according to prices prevailing just before the event (ECLAC 2003). Based on these concepts the risk resulting from a certain natural hazard can be evaluated. Brooks (2003) provides a comprehensive review of the various risk definitions to be found in literature. Most of them are based on approaches combining the probability of hazard occurrence and the likely impacts of a resulting disaster, which depend on the severity of the event and on the exposure and vulnerability of the socio-economic or natural system affected. In order to assess the potential impact of an ongoing or possible future drought event, quantitative information on both the severity of past events and on their related impacts (damages and/or losses) are, therefore, required.
With respect to drought events a large body of literature discusses different drought indicators and more recently suitable thresholds for drought severity classification have been proposed (e.g., Steinemann and Cavalcanti 2006, Mishra and Singh 2011, Carrão et al 2014, Spinoni et al 2014, 2015, Steinemann et al 2015). However, little research is still available regarding the link between drought severity and related impacts (Jenkins 2012, 2013). While for natural hazards with prevailing direct impacts (e.g., earthquakes, floods or forest fires) the assessment of damages and related risks is well covered (e.g., Hergarten 2004, Merz et al 2010, Jongman et al 2014), little attention was so far given to the quantification of drought impacts. Publications are usually related to some case studies or particular events and the general relation between the severity of drought events and their impacts is yet to be explored (Bachmair et al 2015). Major constraints for developing robust statistical relationships (so-called damage functions) between droughts and the related damages are the scarce availability and low quality of data on drought impacts in different sectors.
Recent publications investigate the relationship between drought indicators and text-based impact reports collected as part of the European Drought Impact report Inventory (EDII, Stahl et al 2012). They relate the level of different drought indicators to the number of reported impacts and the reported onset of a drought (Bachmair et al 2015), or explore the likelihood of drought impact occurrence in Europe as a function of a drought indicator using a logistic regression (Blauhut et al 2015). However, as sufficient quantitative data are lacking, they fail to quantify the expected impacts in terms of production (damage) or economic return (loss).
The goal of this paper, therefore, is to investigate the relationship between drought severity and measurable impacts throughout Europe. We propose the construction of damage functions at country level based on power-law functions (Hergarten 2004) for two sectors where drought impacts are direct and relevant, and for which quantitative and quality checked data are available. In order to avoid data disaggregation issues, we analysed only those European countries that did not change borders in the last 50 years. The sectors are cereal crop production and hydroelectric power generation, using data from the World Bank and FAO databases. All datasets used are publicly available on country level (FAOSTAT 2014, World Bank 2014).
Data and methods
The development of drought damage functions relies on the link between drought characteristics and their impacts. In this study droughts are characterised by a set of metrics derived from specific indicators, and impacts are expressed as damages in the form of reduction of cereal yields and hydropower production.
Three meteorological drought indicators were selected in order to describe past European drought events (Spinoni et al 2015): the standardized precipitation index (SPI; McKee et al 1993), the standardized precipitation evapotranspiration index (SPEI; Vicente Serrano et al 2010), and the reconnaissance drought index (RDI; Tsakiris and Vangelis 2005). All indicators have been computed for 3 and 12 months accumulation periods with a monthly time step from 1950 to 2012. Input data are precipitation, minimum temperature, and maximum temperature from the E-OBS grids (version 10) of the European Climate Assessment and Dataset project (Haylock et al 2008). This dataset encompasses the whole of Europe with a spatial resolution of 0.25° × 0.25°. Based on these three indicators, drought events and their severity have been defined. A detailed description on the methodological aspects of the indicators can be found in Spinoni et al 2015.
Data on cereal yield, measured in kilograms per hectare of harvested land, include wheat, rice, maize, barley, oats, rye, millet, sorghum, buckwheat, and mixed grains from non-irrigated farmland. Cereals harvested for hay or harvested green for food, feed, or silage and those used for grazing were excluded. FAO allocates production data to the calendar year in which the bulk of the harvest took place. Data on electricity production (in kWh) refer to hydroelectric power plants (World Bank database). Differentiation and de-trending were performed for both sectors before deriving the damage functions (Box and Jenkins 1970). For the trend removal a first order polynomial was fitted and then subtracted from the data, for the differencing procedure each value was subtracted from the previous one. This is equivalent to discrete-time differentiation (Livina et al 2011).
Damage functions are a reduced form relationship that links market and non-market impacts to climate indicators (Jenkins 2012). In our case, the scope of analysing damage functions is to ultimately estimate the risk related to drought events of a given severity under present and future scenarios. Eventually, this information can be used to feed early warning systems in the short-term and to develop mitigation and adaptation plans for different future scenarios in the long-term.
The final impacts of a natural hazard on the objects, goods, people, or natural ecosystems of a particular region depend on complex interrelationships and domino effects. A useful conceptual framework for risk (R) assessment is, therefore, based on the combination of an external factor, defined by the severity of a natural phenomenon threatening the social system (hazard) on the one hand, and on the internal capacity of a society or ecosystem to cope with, resist to, and recover from a certain impact (vulnerability) on the other hand (Bohle 2001, UNDP 2004, IPCC 2007 and 2012, Ciurean et al 2013). If the hazard is defined as the expected average number of events of a certain severity (N), and D is the expected average damage caused by an event of a certain severity (Hergarten 2004, Merz et al 2009) then the drought risk can be considered as the product of hazard and expected damage:

This relation is not valid at a global scale and can only determine the risk of a drought of a certain severity in a given region and period of time, assuming a stationary relationship between hazard and expected damage. The assumption of stationarity can limit the accuracy for future projections since changes in the relationship between indicator and damage, for example through adaptation or improved mitigation measures, will result in larger uncertainties when projecting future damages.
Considering all the possible events, N can be represented by its cumulative probability density function (PDF) P(s) where s represents the drought severity. The magnitude of s in this context can, for example, be defined as the absolute or relative drought severity, the area affected by a drought of a certain severity, or by a bivariate PDF of both (copulas, as in Lee et al 2013).
Following the formulation in Hergarten 2004 let p(s) be the probability density of an event of severity s

and D(s) the expected damage. The expected overall damage is then given by

Finally the total drought risk can be determined by

It follows that risk assessment relies on two main processes: the identification of a suitable distribution that can represent the drought events (hazard) and the assessment of the damage for a certain sector as a function of the drought severity. Here drought severity was defined as the sum of the absolute values below zero of the selected drought indicator during a given drought event. Indicators were averaged at country level in order to coincide with the spatial resolution of the impact data that were available only at country level across Europe. From the resulting time series, drought events have been identified from the month when the indicator falls below a given threshold until it reaches a value of zero again. This aggregation can introduce an uncertainty in the data on drought severity, especially for large countries when only parts of the territory are affected. However, also the impact data are aggregated at country level. While spatially more resolved impact data would be desirable, such data are currently not available at continental scale.
In order to estimate the damage functions we propose to link drought severity to damage using a simple and flexible power-law dependence (Hergarten 2004, Merz et al 2009).

In the simplest case the exponent β is equal to one and the relation is linear. However, as depicted in table 1, the exponent β can be greater than 1 (stronger than linear growth) or be smaller than unity (limited growth). The relationship depends on the sector type, interrelations with other sectors, diversification of the sector, and available mitigation measures to cope with droughts. The shape of this relationship determines the kind of drought risk to be expected. Figure 1 illustrates the relationship between the β parameter and theoretical standardised damages.
Table 1. Types of relations between drought severity and damages according to the value of the exponent β.
| Exponent β | Type of relation |
|---|---|
| β = 1 | Linear relation |
| β < 1 | Limited growth relation |
| β > 1 | power-law growth relation |
| β = 0 | No relation |

|
Possible positive effects of droughts |

Figure 1. Theoretical damage (D) curve in function of drought severity (s) for different β values.
Download figure:
Standard image High-resolution imageThe uncertainties due to the sample size and choice of the function type can be assessed through a sensitivity analysis of the model. As described in Naumann et al 2012, a non-parametric Bootstrap method can be applied to assess the uncertainties of the parameters that define the damage functions. The initial idea behind resampling tests is to perform a collection of artificial data batches of the same size as the actual data, and then to compute the test statistic of interest for each artificial batch. The result provides as many values of the test statistic as there are artificially generated data batches (Wilks 2002). The variance of the resulting sample of estimated parameters provides a measure of the uncertainty in their estimation. A detailed description of the methodology is given in Naumann et al 2012.
Results
The degree of correlation between the de-trended production series for cereals and hydropower and the drought severity derived from the individual drought indicators was assessed for the individual countries. Tables 2 and 3 show the results for the correlation for the countries analysed. Overall the highest correlation between drought indicators and crop production was found for the SPEI-3. A three months accumulation period seems to best represent the crop water requirements. However, in some cases like Spain or France, greater accumulation periods produce good correlations as well. For the hydroelectric power generation the most correlated drought index is the SPEI-12, in line with usual reservoir management time scales. Consequently, drought severity derived from SPEI-3 and SPEI-12 was selected to build damage functions for the agricultural and hydrological sectors, respectively. However, it is noteworthy that for some countries only weak or even no relation at all could be detected. Examples for cereal production are Greece and Albania in the Mediterranean, Poland in Central Europe, Belgium and The Netherlands in the Western Europe, as well as Denmark and Norway Northern Europe. For the case of hydropower production generally weak relationships are true only for Hungary and the Netherlands. For crop production, this situation can result from different causes, ranging from the availability of efficient mitigation measures (e.g., irrigation schemes), over a lack of drought events severe enough to cause significant impacts on crop production, to issues related to the quality of the available production data. In the case of hydropower production the absence of a clear relationship is probably due to the spatial distance between water source and production site. While for the Netherlands the river Rhine provides the necessary water from the Alpine region, for Hungary the same is true for the Danube. Meteorological droughts in these countries will, therefore, have limited or no effect on hydropower production.
Table 2. Correlation coefficient between de-trended cereal crop production and drought severity according to different drought indicators. Bold coefficients are significant at the 5% level.
| SPI-3 | SPEI-3 | RDI-3 | SPI-12 | SPEI-12 | RDI-12 | |
|---|---|---|---|---|---|---|
| Greece | 0.11 | 0.28 | 0.23 | 0.17 | 0.19 | 0.17 |
| Spain | 0.64 | 0.54 | 0.57 | 0.81 | 0.68 | 0.79 |
| Italy | 0.36 | 0.38 | 0.35 | 0.17 | 0.22 | 0.24 |
| Portugal | 0.45 | 0.30 | 0.39 | 0.45 | 0.32 | 0.39 |
| Albania | 0.02 | −0.08 | −0.08 | −0.01 | −0.10 | −0.16 |
| Bulgaria | 0.32 | 0.20 | 0.31 | 0.43 | 0.36 | 0.29 |
| France | 0.22 | 0.41 | 0.39 | 0.17 | 0.45 | 0.44 |
| Romania | 0.16 | 0.42 | 0.43 | −0.03 | 0.28 | 0.21 |
| Hungary | 0.39 | 0.68 | 0.60 | 0.39 | 0.41 | 0.33 |
| Switzerland | 0.18 | 0.23 | 0.36 | 0.24 | 0.16 | 0.25 |
| Austria | −0.04 | 0.13 | 0.30 | 0.10 | 0.01 | 0.24 |
| Germany | 0.16 | 0.57 | 0.54 | 0.13 | 0.05 | 0.07 |
| Poland | 0.21 | 0.01 | −0.04 | −0.14 | 0.00 | −0.03 |
| Belgium | −0.05 | 0.02 | 0.17 | −0.08 | 0.10 | 0.13 |
| UK | 0.12 | 0.18 | 0.26 | 0.24 | −0.01 | 0.08 |
| Netherlands | 0.12 | 0.05 | 0.14 | −0.07 | 0.08 | 0.05 |
| Ireland | 0.31 | 0.32 | 0.32 | 0.20 | 0.22 | 0.13 |
| Denmark | 0.04 | 0.03 | 0.12 | 0.07 | 0.10 | 0.07 |
| Sweden | −0.11 | 0.04 | 0.08 | 0.21 | 0.25 | 0.26 |
| Norway | 0.07 | −0.03 | 0.14 | 0.12 | 0.00 | 0.01 |
| Finland | −0.15 | −0.12 | 0.10 | −0.12 | 0.45 | 0.40 |
Table 3. Correlation coefficient of de-trended hydroelectric power production and drought severity according to different drought indicators. Bold coefficients are significant at the 5% level.
| SPI-3 | SPEI-3 | RDI-3 | SPI-12 | SPEI-12 | RDI-12 | |
|---|---|---|---|---|---|---|
| Greece | 0.46 | 0.40 | 0.44 | 0.59 | 0.50 | 0.50 |
| Spain | 0.27 | 0.26 | 0.34 | 0.69 | 0.69 | 0.70 |
| Italy | 0.03 | 0.02 | 0.17 | 0.30 | 0.31 | 0.34 |
| Portugal | 0.51 | 0.51 | 0.59 | 0.77 | 0.82 | 0.81 |
| Albania | 0.45 | 0.57 | 0.47 | 0.47 | 0.58 | 0.62 |
| Bulgaria | 0.35 | 0.66 | 0.45 | 0.67 | 0.62 | 0.69 |
| France | 0.36 | 0.49 | 0.49 | 0.47 | 0.53 | 0.52 |
| Romania | 0.32 | 0.58 | 0.45 | 0.29 | 0.29 | 0.28 |
| Hungary | 0.01 | 0.23 | 0.22 | 0.20 | 0.09 | 0.05 |
| Switzerland | 0.37 | 0.34 | 0.49 | 0.72 | 0.73 | 0.60 |
| Austria | 0.32 | 0.23 | 0.30 | 0.15 | 0.40 | 0.35 |
| Germany | 0.29 | 0.46 | 0.35 | 0.30 | 0.29 | 0.26 |
| Poland | 0.35 | 0.39 | 0.09 | 0.27 | 0.37 | 0.37 |
| Belgium | 0.70 | 0.75 | 0.66 | 0.50 | 0.59 | 0.55 |
| UK | 0.16 | 0.15 | 0.16 | 0.38 | 0.10 | 0.10 |
| Netherlands | −0.14 | 0.11 | 0.16 | −0.07 | −0.22 | −0.15 |
| Ireland | 0.42 | 0.51 | 0.52 | 0.42 | 0.35 | 0.27 |
| Denmark | 0.38 | 0.42 | 0.16 | 0.40 | 0. 30 | 0.31 |
| Sweden | 0.29 | 0.23 | 0.26 | 0.62 | 0.48 | 0.42 |
| Norway | 0.35 | −0.01 | 0.00 | 0.26 | 0.31 | 0.39 |
| Finland | 0.39 | 0.49 | 0.38 | 0.58 | 0.72 | 0.70 |
The drought damage functions are presented in figures 2 and 3 for the two sectors analysed. Best fit functions are shown together with their β parameter for the countries where a significant relation was found. The uncertainties (dashed lines) were computed after an error propagation analysis as detailed in the annex. Even though these uncertainties give a first idea of the possible spread of damage values, other sources of uncertainties should be taken into account as well; examples are the uncertainties related with the selection of the drought indicator and the number and characteristics of the events used to compute the functions.

Figure 2. Country specific drought-damage functions depicting the relationship between reduction in cereal crop production and drought severity. Dashed lines represent the errors estimated as depicted in the appendix.
Download figure:
Standard image High-resolution image
Figure 3. Country specific drought-damage functions depicting the relationship between reduction in hydropower generation and drought severity. Dashed lines represent the errors estimated as depicted in the appendix.
Download figure:
Standard image High-resolution imageRegarding cereal yields, a stronger than linear relation (β > 1) is observed for most of the Mediterranean countries such as Portugal, Spain and Italy. This reflects the high vulnerability of these countries where water scarcity is a tangible constraint. The United Kingdom, Romania, and Germany also show a stronger than linear relation but in lower proportions and for some cases the relation becomes almost linear. France and Denmark, on the contrary, present a limited growth relation (β < 1). These differences can be due to various factors that determine the country or region specific vulnerability, which depends on appropriate mitigation options, including appropriate technologies such as irrigation, the availability of drought resistant crops and reservoir management.
On the other side, Norway and Finland present negative values of β, suggesting a possible beneficial relationship between crop yields and drought. This might be related to the northern environment, and the often stronger and longer insolation and related higher temperatures during such events. These results agree with the findings presented in Olesen and Bindi 2002, Maracchi et al 2005, Alcamo et al 2007, and Olesen et al 2011, where climate-related increases in crop yields during drought conditions are expected in northern Europe, while the largest reductions are expected around the Mediterranean, in the South–Western Balkans and in Southern European Russia. The plot of the β parameter for selected countries as shown in figure 4 provides evidence of the regional patterns that highlight the North–South differences. These differences are explained by the different limitations to crop growth in northern and Southern European regions. Cold temperatures and short growing seasons are main limitations in Northern Europe, whereas high temperatures and persistent dry periods during summer limit crop production in Southern Europe (Olesen et al 2011).

Figure 4. Parameters α and β obtained for the relation between drought severity and reduction in cereal crop production.
Download figure:
Standard image High-resolution imageWith respect to hydroelectric power generation (figure 5), an evident relation is observed for most of the countries except for the Netherlands, United Kingdom, Germany, Denmark and Norway, where more successful drought mitigation procedures may exist. The countries that are shown to be more vulnerable (β > 1) are Albania, Portugal and Switzerland, all of which heavily relying on electricity production from hydroelectric sources (Albania 100%, Switzerland 55%, and Portugal 22%). The absence of a relationship between droughts and hydropower generation in Norway can be due to the market deregulation starting in 1990 (Amundsen et al 2006). As depicted in Amundsen et al 2006, the deregulation allowed the Norwegian market to deal with the 2002 to 2003 winter droughts thanks to good management practices. The other mentioned countries rely on a more diversified energy production and as such are less affected by drought impacts on hydropower production.

Figure 5. Parameters α and β obtained for relation between drought severity and reduction in hydroelectric power production.
Download figure:
Standard image High-resolution imageThe contribution of large and small events to the annual damage noted for a given sector can help to understand how a sector is affected by a certain natural hazard and how the risk is perceived. Typically, more attention is given to the most severe events that are associated with high damages but also with a low probability of occurrence. However, less severe but more frequent events can lead to similar damages if compared with extreme events.
Figure 6 shows the share of drought events of a certain severity to the total reduction in cereal and hydroelectric power production: both sectors have different damage behaviours. The cereal production sector is characterised by higher damages for the less severe (0 < s < 6) but more frequent drought events while the hydropower sector is mainly affected by the most severe events (s > 6).

Figure 6. Share of drought events of a severity s to the total reduction in cereal (left) and hydroelectric power (right) production.
Download figure:
Standard image High-resolution imageSensitivity analysis and model validation
In order to assess the robustness of the damage functions, a sensitivity analysis was performed, analysing how uncertainties in the input factors (type of function, selection of sample, indicator combination) propagate through the overall estimation of the damage functions. To select the best function type, the goodness of fit between the drought severity and the two production variables was assessed for the different countries assuming linear, power-law and exponential relationships. The results are shown in table 4, indicating that in most cases the power law relationship provides for the best explanation of variance. However, as the difference between power law and exponential function is often small, we estimated the goodness of fit for different samples using a jackknife procedure in order to test the stability of the relationship. Results show that power law and exponential functions perform almost equally in the case of crop production but that there is a slight advantage for the power law function in the case of hydroelectric power production. We, therefore, selected the power-law relationship for the further analysis.
Table 4. Goodnes of fit (r2) of the damage functions using different functions (linear, power-law and exponential).
| Crop production | Hydropower generation | |||||
|---|---|---|---|---|---|---|
| LINEAR | POWER | EXP | LINEAR | POWER | EXP | |
| Greece | 0.01 | 0.05 | 0.01 | 0.42 | 0.42 | 0.38 |
| Spain | 0.52 | 0.60 | 0.64 | 0.38 | 0.37 | 0.39 |
| Italy | 0.47 | 0.54 | 0.61 | 0.26 | 0.27 | 0.20 |
| Portugal | 0.60 | 0.60 | 0.58 | 0.72 | 0.72 | 0.67 |
| Albania | 0.10 | 0.08 | 0.10 | 0.59 | 0.70 | 0.71 |
| Bulgaria | 0.06 | 0.09 | 0.06 | 0.45 | 0.43 | 0.45 |
| France | 0.37 | 0.39 | 0.35 | 0.11 | 0.07 | 0.14 |
| Romania | 0.29 | 0.29 | 0.32 | 0.00 | 0.01 | 0.00 |
| Hungary | 0.52 | 0.52 | 0.55 | 0.03 | 0.02 | 0.03 |
| Switzerland | 0.01 | 0.00 | 0.01 | 0.42 | 0.43 | 0.40 |
| Austria | 0.17 | 0.13 | 0.16 | 0.11 | 0.13 | 0.09 |
| Germany | 0.17 | 0.12 | 0.22 | 0.05 | 0.04 | 0.05 |
| Poland | 0.18 | 0.18 | 0.15 | 0.31 | 0.35 | 0.26 |
| Belgium | 0.00 | 0.01 | 0.00 | 0.10 | 0.08 | 0.12 |
| UK | 0.09 | 0.08 | 0.11 | 0.00 | 0.00 | 0.00 |
| Netherlands | 0.12 | 0.20 | 0.15 | 0.09 | 0.32 | 0.17 |
| Ireland | 0.05 | 0.06 | 0.05 | 0.17 | 0.17 | 0.16 |
| Denmark | 0.28 | 0.30 | 0.27 | 0.01 | 0.00 | 0.02 |
| Sweden | 0.00 | 0.01 | 0.00 | 0.23 | 0.15 | 0.25 |
| Norway | 0.02 | 0.01 | 0.02 | 0.02 | 0.01 | 0.02 |
| Finland | 0.00 | 0.00 | 0.00 | 0.41 | 0.43 | 0.48 |
Moreover, the decision on which indicator and aggregation period to use can introduce another source of uncertainty. As shown in tables 2 and 3, some countries are significantly correlated with several indicators and aggregation periods, while this is not true for others. Examples of the former are France and Spain for the crop production and Portugal and Switzerland for hydropower generation.
Figure 7 shows the estimation of the power-law functions using different combinations of drought indicators that are correlated with the damages and in table 5 we show the goodness of fit for each indicator or combination of indicators. The estimations were performed using the SPEI-3 and SPEI-12 as well as linear combinations of both using the arithmetical average and a weighted average based on the correlations from tables 2 and 3.

Figure 7. Country specific drought-damage functions, depicting the relationship between reduction in crop production, hydropower generation and drought severity represented by the SPEI-3 (red), SPEI-12 (green), the arithmetic average between SPEI-3 and 12 (AVG, blue) and the weighted average between SPEI-3 and SPEI-12, using the normalised correlation coefficients (tables 2 and 3) as weights (WAVG, black). Dashed lines represent the errors of the estimation using SPEI-3 (red) for the reduction in crop production and SPEI-12 (green) for the reduction in hydropower generation.
Download figure:
Standard image High-resolution imageTable 5. Goodness of fit (r2) for the relationship between reduction in crop production, hydropower generation and drought severity represented by the SPEI-3, SPEI-12, the arithmetic average between SPEI-3 and -12 (AVG) and the weighted average between SPEI-3 and -12 using the normalised correlation coefficients (tables 2 and 3) as weights (WAVG).
| Sector | Country | SPEI3 | SPEI12 | AVG(SPEI3 + 12) | WAVG(SPEI3 + 12) |
|---|---|---|---|---|---|
| CROP | SPAIN | 0.622 | 0.580 | 0.654 | 0.645 |
| FRANCE | 0.283 | 0.215 | 0.277 | 0.274 | |
| HYDRO | PORTUGAL | 0.451 | 0.718 | 0.663 | 0.683 |
| SWITZERLAND | 0.046 | 0.426 | 0.309 | 0.384 |
It is evident that in general the best fit is observed for the single indicator that best represents the impact variable (SPEI-3 for crop production and SPEI-12 for hydropower generation). For the case of crop production in Spain, a small increase is observed for the aggregated indicator. However, the new fit falls within the confidence interval of the original estimation.
The opposite case is observed in Switzerland where the introduction of the SPEI-3 information reduces significantly the relationship between the drought indicators and the reduction in hydropower generation.
An example of the uncertainty related to non-climatic factors and the sample selection is provided in figure 8 for the case of inland water transportation in Germany. The left panel shows the results when considering all samples (n = 7) and the right panel the estimation without the year 2009 (n = 6). During 2009 no severe droughts were observed in Germany, but the transport performance on European inland waterways declined in the order of 15–25% due to the economic and financial crisis that hit the steel industry particularly hard and led to a severe reduction in transport demand for coal, iron ore, and metal products, but also for port-hinterland transport of containers (UNECE 2014).

Figure 8. Country specific drought-damage functions depicting the relationship between inland water transportation and drought severity in Germany. Left: all cases with relevant reduction of goods transported and right: same sample but without year 2009.
Download figure:
Standard image High-resolution imageAs shown in figure 8, the estimation considering the year 2009 shows high uncertainties (i.e. wide confidence intervals) and low correlation coefficients. The estimation performed without the 2009 outlier shows a close relationship between drought severity and inland water transport as depicted by the estimation of the coefficients of determination (r2 = 0.85 for the stronger than linear relation and r2 = 0.93 for the linear fit) and the narrower confidence intervals.
This example demonstrates the need to cross-check the information on impacts within different sectors and their relationship to the analysed hazard in order to avoid the introduction of effects not related to the hazard itself. A reduction in hydroelectric power generation or in inland waterways transportation may be determined as proportional to the reduction in river flows in a certain river basin. However, there are also other natural or even technological factors that can lead to significant changes in these sectors, which cannot be taken into account using the described methodology as they are not related to the analysed drought characteristics.
To assess the contribution of any individual source of uncertainty to the output variance, different Monte Carlo experiments were performed in a second step. This methodology is based on multiple evaluations of the model with different samples that generate different PDFs of model outputs (von Storch and Zwiers 1999).
The analysis of extreme events is directly linked with the issue of the sample size. By definition, droughts are events with a low probability of occurrence, which per-se leads to a small sample size. Adding the limited availability of impact data makes the estimation of damage functions relatively unstable. With decreasing sample size the uncertainties associated with the estimation may sharply increase.
Figure 9 shows the country specific drought-damage functions that depict the relationship between reduction in crop production and hydropower generation and drought severity in France and Spain. The functions were fitted using the original parameters of the power-law function as provided in figures 2 and 3 (red line), as well as the estimation and the family of functions associated with the bootstrap resampling (grey lines). It is shown that the members of this family vary widely, but most of the members for cereal production and all of the members for hydropower generation fall inside the error bands.

Figure 9. Country specific drought-damage functions (red line) depicting the relationship between reduction in crop production and drought severity in France and the reduction in hydropower generation and drought severity in Spain. The grey lines represent the family of functions associated with the bootstrap resampling and the dashed lines represent the estimation errors.
Download figure:
Standard image High-resolution image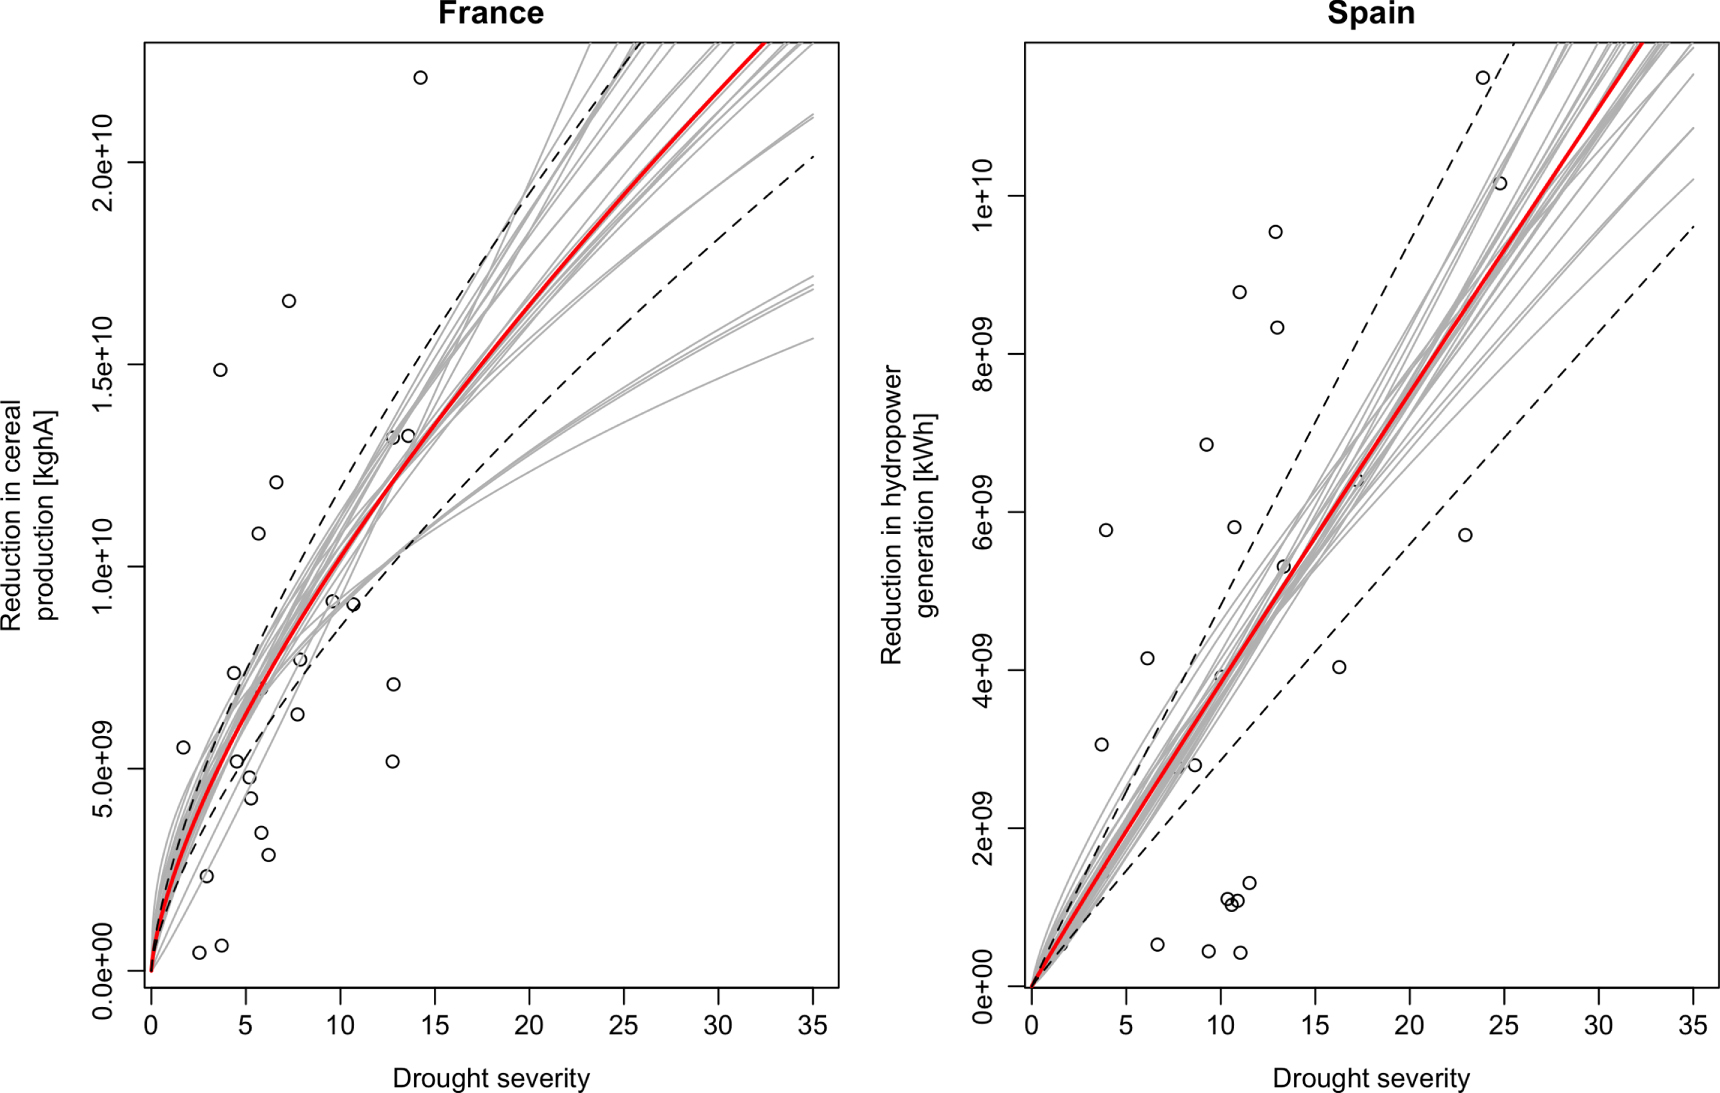
Such an approach can be used to assess and communicate uncertainties to decision makers. These uncertainties are intrinsically associated with the datasets and can help better understanding in which situations (sectors, countries, spatial resolutions) this tool is more reliable than others. Moreover this type of approach allows to measure uncertainties when the damage functions are used to assess future projections. It is, for instance, possible to use the distribution information for each member of the bootstrap as initial condition to develop drought damage scenarios. These scenarios can serve decision makers and local stakeholders to prepare action plans needed in different risk situations.
Clearly, the complexity of such models increases when more sectors and indicators are considered. In a recent research, Jenkins 2013 highlighted that modified Input–Output models could be well suited to assess the propagation of economic losses across sectors. Such models simulate the market relationships between different sectors and as such can better explain indirect impacts and provide a more comprehensive estimate of drought damage for projected climate scenarios. However, the methodology is still not well suited to consider extreme events that are rare and result in a limited sample size (Okuyama 2007). Further research is needed to obtain scientifically sound results.
Summary and conclusions
Drought has been recognised as one of the most costly natural hazards, mainly due to its diverse and cascading impacts in different economic sectors. Due to a changing climate, the frequency and severity of drought events is expected to increase in many parts of the world (Dai 2013), making it important to better understand the relationship between drought severity and related damages. Such understanding will support the development of adequate drought management plans and the adaptation to the expected changes.
This study aims at illustrating the use of damage functions to analyse drought impacts in two particular economic sectors in Europe. Results show that it is feasible to use power-law functions to better understand the links between cereal and hydropower production and drought events of different severity and that drought does affect a given sector differently in different countries, depending on their intrinsic exposure and vulnerability as well as existing mitigation measures and the countries adaptive capacity.
The scarcity of impact data and the possible influence of other natural or technological factors leading to significant changes in these sectors, however, ask for additional analyses to exclude effects that are not related to the hazard itself. To this end a bootstrap resampling is proposed that can be used to estimate the reliability of the derived damage functions and ultimately to communicate uncertainties to decision makers.
Damage functions can also be used to assess the potential future risk of droughts when combined with climatic projections in order to plan adequate mitigation and adaptation measures.
Future research should focus on the feasibility to address indirect impacts of droughts by using Input–Output models. To accomplish this objective it will be necessary to develop datasets on impacts at higher temporal and spatial resolutions (sub-annual and sub-regional) as these are still the main constraints to obtain more accurate functions. Moreover, filtered sectorial impact data should be introduced wherever possible in order to reduce the noise generated by impacts not related to natural hazards as demonstrated for the case of the inland water transport in Germany.
Acknowledgments
The authors thank the two anonymous reviewers for their valuable comments on the manuscript. The research underlying this publication was funded by the European Commission DG CLIMA as part of the GAP-PESETA project.
Appendix:: Computation of error estimation for damage functions
Let the damage function be defined as

The partial derivative of D with respect to s
Multiplying the previous equation by  ;
;
that can be reduced to

Rearranging, 