

Abstract
With increased awareness of the emissions of greenhouse gases (GHGs) and the significant contribution from the cement industry, research efforts are being advanced to reduce the impacts associated with concrete production and consumption. A variety of methods have been proposed, one of the most common being the replacement of cement as a binder in concrete with supplementary cementitious materials, such as fly ash (FA), which can have lower environmental effects. The use of FA can change the kinetics of the hydration reactions and, consequently, modify the evolution of the concrete strength over time. Yet the influence of designing structural elements to obtain the required strength at later ages has not been examined in terms of their influence on global warming potential (GWP) of concrete. This research investigates the influence of design age, in addition to mix proportions and geometric aspects, on the GWP associated with making beams, columns, and a concrete building frame. Findings suggest that while the GWP for beams is not highly dependent on concrete mixture strength, the GWP for columns is dependent on strength, thus the influence of required strength at later ages influences GWP of making columns more so than beams. For the concrete frame analyzed, a potential 45% reduction in GWP, depending on mix proportions and design age, was found. Using the findings from this research, the GWP associated with production of concrete in California could be reduced by approximately 1.8 million metric tons of CO2-eq emissions, equivalent to approximately 2% of all industrial GHG emissions in California.
Export citation and abstract BibTeX RIS

Content from this work may be used under the terms of the Creative Commons Attribution 3.0 licence. Any further distribution of this work must maintain attribution to the author(s) and the title of the work, journal citation and DOI.
1. Introduction
Globally, over 3.8 billion metric tons (Gt) of hydraulic cement, the most common binder in concrete, was manufactured in 2012 [1]. Concrete is a material composed of binder, aggregate, water, air, and, under certain circumstances, admixtures. Using the typical concrete mixture as defined by the National Ready Mixed Concrete Association [2], the global cement production correlates to approximately 38 Gt of concrete produced in 2012. The use of concrete has been shown to be a significant contributor to mass of material flows in developing urban areas, for example 75% mass flows in Beijing [3]. While countries with rapidly developing economies are consuming growing amounts of cement, the third largest producer of cement in the world was the United States in 2012 [1]. The production of cement in the United States could be calculated to have nearly 50–55 million metric tons (Mt) CO2-eq emissions [1, 4–7], which is approximately 4% of total energy-related greenhouse gas (GHG) emissions in the United States [8] and, globally, numbers closer to 7% relative contributions to GHG emissions from fossil fuels have been reported [9]. These relative percentages are susceptible to increase as the production of cement grows [1] and, due to improvements in the efficiency of new buildings and retrofits, the GHG emissions associated with material demand are claiming a larger contribution of total emissions associated with buildings [10].
While concrete is a material made of several constituents, cement has the highest associated GHG emissions [11] to the point at which some have taken to defining GHG emissions associated with the production of concrete solely in terms of cement content (e.g., [12]). These emissions have led many researchers, national, and international groups to investigate methods for reducing the emissions associated with manufacturing and use of cement in concrete. These have included investigation into methods for reduction of emissions from cement production, such as alternative fuel mixes and equipment efficiency (e.g., [7, 13]). Additionally, research into technological breakthroughs to change traditional concrete manufacturing has been undertaken, including methods such as carbon capture and storage as well as improved hydration processes (e.g., [14]). A third key area of research has dealt with the replacement of cement with supplementary cementitious materials (SCMs) that can have lower associated GHG emissions (e.g., [15, 16]).
These innovations in the production of concrete will be critical to reducing the environmental footprint of one of the world's most popular structural materials. Yet changes in cement production, or partial replacement of cement, could alter the properties of the concrete binder and thus influence the properties of concrete. A commonly noted change is the delayed rate at which concrete reaches desired compressive strength when SCMs are used (e.g. [17]): concrete strength develops as the mixture is allowed to cure over time and the replacement of cement can cause a change in the rate of this development. The changes in strength development rates of mixtures containing SCMs result from differences in hydration rates and pozzolanic reactions due to chemical composition [18, 19].
While structural code can be applied to design of concrete members at a variety of ages, common design guidelines are based on 28-day age [20]; that is, engineers design concrete members to bear the required load at the strength the concrete can achieve in 28 days. If concrete members containing SCMs are designed at 28-day strength, it is possible that more material will appear to be required to meet load demands than if designs had been made based on higher ages. Because design age can be specified by the structural designer, several private and public design projects have chosen to use higher design ages, especially when using fly ash (FA) concretes (e.g., [21, 22]). However, this concept of designing members at different ages has not yet been included in environmental impact assessments; hence age as design factor was one focus of this study.
The replacement of cement with SCMs is perhaps the most heavily researched area for reducing the GHG emissions associated with concrete production. When these SCMs are byproducts from other industries, such as FA or blast furnace slag, they are often assumed to improve the environmental impact associated with concrete by replacing cement with a material that has little to no allocated impact [11, 15]; since they are considered to be byproducts from other industries. With use of such SCMs, influences such as different compressive strength, moduli, tensile splitting strength, carbonation rates, and chloride diffusivity have been reported (e.g., [9, 23, 24]). While many properties are altered, the most prevalent method of reporting global warming potential (GWP) remains on a volume or mass basis, thus not taking changes in material properties into account [25]. This absence of consideration for the engineering design aspects in environmental impact analysis has been a documented issue in infrastructure assessment [26]. In the less common cases, when material properties have been incorporated in the assessment of the GWP of blended concrete mixtures containing SCMs, they were typically normalized based on 28-day compressive strength (e.g., [12, 16, 27, 28]). In more recent research, environmental impacts of concrete relative to compressive strength at varying ages has been analyzed (e.g., [29, 30]), yet these assessments have not considered the role strength development would play in the impacts associated with concrete members or structures. Beyond the volume, mass, and impact relative to strength units of comparison, some studies have compared impacts of concrete as structural members or building components (e.g., [24]), but such assessments are not as common as the volume or mass comparisons. Furthermore, some research has been conducted on the role of functional units for structural members both with and without consideration for time-dependent material property changes or deterioration (e.g., [31–33]); however, the role of such time-dependent mechanisms is outside the scope of this research.
The primary objective of this research is to examine the influence of strength development on the GWP associated with using FA in concrete mixtures. To accomplish this objective, the benefits of using alternative concrete mixtures with more FA are quantified for four cases: (1) production of a set volume of concrete, (2) concrete for a reinforced concrete beam, (3) concrete for a reinforced concrete column, and (4) a concrete building frame. For each of these cases, except the production of a set volume of concrete, the influence of design at different ages on the GWP associated with any given concrete mixture is investigated to quantify the level of benefits achieved through strength development of concrete.
2. Materials and methods
2.1. Materials
In this research, 25 concrete mixtures were considered based on a publication by Hedegaard and Hansen [34]. These mixtures were selected because they possess compressive strengths that fall in the range of the most common concrete strengths used in the United States, with 90% of use being below 30 MPa cylinder characteristic compressive strength, and allow for consideration of the most commonly used SCM in the United States, FA [35]. Additionally, their replacement levels of cement with FA fall within the range most commonly used in the United States, with replacement varying between 0 to over 40% and the average reported as approximately 22% replacement [2, 21, 35]. These mixtures included five concrete mixtures that use Ordinary Portland Cement (OPC) as the only binder and 20 concrete mixtures containing varying levels of replacement of cement by Class F FA by weight. These 25 mixtures contained varying water—to—binder (w/b) ratios, where binder is defined as the sum of OPC and FA. All mixtures considered were based on the same study and contained OPC as well as FA with consistent properties. The mixtures analyzed are referred to in terms of their w/b ratio and percent FA content in the binder. Table 1 contains the nomenclature used for the concrete mixtures analyzed as well as mix proportions. Table 2 contains the concrete mixtures analyzed and their associated mean compressive strengths at different ages. Additionally, the mixture nomenclature and characteristic strength assuming a normal distribution can be found in the supplementary material: appendix A. The characteristic strengths, as opposed to the mean strengths given in table 2, were used for the analysis of the functional units requiring compressive strength as a design parameter.
Table 1. Concrete mix nomenclature, water-to-binder content, percent of binder composed of fly ash, and concrete mix proportions based on data from Hedegaard and Hansen [34].
| Name | w/b (kg/kg) | %FA (%) | Cement content (kg m−3) | Fly ash content (kg m−3) | Water content (kg m−3) | Fine aggregate content (kg m−3) | Coarse aggregate content (kg m−3) | Superplastizer content (kg m−3) |
|---|---|---|---|---|---|---|---|---|
| Mix 1 1-0 | 1.00 | 0% | 200 | 0 | 200 | 846 | 1060 | 0 |
| Mix 2 0.71-0 | 0.71 | 0% | 273 | 0 | 195 | 732 | 1116 | 0 |
| Mix 3 0.56-0 | 0.56 | 0% | 351 | 0 | 195 | 670 | 1147 | 0 |
| Mix 4 0.45-0 | 0.45 | 0% | 425 | 0 | 193 | 607 | 1122 | 0 |
| Mix 5 0.38-0 | 0.38 | 0% | 507 | 0 | 195 | 565 | 1096 | 0 |
| Mix 6 0.71-0.57 | 0.71 | 57% | 106 | 141 | 176 | 696 | 1180 | 0 |
| Mix 7 0.56-0.67 | 0.56 | 67% | 106 | 211 | 176 | 624 | 1168 | 0 |
| Mix 8 0.45-0.73 | 0.45 | 73% | 108 | 288 | 180 | 562 | 1126 | 1.3 |
| Mix 9 0.38-0.77 | 0.38 | 77% | 106 | 352 | 176 | 524 | 1099 | 3.3 |
| Mix 10 0.71-0.29 | 0.71 | 29% | 180 | 72 | 180 | 721 | 1166 | 0 |
| Mix 11 0.56-0.44 | 0.56 | 44% | 176 | 141 | 176 | 650 | 1191 | 0 |
| Mix 12 0.45-0.55 | 0.45 | 55% | 180 | 216 | 180 | 577 | 1136 | 0 |
| Mix 13 0.38-0.62 | 0.38 | 62% | 180 | 288 | 180 | 531 | 1097 | 2.1 |
| Mix 14 0.33-0.67 | 0.33 | 67% | 180 | 360 | 180 | 490 | 1052 | 3.8 |
| Mix 15 0.56-0.22 | 0.56 | 22% | 246 | 70 | 176 | 660 | 1174 | 0 |
| Mix 16 0.45-0.36 | 0.45 | 36% | 252 | 144 | 180 | 593 | 1147 | 0 |
| Mix 17 0.38-0.46 | 0.38 | 46% | 252 | 216 | 180 | 544 | 1110 | 1.7 |
| Mix 18 0.33-0.53 | 0.33 | 53% | 246 | 282 | 176 | 509 | 1082 | 4.2 |
| Mix 19 0.29-0.59 | 0.29 | 59% | 252 | 360 | 180 | 465 | 1017 | 7.2 |
| Mix 20 0.45-0.18 | 0.45 | 18% | 324 | 72 | 180 | 611 | 1155 | 1 |
| Mix 21 0.38-0.31 | 0.38 | 31% | 324 | 144 | 180 | 558 | 1122 | 2.1 |
| Mix 22 0.33-0.40 | 0.33 | 40% | 317 | 211 | 176 | 520 | 1096 | 3.6 |
| Mix 23 0.29-0.47 | 0.29 | 47% | 317 | 282 | 176 | 484 | 1048 | 8 |
| Mix 24 0.38-0.15 | 0.38 | 15% | 396 | 72 | 180 | 572 | 1135 | 3 |
| Mix 25 0.33-0.27 | 0.33 | 27% | 387 | 141 | 176 | 534 | 1108 | 4 |
Table 2. Concrete mix nomenclature, water-to-binder content, percent of binder composed of fly ash, and cylinder compressive strength at different ages based on data from Hedegaard and Hansen [34].
| Name | w/b (kg/kg) | %FA (%) | Compressive strength (MPa) | |||
|---|---|---|---|---|---|---|
| 14 days | 28 days | 56 days | 112 days | |||
| Mix 1 1-0 | 1.00 | 0% | 10.6 | 12.2 | 12.6 | 12.8 |
| Mix 2 0.71-0 | 0.71 | 0% | 22.7 | 24.7 | 28.5 | 30.1 |
| Mix 3 0.56-0 | 0.56 | 0% | 30.5 | 35.5 | 36.4 | 39.7 |
| Mix 4 0.45-0 | 0.45 | 0% | 41.9 | 45.0 | 49.2 | 51.2 |
| Mix 5 0.38-0 | 0.38 | 0% | 53.8 | 56.4 | 63.3 | 65.9 |
| Mix 6 0.71-0.57 | 0.71 | 57% | 6.6 | 7.7 | 9.0 | 12.7 |
| Mix 7 0.56-0.67 | 0.56 | 67% | 7.0 | 8.4 | 10.0 | 13.5 |
| Mix 8 0.45-0.73 | 0.45 | 73% | 8.8 | 11.1 | 13.6 | 19.3 |
| Mix 9 0.38-0.77 | 0.38 | 77% | 7.8 | 9.3 | 13.9 | 18.0 |
| Mix 10 0.71-0.29 | 0.71 | 29% | 13.4 | 15.9 | 18.0 | 22.0 |
| Mix 11 0.56-0.44 | 0.56 | 44% | 18.6 | 22.0 | 25.6 | 32.1 |
| Mix 12 0.45-0.55 | 0.45 | 55% | 18.0 | 23.3 | 29.2 | 34.9 |
| Mix 13 0.38-0.62 | 0.38 | 62% | 17.9 | 21.8 | 23.8 | 34.8 |
| Mix 14 0.33-0.67 | 0.33 | 67% | 19.4 | 25.5 | 30.2 | 39.2 |
| Mix 15 0.56-0.22 | 0.56 | 22% | 26.7 | 30.0 | 34.3 | 41.0 |
| Mix 16 0.45-0.36 | 0.45 | 36% | 24.1 | 29.2 | 35.0 | 46.1 |
| Mix 17 0.38-0.46 | 0.38 | 46% | 27.0 | 32.4 | 38.1 | 46.5 |
| Mix 18 0.33-0.53 | 0.33 | 53% | 24.5 | 28.3 | 35.9 | 43.2 |
| Mix 19 0.29-0.59 | 0.29 | 59% | 34.0 | 40.6 | 48.7 | 54.1 |
| Mix 20 0.45-0.18 | 0.45 | 18% | 36.1 | 44.0 | 48.6 | 56.3 |
| Mix 21 0.38-0.31 | 0.38 | 31% | 38.0 | 41.3 | 48.5 | 54.8 |
| Mix 22 0.33-0.40 | 0.33 | 40% | 50.1 | 54.0 | 60.0 | 73.7 |
| Mix 23 0.29-0.47 | 0.29 | 47% | 42.0 | 46.5 | 58.2 | 66.6 |
| Mix 24 0.38-0.15 | 0.38 | 15% | 44.2 | 48.9 | 52.3 | 61.9 |
| Mix 25 0.33-0.27 | 0.33 | 27% | 40.0 | 49.3 | 55.4 | 63.3 |
2.2. Life-cycle assessment (LCA)
2.2.1. Goal and scope
The goal of this research was to assess the influence of design age of concrete on the environmental impacts of concrete structures. To determine the GWP associated with production of concrete mixtures, LCA, a method for quantifying energy, material, and waste flows at every stage of the material or product life cycle, was implemented. To conduct this analysis, the GreenConcrete LCA tool, developed at UC Berkeley, was implemented for each of the concrete mixtures [36]. Production of the concrete was assumed to occur in California, specifically the San Francisco Bay area. This location was chosen both because it is illustrative of how design methods could alter the GWP associated with concrete production and to act as a representative of production in California. In addition, there are available supply chain data for this location, making the analysis more robust. Current production technologies were assumed to be implemented for kiln type and cement processing.
Four functional units of comparison were considered in the assessment. The first functional unit considered was a constant volume comparison. The GWP for each of the concrete mixtures was determined based on their constituents and compared on a cubic meter basis. This was to provide a baseline for how the constituents could influence the overall GWP associated with production. However, because constituents and strength development can influence the quantity of concrete needed for an application, three applications-based functional units were also considered.
The first application-based functional unit considered was a member in bending. The length, the width, and the load applied to each beam were held constant; because each concrete mixture has different strengths and different strength development the required depth for each member varied. By allowing only the depth variable to change between members, the influence of the concrete strength on the total volume of material needed, and thus the GWP associated with it, could be quantified. The depth of the beams varied from 60 to 105 cm, depending on age and strength, with a mean of 70 cm at 28-day design age. With this change in depth, the length—to—depth ratio remained in the range of 10–12 and the reinforcement ratio remained in the range of 1–1.7%, suggesting the members remained susceptible to the same failure mode with changes to the depth. While the bending member functional unit was modeled as being reinforced with rebar, the quantity of steel was held constant and therefore not incorporated in the assessment of change in GWP. Because the reinforcement ratio and the length to depth ratio remained within a similar range for the members in bending, the use of the same amount of rebar for each member is assumed to be reasonable. The design criteria used for the beam functional unit are described in more detail in the supplementary materials: appendix B.
The second application-based functional unit considered was a concrete column controlled by an axial load in compression. For this functional unit, the height, width, and load applied were held constant and the depth of the members was considered to be variable. With each concrete mixture, again there was a different strength and rate of strength development with age requiring different depths of the member in order to satisfy design criteria. This allowed for calculation of different volumes for each concrete mixture and associated variation in GWP. The depth of the columns varied from 20 to 230 cm, depending on age and strength, with a mean of 65 cm at 28-day design age. Again, the quantity of reinforcing steel was held constant and, therefore, was excluded from the comparisons. For some of the mixtures, the low strength of the material results in large cross-sectional areas and low reinforcement ratios. Where reinforcement ratios in columns of less than 1% were noted, it is unlikely the mixtures would be used for this particular column application. This high cross-sectional area and low reinforcement ratio was noted for 4 of the 25 mixtures examined, namely Mixes 6-9 at 14 days, but for 112-day design strength all mixtures had greater than 1% reinforcement ratio. While these mixtures are still included in the comparison of the column functional unit, these mixtures would likely be considered inappropriate for a column application, except in cases where the load was lower or a higher design age was used, allowing for a smaller cross-sectional area, or in cases where higher quantities of rebar were present. The design criteria used for the column are described in more detail in the supplementary material: appendix C.
The final functional unit considered was a 10-floor concrete frame building based on a design by Bhatt et al [37]. For this analysis, the original building design called for a concrete strength of 30 MPa throughout the frame and a single column size through the height of the building. Additional materials beyond the frame, such as interior finishes, windows, etc, and the reinforcing steel were held constant, so comparisons were made based on the concrete needed for the columns, beams, slabs, and roof components of the frame. Due to a lack of design requirements for shear walls, these were assumed to be held constant and not incorporated into the analysis. Specific details on the design, volume of concrete, and loading conditions can be found in the supplementary materials: appendix D. Rather than comparing each of the concrete mixtures available, as was done for the previous two functional units described, for the analysis of the 10-floor concrete frame building, the reference case used was US average FA replacement of OPC (approximately 22% [35]) in a concrete mixture with the required strength at 28 days for the design. Alternatives were considered based on their ability to provide required design strength. Examining alternatives to the US average was selected as a method of comparison because not all concrete mixtures examined in this research provided the required strength for the building design at the ages analyzed. These alternatives included: (1) a baseline in which the use of concrete mixtures containing approximately the US average FA replacement of OPC at design ages of 14, 28, 56, and 112 days; (2) the use of concrete mixtures containing a variety of FA replacement and w/b ratios that could provide the lowest GWP, while meeting design strength criteria at 14, 28, 56, and 112 days; (3) the use of lower-strength concrete with a variety of levels of FA replacement of OPC at higher floors, as high floors do not require the same strength as lower floors, and considering change in strength at 14, 28, 56, and 112-day design age; (4) the use of 3 column sizes through the height of the structure, again, based on the need for lower strength mixtures at higher levels (this case considered the use of concrete mixtures from option (1) for the design ages of 14, 28, 56, and 112 days); (5) the use of a combination of the third and fourth considerations; and (6) the use of a combination of the second, third and fourth cases. Table 3 summarizes these alternatives.
Table 3. Parameters investigated for improvements to concrete building frame.
| Nomenclature | Definition |
|---|---|
| Baseline | Represents use of a concrete mixture with the US average fly ash use (22%) and 30 MPa compressive strength |
| Mix change (all) | Represents use of concrete mixtures that have the lowest GWP while meeting the specified strength (30 MPa) |
| Mix change (columns) | Represents use of the lowest GWP concrete mixtures that have the required strength for each column level |
| Geometric change (columns) | Represents reduction in volume of concrete used for columns at higher floor levels |
| Columns (both) | Represents a combination of two previous column changes |
| Combination | Represents a combination of all previous changes |
While use of greater quantities of SCMs or selection of greater design age can influence construction practice, it has been assumed in this work that a delay in construction time is acceptable to gain beneficial emissions profiles and to meet minimum compressive strength as well as additional design criteria. It has been noted by other authors that common codes for specifying concrete properties and speed of construction can be barriers to implementation of potentially environmentally favorable concrete mixtures [38]; however, an extended curing time of 56 days is gaining acceptance in the building industry [39]. Changes to time at which formwork can be removed were outside the scope of analysis in this investigation.
2.2.2. Life-cycle inventory
For the life-cycle inventory, raw material acquisition and processing through concrete batching were assessed. Because California produces more hydraulic cement than it consumes [1], cement was considered to be produced locally. However, based on combustion of coal, ash content of coal combusted, and the national rate of useable FA [40–42], California does not produce enough FA to meet state demands. Therefore, FA was modeled as imported from Wyoming, which is the closest state to produce excess FA at the levels that could meet California's demands. While no environmental impact was allocated to the production of FA because it can be considered to be a byproduct of coal combustion for electricity, only impacts associated with refinement and transportation of this binder was incorporated into the assessment. Transportation for cement was considered to be by truck and FA by rail. Assuming the typical aggregate-to-cement ratio for the nation (6.6:1 aggregate:binder) as reported by the National Ready Mixed Concrete Association [2], California produces enough aggregate to meet its demand, so aggregate was considered to be produced locally. Transportation of aggregate was assumed to be by truck because it was not being transported a long distance. Concrete was considered to be batched locally in the San Francisco Bay area. For the modes of transportation, transportation distances, energy mixes considered for manufacture, and technology used for concrete batching, see supplementary material: appendix E.
3. Results
3.1. Global warming potential per cubic meter of concrete
When examining the GWP for the mixtures analyzed using a cubic meter functional unit, it is clear that the mixtures with higher levels of OPC replacement by FA portray characteristics of having lower GWP (see figure 1). While higher levels of FA results in greater levels of transportation needed for the mix constituents, these increased levels of transportation are not great enough to fully offset the emissions associated with the production of cement, with the GWP from cement ranging between 5 and 35 times higher than GWP from transportation. This was to be expected because the water content was held nearly constant for all mixtures examined as were, for the most part, the aggregate contents. By holding these constituents constant, the variability in binder content resulted in being the main driver for change in GWP.
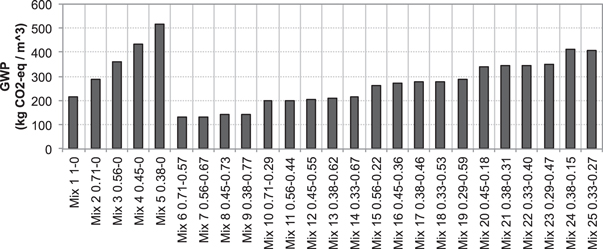
Figure 1. Global warming potential comparison based on cubic meter functional unit where mixtures are referred to by number, w/b ratio, and percent fly ash (for example, Mix 15 0.56-0.22 represents mix number 15 with a w/b ratio of 0.56 and 22% fly ash).
Download figure:
Standard image High-resolution imageFor the mixtures examined in this research, the lowest GWP was found for the concrete mixtures containing the lowest cement content. Of these mixtures, the lowest GWP was associated with the mixture containing the lowest content of FA. While this appears to be counter to the previous statement, the low GWP for the lowest cement content mixtures with less FA is a reflection of reducing cement content without the added impacts of using FA as replacement binder. When comparing mixtures with similar binder content (i.e., OPC and FA), the mixtures with higher levels of FA replacement are favorable. In contrast, the highest GWP was associated with a concrete mixture containing only cement as the binder and high cement content, namely Mix 5 0.38-0. Based solely on comparisons such as those presented in figure 1, one can draw the conclusion that using low levels of binder and especially low levels of cement would result in the lowest possible GWP. However, mechanical properties and changes in strength development differ based upon changes in binder and cement content.
3.2. Beam design as a functional unit
For the functional unit of a reinforced concrete beam with mixtures possessing different strengths and different strength development, the GWP associated with the concrete use was not found to vary significantly based on strength. Therefore, lower strengths associated with different mix proportions or design age did not play a large role in changing the GWP for the mixtures; rather, GWP varied based on mix proportions (see figure 2). This figure shows the GWP for each of the mixtures for the designed beam normalized to a designed beam using the US national average of cement replacement with FA, approximately 22% [35], with a mean compressive strength of 30 MPa at 28 days (i.e., Mix 15 0.56-0.22). The trends of the mixtures with the lowest GWP mimic the trends present in the cubic meter functional unit comparison. That is, the mixtures with higher cement content have higher relative GWP for the designed beam than the mixtures with lower cement content. Also, similar to the cubic meter functional unit comparison, the mixtures containing higher levels of FA do not have a very dissimilar GWP to the other mixtures containing the comparable levels of cement content.
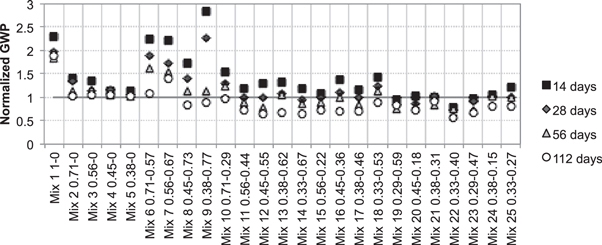
Figure 2. Comparison of concrete mixtures using beam functional units for design ages normalized to being designed with the US average concrete mixture with mean compressive strength of 30 MPa 28 days. Concrete mixtures are referred to by number, w/b ratio, and percent fly ash (for example, Mix 15 0.56-0.22 represents mix number 15 with a w/b ratio of 0.56 and 22% fly ash).
Download figure:
Standard image High-resolution imageThe most notable takeaway from these results is that increased age and the influence of strength development do not play a significant role in reducing GWP for the beam design functional unit. While concrete with higher strength allows for reduction in member depth, higher strength, whether it be from mix proportions or strength development, did not have a large enough influence on the overall volume of the beams to change the trend from that present for the cubic meter functional unit. This is a reflection of the reinforcement playing a larger role in the member design than the concrete strength.
3.3. Column design as a functional unit
When examining concrete mixtures using the column functional unit, the influence of strength and strength development, which varies between mixtures, becomes a more critical component of the definition of necessary volume than with the beam functional unit (see figure 3; again mixtures are normalized to Mix 15 0.56-0.22). For the column functional unit, an increase in design volume associated with a low strength can outweigh benefits associated with reduced cement content. For example, Mix 1 1-0 has a lower GWP per cubic meter than Mix 5 0.38-0, as was shown in section 3.1. However, when considering a reinforced column design, the low strength associated with Mix 1 1-0 results in a greater volume of concrete necessary to perform the same function as Mix 5 0.38-0. This greater volume results in the relative GWP of Mix 1 1-0 changing from being 60% lower than Mix 5 0.38-0 based on the cubic meter functional unit to 100% higher based on a column functional unit at 14-days design age. While there are differences in strength development of these mixtures, the GWP associated with the Mix 1 1-0 remains similarly higher to the Mix 5 0.38-0 at greater design ages (dropping to 85% higher GWP per column at 112 days). In addition to the high volume of material associated with the weaker concrete mixtures, it must be noted that the low reinforcement ratio for Mixes 6-9 make them unlikely to be used for the column application specified due to a low reinforcement ratio and high cross-sectional area at low ages.

Figure 3. Comparison of concrete mixtures using column functional units at for design ages normalized to being designed with the US average concrete mixture with a mean compressive strength of 30 MPa 28 days. Concrete mixtures are referred to by number, w/b ratio, and percent fly ash (for example, Mix 15 0.56-0.22 represents mix number 15 with a w/b ratio of 0.56 and 22% fly ash).
Download figure:
Standard image High-resolution imageThe general trends present in the OPC concrete are also present in the concretes containing FA; however, the influence of strength development increases with higher levels of FA replacement. For example, the concretes containing the lowest cement content ratio have lower strength than the concretes containing greater levels of cement, but, due to their relatively high FA:OPC content, they display a greater influence of strength development on their relative GWP. While on a cubic meter functional unit basis of comparison the lowest cement content concretes have a lower GWP than the other concrete considered, their lower strengths, especially at early design ages, caused them to have among the highest GWP for the column design functional unit. At higher design ages, the rapid strength development associated with the lowest cement content concrete results in their becoming more competitive with the other FA concretes, and at higher design ages of greater than 56 days, Mixes 7, 8, and 9 develop enough strength that their cross-sectional areas decrease to the point at which the reinforcement ratio is greater than 1%. However, based on the design ages considered, the lowest cement content concretes never become favorable in terms of GWP relative to the other FA concretes. Notably, the highest cement content concretes, which have a high GWP on a cubic meter functional unit basis of comparison, have among the most favorable GWP for the column design at 28 days (i.e., Mixes 22-25). While their strength development is not as great as for the other concretes containing FA between 14 and 112 days, due to their lower levels of FA replacement of cement, these concrete mixtures display a good combination of strength and GWP per cubic meter for the design application considered. The OPC/FA concretes with the second lowest cement content (Mixes 10-14) have less desirable GWP at lower design ages than the highest cement content concretes (Mixes 22-25) at low design ages by between 50% and 100% at 14 days. Yet, due to their higher strength development rates, they have similar GWP to the highest cement content concrete at 112 days. Similar trends were present for many of the median cement content concrete mixtures as well. From this analysis, the mixtures that resulted in the lowest GWP for the column design were Mix 12 0.45-0.55, Mix 14 0.33-0.67, Mix 22 0.33-0.40, and Mix 23 0.29-0.47. In these cases, the lowest GWP occurred when using 112-day design strength. While the high age of design logically results in higher strength for any given mixture and thus less material required for a column and lower associated GWP from production, the mixtures that provide the lowest GWP have notably low w/b ratio and typically high cement content. The attributes of low w/b ratio and high cement content typically are associated with high GWP concretes, but in the case where strength can contribute significantly to the volume of material needed, the high associated GWP per cubic meter of material can be outweighed.
3.4. Concrete building frame as a functional unit
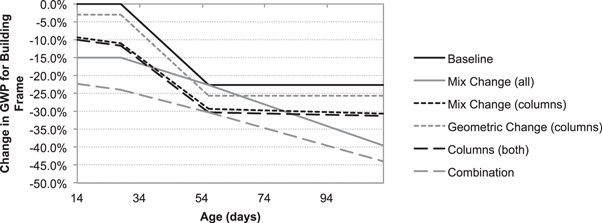
Examining the role of alterations in mix proportions and compressive strength for an entire building frame provides a context to the potential changes in GWP. For the building frame functional unit, all comparisons were made using the US average FA replacement rate of approximately 22% to obtain a concrete mixture with a characteristic compressive strength of at least 30 MPa by 28 days (i.e., Mix 20 0.45-0.18—note: FA % is similar but slightly below the US average, this mixture was chosen due to similarity in FA replacement and ability to meet strength requirements at 28 days) (see figure 4). Six alterations to the mixtures and/or structural design were examined in conjunction with the influence of using different design ages. Mixtures with approximately 20% FA replacement of OPC did not have sufficiently large compressive strength development at different design ages to offer lower GWP beyond 56 days; by changing the design age from 28 days to 56 days, a 23% decrease in associated GHG emissions was estimated. This result is not necessarily a reflection upon potential benefits associated with designing for later ages, but may rather be a perspective gained from the limited number of mixtures analyzed herein. By replacing the concrete with the lowest-GWP concrete mixture providing the appropriate strength (namely with Mix 19 0.29-0.59 at 14-day and 28-day design, Mix 15 0.56-0.22 at 56-day design, Mix 12 0.45-0.55 at 112-day design), the overall GWP of the concrete frame is approximately 15% lower if designed at 14 days than using the US average design at 28 days, but 23% lower if designed at 56 days and 40% lower if designed at 112 days. Reducing the column size at higher floors of the building, which can be done because lower loads are applied to the columns at higher levels, while still using the US average OPC/FA concrete, results in approximately 3% lower GWP at any given design age relative to using the US average FA replacement concrete at the same age. Changing the column mixture design strength requirements for each column results in between 8% and 10% lower GWP at any given design age relative to using the US average FA replacement concrete at the same age. Combining these two column design methods results in approximately 7%–12% lower GWP. Combining all methods, including using the lowest GWP concrete mixture with appropriate strength, column design methods, and strength development, results in a potential 44% reduction of GWP for the concrete frame relative to designing at 28 days with the US average FA replacements. However, designing at the highest considered design age, 112 days, results in only a 14% additional reduction beyond designing using 56-day strength.
Figure 4. Comparison of design alternatives for a concrete frame: percent change reflects the difference in GWP for each design alternative relative to designing the entire concrete frame with the US average concrete mixture with 30 MPa strength at 28 days. The 'baseline' alternative represents use of concrete mixtures that have the US average FA replacement of OPC with at least 30 MPa compressive strength at the specified ages. The 'mix change (all)' alternative represents use of concrete mixtures that possess at least 30 MPa compressive strength at the specified ages with the lowest GWP. The 'mix change (columns)' alternative represents use of the lowest GWP concrete mixtures that have the required strength for each column level. The 'geometric change (columns) alternative represents reduction in volume of concrete used for columns at higher floor levels. The 'columns (both)' alternative represents a combination of the two previous column changes. The final alternative represents a combination of all previous alternatives.
Download figure:
Standard image High-resolution image
Based on the mixtures examined in this analysis, use of the lowest-GWP concrete with appropriate strength for the building design at the highest design age has approximately 40% lower GWP than the baseline mixture. Additional improvements, such as reducing column volume at higher levels and reducing the required strength of columns at higher levels, have a smaller influence on the total GWP of the frame; this is a reflection of the columns representing approximately 25% of the volume of concrete for the frame. The reduction in GWP found in this research is not all-inclusive: had alternative mixtures been examined with different w/b ratios, different types and quantities of aggregate, different cements types, different composition FA, and different proportions of cement replacement, it is possible that even greater GWP reductions could have been found. Additionally, investigation into different types of SCMs, including the use of ternary, quaternary, etc, binder mixtures, may have resulted in different strength developments and even greater reductions in GWP. It is also possible that at higher design ages, mixtures with less cement, and thus lower associated GWP per cubic meter, would have reached desired strength and been able to replace higher GWP mixtures. However, there is a tapering off in the strength development for most concrete mixtures, and benefits beyond design of 112 days would likely not be as significant as some of the other mentioned reduction methods.
4. Discussion
The influence of strength and strength development on the GWP associated with the use of concrete was examined. We have shown that constant volume comparisons do not adequately portray differences in GWP for structural members within the boundaries of this work. While incorporation of material properties and application are necessary for adequate comparisons of concrete mixtures, it was found that concrete strength does not strongly influence the volume of concrete beams and, thus, does not play a strong role in the associated GWP. However, concrete strength does have a significant influence on the volume of concrete columns and, thus, can influence the desirability of certain mixtures with the goal of reducing GWP. Finally, this research showed that strength development and the different rates of strength development of concrete mixtures influence the ability to use certain concrete mixtures for a set application. Use of alternative concrete mixtures that require less cement can be achieved if higher design ages are specified, thus reducing associated GWP.
The value of changing design ages can be better realized by scaling up from the influence these design changes had on a building to the state of California. California is an interesting example because of large population (∼38 million people), its strong economy (eighth largest in the world) and its vulnerability to climate change [43]. In California, approximately 8.4 Mt of cement were produced in 2012, exceeding the apparent consumption of cement in the state by over 10% (based on [1]). This excess is considered here to be exported from the state. If the same assumptions are made as in the LCA from this research, the production of cement in California resulted in approximately 8.2 Mt of CO2-eq emissions in 2012. The US EPA estimates that approximately 60% of cement is used in buildings [44] suggesting in California just over 4.4 Mt of cement were used in buildings in 2012. If the building design examined in this research is used as a proxy, the amount of cement consumption that can be offset through design decisions is estimated to be 1.94 Mt using the 2012 consumption values. While offsetting cement use in the design cases examined meant replacement with more FA, and associated increase in transportation impacts, the design changes would still result in offsetting 1.8 Mt of CO2-eq emissions using the assumptions in this research, which is approximately equivalent to 2% of all industrial GHG emissions in California and just below 0.5% of total state GHG emissions [45].
Clearly, these assumptions are considerable in that there is a large variety of building types erected, with varying design requirements, and one cannot assume the improvements that can be made to a concrete frame would necessarily apply to foundations or other concrete applications that would be associated with the building sector. However, this rough approximation suggests that with simple changes in design, such as allowing for greater strength development in concrete mixtures used, there could be a significant offset in the need to produce cement and the associated emissions.
Beyond this research, considerations should be made for other types of SCMs. The research presented assumes varying levels of Class F FA, which has pozzolanic properties, but is not cementitious like certain other SCMs, such as Class C FA or ground granulated blast furnace slag. It is possible that with greater levels of cement replacement with cementitious binders, relative changes in emissions would be altered using the presented design parameters. Additionally, while the United States is currently producing more FA than it is using in the concrete industry [42], it is possible in the future that less FA will be available or alternative SCMs will seem more desirable, whether it be due to availability or to their contribution to mechanical properties.
5. Conclusions
This research assessed the role of Class F fly ash use, strength, and strength development on the GWP estimated for structural concrete. Four functional units of comparison were used: (1) a constant volume; (2) a reinforced beam design; (3) a reinforced column design; and (4) the use of different concrete mixtures in a concrete building frame. Analyses were conducted at four design ages to examine the influence of strength development on the GWP of the designed members and the concrete frame. Results showed that strength development and the different rates of strength development of concrete mixtures influence the potential use of certain concrete mixtures for a set application. The use of alternative concrete mixtures that require less cement can be achieved if higher design ages are specified, thus reducing associated GWP.
From these results, it is clear that the influence of design requirements and strength development can play a large role in the GWP associated with materials for construction of structures: up to 40% reduction for the building frame analyzed in this research. While some analyses of concrete building frames have suggested higher potential reduction in GHG emissions through the use of SCMs (e.g., 50%–80% [46, 47]), such analyses have drawn comparisons to concrete that did not contain the SCM being investigated herein, which is Class F fly ash. Additionally, these assessments were conducted by either assuming an equivalent cementitious relationship between the SCM and cement, or did not address potential changes in strength. When comparisons have been drawn for use of SCMs in concrete building frames of structural members considering strength properties, reduction of GHG emissions have been approximated to be on the order of 15% (e.g., [11, 16]), which is lower than the reductions estimated in this research. However, the mixtures examined herein represent a very small subset of the possible concrete mixtures. Additionally, the influence of service-life of the structure, the durability of the different mixtures, and the end-of-life effects (e.g., [48]), and local and regional variations in supply chains and emissions (e.g., [49, 50]) were excluded from the comparisons drawn in this research. In future work, the effects of in-use and out-of-service concrete properties will be examined for their potential to influence the GWP of the built environment.
Acknowledgments
SM gratefully acknowledges the support of the University of California President's Postdoctoral Fellowship Program. This work represents the views of the authors, not necessarily those of the sponsor.