

Abstract
In this study, we explored the relationships between the satellite-retrieved fire counts (FC), fire radiative power (FRP) and aerosol indices using multi-satellite datasets at a daily time-step covering ten different biomass burning regions in Asia. We first assessed the variations in MODIS-retrieved aerosol optical depths (AOD's) in agriculture, forests, plantation and peat land burning regions and then used MODIS FC and FRP (hereafter FC/FRP) to explain the variations in AOD characteristics. Results suggest that tropical broadleaf forests in Laos burn more intensively than the other vegetation fires. FC/FRP-AOD correlations in different agricultural residue burning regions did not exceed 20% whereas in forest regions they reached 40%. To specifically account for absorbing aerosols, we used Ozone Monitoring Instrument-derived aerosol absorption optical depth (AAOD) and UV aerosol index (UVAI). Results suggest relatively high AAOD and UVAI values in forest fires compared with peat and agriculture fires. Further, FC/FRP could explain a maximum of 29% and 53% of AAOD variations, whereas FC/FRP could explain at most 33% and 51% of the variation in agricultural and forest biomass burning regions, respectively. Relatively, UVAI was found to be a better indicator than AOD and AAOD in both agriculture and forest biomass burning plumes. Cloud–Aerosol Lidar and Infrared Pathfinder Satellite Observations data showed vertically elevated aerosol profiles greater than 3.2–5.3 km altitude in the forest fire plumes compared to 2.2–3.9 km and less than 1 km in agriculture and peat-land fires, respectively. We infer the need to assimilate smoke plume height information for effective characterization of pollutants from different sources.
Export citation and abstract BibTeX RIS

Content from this work may be used under the terms of the Creative Commons Attribution 3.0 licence. Any further distribution of this work must maintain attribution to the author(s) and the title of the work, journal citation and DOI.
1. Introduction
Biomass burning is an important source of aerosols and greenhouse gas emissions in several regions of the world including Asia (Seiler and Crutzen 1980). The causative factors of biomass burning vary by region. For example, in northeast India, Eastern Ghats, northeast Myanmar, Laos and Cambodia, biomass burning has been mainly attributed to slash and burn agriculture (Toky and Ramakrishnan 1983, Prasad et al 2002, 2008, Palm et al 2013). In northwestern Thailand, the Mekong Delta in southern Vietnam, and the Punjab region of India, most of the biomass burning is attributed to agricultural residues. Farmers burn crop residues after harvest to control pests and weeds, improve soil fertility through ash and to facilitate planting of new crops (Gadde et al 2009, Taylor 2010, Vadrevu et al 2011, Kharol et al 2012, Sahu and Sheel 2014). In contrast, forests in the peat land burning for oil palm plantations is most common in Indonesia, Malaysia and Papau New Guinea (Carlson et al 2013). Also, vegetation and peatland fires in Southeast Asia have been attributed to a combination of El Nino-induced droughts and anthropogenic land-use changes (Langner et al 2007, Gaveau et al 2014). Several studies have shown that aerosols and pollutants from biomass burning can be transported long distances and persist for weeks to months, impacting not only air quality but also biogeochemical cycles, atmospheric chemistry, weather, and climate (Radojevic 2003, Cristofanelli et al 2014, Reddington et al 2014). In addition, biomass burning pollutants can have significant health impacts with increased respiratory ailments, eye irrigation, medication use and exacerbated asthma (Laumbach and Kipen 2012). It is therefore important to characterize the emissions from biomass burning sources more accurately.
One of the important indicators of aerosol amounts in the atmospheric column is aerosol optical depth (AOD), which is a measure of atmospheric extinction through a vertical column of atmosphere (Carmichael et al 2009). The aerosol components contributing to AOD include soot, sulfates, organics, dust, etc., and include both natural and anthropogenic sources (Barnaba and Gobbi 2004). A number of ground-based measurement stations of the AErosol RObotic NETwork (AERONET) exist in the world (Holben et al 1998). The AERONET consists of CIMEL sun/sky radiometers capable of retrieving aerosol optical products at discrete wavelengths ranging from 440nm (visible) to 1020 nm (near IR) (Eck et al 1999, Schuster et al 2006). The measurements from AERONET includes AOD, precipitable water, fine and coarse mode AOD including fine mode fraction, sky and surface radiance for bi-directional reflectance distribution function Due to the large temporal and spatial variability in aerosol composition and abundance, satellite retrievals of AOD became more useful for characterizing aerosols in diverse regions of the world (Myhre 2009). For example, MODIS AOD is retrieved using multiple channels onboard the Terra and Aqua satellites beginning in 2000 and 2002, with separate algorithms for oceans (Tanré et al 1997) and land (Kaufman et al 1997). The AOD's are derived by the inversion of the MODIS-observed reflectance using pre-computed radiative transfer look-up tables based on aerosol models (Remer et al 2002).
Satellite observations such as AOD can be a powerful tool for monitoring of atmospheric pollution if they can be related to the underlying emission sources, especially in real-time. Specific to biomass burning emissions, active fire detection and radiative power products are being used in emissions estimation in real-time such as through the Global Fire Assimilation System. The system is continuously refined to account for fire-emission amounts (Kaiser et al 2012). To make such operational systems robust, there is a need to evaluate and refine fire–aerosol relationships in multiple regions. Specific to Asia, most of the biomass burning aerosols are often mixed from fossil fuel combustion and dust emissions (Kaskaoutis et al 2009, Bucci et al 2014, Mishra et al 2014). In such a context, an important question to address is 'how much of the AOD increase is due to biomass burning and how well do satellite fire retrievals explain AOD variation?'
In this study, we characterize fire–aerosol relationships in Asia. We first assessed the variation in MODIS-retrieved AOD's in diverse biomass burning regions pertaining to agriculture, forests and plantation burning. In addition, we addressed the following questions: How well do satellite-derived fire products (fire counts (FC) and fire radiative power (FRP) (hereafter FC/FRP) correlate with different aerosol indices such as AOD, UV aerosol index (UVAI) and aerosol absorption optical depth (AAOD)? Is FRP a better indicator than FC in relating to AOD, AAOD and UVAI? What are the typical smoke plume heights in the biomass burning regions of Asia? How do smoke plume heights influence fire-AOD, AAOD, UVAI relationships? How do the correlations vary over different burning regions (i.e. agriculture versus forest versus peatland) during the peak biomass burning months? We addressed these questions using MODIS, Ozone Monitoring Instrument (OMI) and Cloud–Aerosol Lidar and Infrared Pathfinder Satellite Observation (CALIPSO) datasets.
2. Datasets and methods
We selected ten different biomass-burning windows in Asia to characterize fire–aerosol relationships (figure 1). Each window was comprised of 3 × 3 one-degree resolution cells (each cell with 111.3 sq.km). The dominant vegetation type burned in each window and the peak months of biomass burning are given in table 1 and figure 1. Punjab located in the northwestern region of India is dominated by rice–wheat crop rotations where agricultural residue burning is prevalent (Vadrevu et al 2011, 2013). Eastern Ghats are a range of discontinuous mountains situated on the east coast of India. They run from West Bengal state in the north, through Odisha and Andhra Pradesh to Tamil Nadu in the south passing some parts of Karnataka State. Biomass burning in Eastern Ghats is mostly due to slash and burn. Northeast India comprises of seven-different states in India which includes Assam, Arunachal Pradesh, Manipur, Meghalaya, Mizoram, Tripura and Nagaland. Slash and burn agriculture is most common in northeast India. The other regions include north-western Thailand with dominant rice–maize crop burning, Laos and Eastern Myanmar with tropical broadleaf forest burning, southern Vietnam (Mekong delta) with rice residue burning and Indonesia with forest/peat land fires.

Figure 1. Study area location map with biomass burning regional windows.
Download figure:
Standard image High-resolution imageTable 1. Biomass burning regions with peak biomass burning months and the type of biomass burnt.
| Site | Peak biomass burning months | Dominant vegetation burnt |
|---|---|---|
| Thailand | February–April | Rice–maize crop residues |
| Southern Vietnam | February–April | Rice residues |
| Punjab, India-summer | March–May | Wheat residues |
| Punjab, India-winter | October–December | Rice residues |
| Riau, Indonesia | July–September | Forest/peat land fire mix |
| Kalimantan, Indonesia | July–September | Peat land fire mix |
| Eastern Ghats, India | February-April | Tropical mixed deciduous forest |
| Northeast India | March–May | Tropical evergreen forest |
| Eastern Myanmar | February–April | Broad leaf deciduous forest |
| Laos | February–April | Broadleaf forest |
We used the MERIS Globcover land cover dataset (version 2.3) for inferring the land cover types. The data set contains 22 separate land cover classes created from cloud-free mosaics of MERIS surface reflectance data and vegetation indices at a 300 m spatial resolution (Bicheron et al 2008). For characterizing the fire activity and FRP, the dominant land cover category was inferred to each biomass burning window based on a majority filter and the dominant vegetation type burnt based on the literature.
For characterizing fires and FRP, we used daily active fire detections from a combination of the MODIS instruments onboard the Aqua and Terra satellites. The two MODIS sun-synchronous, polar-orbiting satellites pass over the Equator at approximately 10:30 a.m./p.m. (Terra) and 1:30 p.m./a.m. (Aqua) with a revisit time of 1 to 2 days. The MODIS Advanced Processing System processes the resulting data using the enhanced contextual fire detection algorithm (Giglio et al 2003) combined into the Collection 5 Active Fire product. For this study, we analyzed the daily FC and FRP data for the peak biomass burning periods from 2005 to 2012 and data with more than 95% confidence level (Giglio 2009). Corresponding to the similar time-period, we used daily MODIS AOD products (MOD08_D3.005 and MYD08_D3.005) at 550 nm. To assess the statistical nature of AOD data during the peak biomass burning months in different regions of Asia, we performed a frequency analysis. The MODIS AOD data were fitted to a Gaussian distribution to infer location and scale parameters as
where A is the amplitude, xc is the center of the peak amplitude, and  (sigma) is the width at half peak amplitude.
The AAOD is a columnar measure of concentration of near-UV absorbing aerosol particles such as smoke and mineral dust and is retrieved from the OMI (Bucsela et al 2008). We used the AAOD daily product at 500 nm (OMAERUVd.003). In addition, we also used UV aerosol index (UVAI) that detects the presence of UV-absorbing aerosols such as dust and soot. UVAI is based on a spectral contrast method in a UV region where the ozone absorption is very small. It is the difference between the observations and model calculations of absorbing and non-absorbing spectral radiance ratios. For OMI, AI is defined as
Positive values of AI generally represent absorbing aerosols (dust and smoke) while small or negative values represent non-absorbing aerosols (sulfate, sea-salt) and clouds (Torres et al 2007). We specifically used the daily product (OMTO3d.003) to infer UVAI variations. Both the AAOD and UVAI variations were assessed using histograms with mean and standard deviation. To address fire-AOD, AAOD and UVAI relationships, we used linear regression with 95% confidence interval bands.
To attribute the differences in fire-AOD relationships, we used the CALIPSO data. The vertical distribution of aerosol information is inferred through the analysis of backscatter measurements provided by the Cloud–Aerosol Lidar with Orthogonal Polarization (CALIOP) instrument onboard the CALIPSO satellite of the NASA A-Train (Winker 2007, Hunt et al 2009). The CALIPSO product is highly useful in discriminating aerosol layers from clouds (Liu et al 2009), categorizing aerosol layers as one of six subtypes (dust, marine, smoke, polluted dust, polluted continental, and clean continental; Omar et al 2009), and for estimating the optical depth of each layer detected (Vaughan et al 2004). In this study, we specifically used the CAL_LID_L1-ValStage1-V3-30 datasets; averaged three to four mostly night-time passes during the peak biomass burning periods for each window as the CALIPSO provides information every 16 days (Winker 2007). We used the total attenuated backscatter coefficient at 532 nm and smoke altitude information for characterizing aerosol concentrations during the biomass burning months for different regional windows (figure 1).
3. Results
3.1. FC variations (2005–2012)
The sum of FC for the peak biomass burning months in a typical 3 × 3 one degree resolution window for different biomass burning regions are shown in box and whisker plots with the bottom and top of the box representing first and third quartiles, the band inside the box with median values, and the tails representing the minimum to the maximum FC (figures 2(a) and (b)). In agricultural biomass burning regions, highest FC were found during the Punjab winter season (1350FC) followed by Thailand, Punjab summer and Southern Vietnam. The median FC values were higher for Punjab winter data compared to the others (figure 2(a)). Of the different regions, Laos with the broadleaf forest burning had the highest FC (2596) and lowest FC in Riau, Indonesia including the median values (figure 2(b)).

Figure 2. (a)–(d) Variations in fire counts (FC) (a), (b) and FRP (c), (d) in different biomass burning regions. The box and whisker plots show minimum to maximum values in FC and FRP, respectively. Figures 2(a) and (b) refer to agricultural burning regions; whereas except for Riau and Kalimantan (forest/peat land mix fires), the other regions in (b) and (d) refer to forest biomass burning regions. Refer to table 1 for the peak biomass burning months and dominant vegetation type burned.
Download figure:
Standard image High-resolution image3.2. FRP variations
Amongst the agricultural biomass burning regions, maximum FRP was found for Thailand (318.3 MW) followed by Punjab during summer (figure 2(c)). Among the forest, plantation and peat land fires, Laos had the highest FRP (630.7 MW) and lowest for Kalimantan peat land fires (338.8 MW) (figure 2(d)). These results clearly suggest more intense biomass burning from tropical broadleaf forests (Laos) than from agriculture and peat land fires.
3.3. AOD variations
Biomass burning activities are expected to increase AOD's compared to the background (Badarinath et al 2007, 2009, Eck et al 2009). Figures 3(a)–(j) summarizes the MODIS-retrieved AODs based on the fitted Gaussian model. For the normal distribution, the location and scale parameters correspond to the mean (μ) (given as Mu in figures) and standard deviation (sigma). For example, in the entire dataset, the mean AOD was relatively high for Laos (μ = 0.75) broadleaf forest burning (figure 3(h)) compared to the other vegetation types including agriculture categories 3(a)–(d). Similarly, Riau province, Indonesia with the forest/peat land mix fires (figure 3(i)) had the highest sigma values (0.592) compared to the other forest burning regions. Among the forest types, tropical mixed deciduous forest in Eastern Ghats (figure 3(e)) had the lowest mean AOD (0.361) and sigma (0.178). Further, among the crop residue burning regions, Punjab, India had the highest mean both in summer (figure 3(a)) as well as winter (figure 3(b)) (μ = 0.621 and 0.633, respectively), whereas, southern Vietnam with rice residue burning (figure 3(c)) had the lowest mean AOD (0.441). We also note that forest/peat land mix biomass burning regions had relatively higher standard deviations indicating higher variability in AOD compared to the agricultural regions.
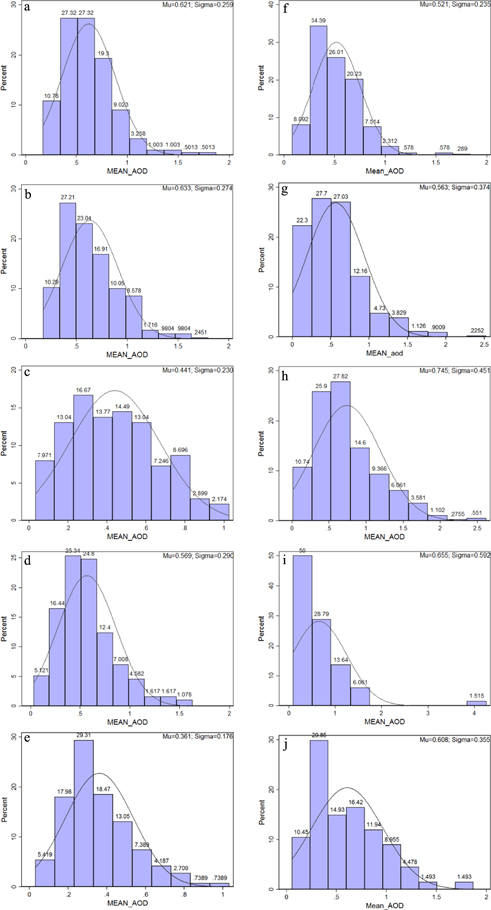
Figure 3. (a)–(i) AOD Frequency plots with normal distribution for different biomass burning windows. Mean and sigma values are also shown in the plots. (a) Punjab, summer, India; (b) Punjab, winter, India; (c) Southern Vietnam; (d) Thailand; (e) Eastern Ghats, India; (f) Northeast India; (g) Eastern Myanmar; (h) Laos; (i) Riau, Indonesia; (j) Kalimantan, Indonesia.
Download figure:
Standard image High-resolution image3.4. AAOD variations
AAOD variations for different sites are shown as histograms with mean and standard deviation (figures 4(a) and (b)). Among the agricultural biomass burning regions, Punjab during the summer season had the highest mean AAOD (0.075) and lowest in Southern Vietnam (0.038) (figure 4(a)). The standard deviation in AAOD values was similar (0.044) for Punjab, Southern Vietnam, and Thailand and lowest during the Punjab winter season (0.036) (figure 4(b)). Among the forest, plantation and peat land fires, Laos and Myanmar with forest biomass burning had the highest AAOD (0.117) and Eastern Ghats the lowest (figure 4(b)).

Figure 4. (a)–(d) Variations in AAOD (a), (b) and UVAI (c), (d) in different biomass burning regions. The column bar graphs show mean with standard deviation.
Download figure:
Standard image High-resolution image3.5. UVAI variations
Similar to AAOD, Punjab during the summer season showed highest mean UVAI (1.83) (figure 4(c)). Among the forested biomass burning regions, Laos had the highest mean UVAI (1.58) and the lowest for the peat-land fires in Kalimantan (0.87) (figure 4(d)).

Figure 5. (a)–(c) Smoke plume characteristics in different biomass burning regions retrieved from CALIPSO data. Specific biomass burning regions are highlighted in blue elliptic circles. (a) Laos with smoke plume altitude (∼5.3 km) representing broad leaf forest burning; (b) Kalimantan, Indonesia with smoke plume altitude (800 m) representing peat-land fires; (c) Punjab, India, smoke plume heights (2.3 km) during summer agricultural residue burning. Polluted dust aerosols above 5 km can also be seen in the blue elliptic circle in orange color (in contrast to smoke in black color).
Download figure:
Standard image High-resolution image3.6. FC-AOD and FRP-AOD correlations
FC-AOD correlations (figures A1(a)–(i) in appendix) in different agricultural regions did not exceed 20% (figures A1(a)–(d) in appendix). Highest FC-AOD correlations were found for Thailand and Punjab winter burning (both with r2 = 0.20 (figures A1(d), (b)) and lowest for Punjab-summer burning (r2 = 0.08) (figure A1(a)). With the exception in southern Vietnam, FRP-AOD correlations were consistently weak in different agricultural systems and less than FC-AOD relationships. FC-AOD correlations in forest, plantation and peat land fires were relatively higher than the agricultural systems with highest correlation (r2 = 0.34) in Myanmar A1(g) and lowest in Riau province (r2 = 0.02) (figure A1(i)). FRP-AOD correlations were relatively higher for Myanmar (r2 = 0.40) (figure A3(g)) compared to the others.
3.7. FC-AAOD and FRP-AAOD Correlations
Our results indicate comparatively lower correlations between FC-AAOD and FRP-AAOD in agricultural systems than in forest systems (figures A1–A2(a)–(i), appendix). In agricultural systems, the highest FC-AAOD correlation was found for Thailand (r2 = 0.29) (figure A1(d)) and lowest for southern Vietnam (r2 = 0.078) (figure A1(c)). Further, FC-AAOD and FRP-AAOD correlations were almost similar in agricultural systems. Among the forest biomass burning regions, the highest FC-AAOD correlation was in Laos (r2 = 0.53) (figure A1(h)) and lowest in Riau province (r2 = 0.18) (figure A1(i)).
3.8. FC-UVAI and FRP-UVAI correlations
These correlations in agricultural systems were much stronger than FC-AOD and FC-AAOD correlations (figures A1–A4(a)–(j), appendix). Amongst the agricultural systems, FC-UVAI correlation was highest in Thailand (0.33) (figures A2(d)) and lowest during the Punjab-summer season (r2 = 0.14) (figure A2(a)). FRP-UVAI correlations were similar to FC-UVAI correlations in agricultural systems. Further, FC-UVAI correlations in forest, plantation and peat land fires were relatively higher than the agricultural systems with the highest correlation in Laos (r2 = 0.51) (figure A2(h)) and lowest in Riau province (r2 = 0.20) (figure A2(i)). Also, FRP-UVAI correlations were relatively stronger for forests than agriculture and peatland fires.
In summary, the correlation analysis suggested the following: (a) The FC/FRP versus AOD, AAOD and UVAI correlations were stronger for forest, plantation and peat land fires than the agricultural fires; (b) Among the aerosol indices, UVAI was more strongly correlated with FC or FRP followed by AAOD and AOD in both forest, peat land and plantation/peat land mix fires than the agricultural fires; (c) Our results indicate that that the sum of FRP was better correlated with UVAI than AOD or AAOD in forest biomass burning regions. Further, we found UVAI as better indicator than AOD or AAOD and correlating well with FRP than FC in forest, plantation and peat land fires.
3.9. CALIPSO observations
In table 2, CALIPSO-derived 532 nm backscatter values as well as smoke plume heights for different biomass burning regions and aerosol sub-types with plume heights for sample regions in figures 5(a)–(c). Vertical profiles of aerosol concentrations showed maximum concentrations over the forested regions compared to the agricultural biomass burning sites (table 2). Specific to the agricultural residue burning sites, aerosol loading is found to be highest for Thailand (3 × 10⁻²/sr/km) followed by Punjab-winter season (4.5 × 10⁻³/sr/km) and lowest for southern Vietnam. Aerosols reaching the highest altitude have been noted for Thailand (3.9 km) and lowest for southern Vietnam (2.2 km). Eastern Ghats, India as well as Kalimantan and Riau province, Indonesia had relatively low smoke plume altitudes than other forest biomass burning sites.
Table 2. Smoke plume and Polluted dust altitudes for different biomass burning regions retrieved using CALIOP data. Highest smoke plume altitudes (5.3 km) can be seen for Laos tropical broad-leaf forest biomass burning and lowest for Kalimantan, Indonesia peat land fires (800 m). Relatively higher backscatter values were noted for forest biomass burning sites compared to the agriculture and peat land fires.
| Site | Smoke altitude (Km) | Polluted dust altitude (Km) | CALIPSO 532 nm total attenuated backscatter, km−1 sr−1 |
|---|---|---|---|
| Thailand | 3.9 | 2.8 | 3 × 10⁻² |
| Southern Vietnam | 1.3 | 2.2 | 4 × 10⁻³ |
| Punjab, India-summer | 2.3 | 5.2 | 2.5 × 10⁻³ |
| Punjab, India-winter | 2.5 | 2.9 | 4.5 × 10⁻³ |
| Riau, Indonesia | 3.2 | 3 | 5.0 × 10⁻³ |
| Kalimantan, Indonesia | 800 m | 1 | 4.5 × 10⁻³ |
| Eastern Ghats, India | 3.2 | 3.6 | 5.0 × 10⁻³ |
| Northeast India | 4.8 | 4.9 | 7.0 × 10⁻² |
| Eastern Myanmar | 4.9 | 2.5 | 5.5 × 10⁻³ |
| Laos | 5.3 | 3.5 | 6.5 × 10⁻² |
4. Discussion
The above results suggest that a broad distinction can be made between the aerosol properties and smoke plume heights of agricultural versus forest biomass burning regions. Most of the forest biomass burning regions had relatively higher median FC and FRP. Results clearly suggest that tropical broadleaf forests in Laos burn more intensively (higher FRP) than the other forest types, peat lands as well as agricultural regions. Higher FRP from forests may be attributed to relatively higher biomass per unit area compared to agriculture and peatlands. However, more verification is needed to delineate FRP variations in the field. As in several other studies (Ramanathan et al 2001, Eck et al 2009, Lin et al 2014), we noted increase in AOD during the biomass burning months. The mean AOD during the peak biomass burning periods in the Laos exceeded 0.75. Similarly in the agricultural biomass burning regions mean AOD was greater than 0.60 in Punjab summer as well as during winter residue burning. Although AOD is a good indicator of overall air pollution, increase in AOD may be attributed to a variety of other such as dust aerosols (Kim et al 2007, Vadrevu et al 2011). Further, MODIS AOD can only be retrieved under clear-sky conditions and under partially cloudy skies the probability of subpixel cloud contamination can be larger (Xia et al 2013).
The main aerosol released from biomass burning that causes large variations in the atmospheric chemistry and radiation budget is black carbon, which is the optically absorbing part of the carbonaceous aerosols (Saha and Despiau 2009). In particular, OMI AAOD is an indicator of absorbing carbonaceous aerosols resulting from biomass burning activity (Torres et al 2010). The AAOD values for agricultural fires varied from 0.03–0.07 to 0.08–0.11 for the forest/plantation and peat land mixed fires. These values clearly suggest biomass burning from forest fires release much more absorbing aerosols than the agricultural fires. The AAOD values reported for forest biomass burning in our study were comparatively lower than the AAOD values reported for fire plumes in South America and Central Africa. For example, Torres et al (2010) during the five-year analysis period reported the peak monthly AAOD values in the range of 0.08–0.15 during September in the South America. They also reported peak monthly AAOD values between 0.08 and 0.12 during August in Central Africa. Although we observed relatively higher FC-AAOD and FRP-AAOD correlations for the forest/plantation peat land mix fires than the agricultural fires, the correlation within the sites between FC and FRP with AAOD were not much different. Further the higher correlations observed between FC/FRP-AAOD compared to FC/FRP-AOD suggests AAOD as a better indicator of absorbing aerosols for forest and plantation peat land mix fires.
Specific to the OMI-UVAI, earlier, Torres et al (1998, 2007, 2010), Hsu et al (1999), and Ginoux and Torres (2003) noted an important sensitivity of OMI to UV absorbing aerosols as a function of smoke plume heights. Also, Torres et al (1998, 2012) showed that the magnitude of the positive AI depends on the AAOD and height of the aerosol layers. They also showed that AI signal is meaningful above 0.5 and AI signal is amplified when the absorbing layer lies above the clouds. In essence, OMI AI can be retrieved when mixed with clouds but its sensitivity increases significantly when the absorbing aerosol layers are located above clouds (Xia et al 2013). In addition, Badarinath et al (2009) and Guan et al (2010) have shown increasing AI greater than 1.5 in biomass burning plumes. Similar to these studies, we found UVAI to be a good indicator of enhanced aerosols from biomass burning, as the values were significantly high varying from 1.0 to 1.8 in agricultural biomass burning plumes and 0.8–1.58 UVAI in forest and plantation/peat land mix fires. Consistently strong correlations (0.40–0.51) between FC-UVAI and (0.40–0.52) between FC-FRP were observed among the forest fires in Eastern Ghats, Northeast India, Myanmar and Laos compared to FC/FRP-AOD and may be attributed to release of smoke plumes above clouds that could be effectively detected by OMI data (Torres et al 2010) compared to MODIS. In contrast, the relatively weak FC/FRP-UVAI correlations in peat and agricultural biomass burning regions may be attributed to low smoke plumes heights. To test the relative differences in smoke plume heights in agricultural and forest and plantation peat land mix fires, we evaluated the CALIPSO data.
Large amounts of smoke aerosol can be injected into the atmosphere as a result of biomass burning. Literature review suggest that, unlike clouds, thin smoke plumes have a weak 532 nm total attenuated backscatter signal and dense plumes may have a 532 nm backscatter signal similar to clouds (Winker 2007, Omar et al 2009). In our case, the overall CALIPSO backscatter values at 532 nm were considerably higher for the forest biomass burning sites than the agricultural sites (figures 5(a)–(c)).
For example, Mishra et al (2014) reported 2.32–3.58 × 10⁻³ sr km−1 for the Indo-Ganges region close to our reported values of 2.5 × 10⁻³ sr km−1 for Punjab during the summer biomass burning region. In the Punjab winter biomass burning season, we observed higher backscatter values compared to the summer. This may be due to relatively low dust signal during winter compared to the summer. High smoke plume altitudes for the dust aerosols can be seen in figure 5(c) for the Punjab summer season. We also note comparable smoke plume heights for Punjab during both summer and winter. Overall, the smoke plume heights for agricultural regions were considerably lower than the forest biomass burning sites. Further, in Kalimantan, Indonesia lowest smoke plume heights were observed with less than 1 km. Similar results were reported by Tosca et al in the range of 709 ± 14 m on Borneo and 749 ± 24 m on Sumatra and attribute it to low fire intensities from smoldering peat-land fires compared to the large boreal crown fire plumes of Alaska, or the higher-intensity grass fires of Australia (Kahn et al 2008, Mims et al 2010). Further, in our study, UVAI values varied from 0.87 to 1.87 in the Kalimantan region compared to 1–02–4.2 UVAI values observed for other forest biomass burning regions. These differences clearly suggest increased pyro-convection of aerosols over the forest biomass burning regions than the agriculture as well as peat-land fires thus impacting FC/FRP-AOD, AAOD and UVAI correlations. As UVAI is sensitive to aerosols that aloft above the clouds, it can be used effectively in conjunction with AAOD and FC/FRP to relate to biomass burning aerosols in forest biomass burning regions. We also found smoke altitudes as key for relating FC or FRP with AOD, AAOD, UVAI in different biomass burning regions of Asia. More specifically, relating FC/FRP to UVAI may be more justified than using AOD alone as the UVAI is a robust indicator of absorbing aerosols mainly from biomass burning compared to AOD which is mixed signal from several other aerosols apart from biomass burning. For resolving inter-annual differences in FC/FRP and aerosol indices, more in-depth studies are needed. Variations in FC/FRP and correlations with the other atmospheric satellite data products suggested distinct patterns among different biomass burning regions and the significance of UV based aerosol index. We also infer the need to assimilate smoke plume height data such as from CALIPSO for operational monitoring of pollutants from different sources including biomass burning to reduce uncertainties.
5. Conclusions
Fire–aerosol characteristics were studied using daily multi-satellite data during the peak biomass burning periods in different regions of Asia. MODIS FC as well as FRP products were useful in characterizing fire events and intensities. We found relatively lower FRP's over the agricultural and peat land fire regions compared to forest biomass burning regions. In the study, we also tested the relationship between FC/FRP and various aerosol products such as AOD, AAOD and UVAI in biomass burning regions. Of the different products, we found UVAI as a better indicator of biomass burning pollution and strongly relating to FC/FRP in forest biomass burning than the agricultural biomass burning regions. We used the CALIPSO data to infer poor/strong correlations of FC/FRP in agriculture and forest biomass burning regions. Results suggested significantly higher CALIPSO backscatter as well as smoke plume heights for forest biomass burning regions than agriculture and peat-land fires. The results highlight FC/FRP-AOD, AAOD and UVAI relationships in different biomass burning regions in addition to smoke plume characteristics useful to address biomass burning pollution on atmosphere and climate.
Acknowledgments
We thank product developers of MODIS, MERIS, OMI and CALIPSO for free sharing of products. This research was supported by NASA grant NNX10AU77G.
Appendix

Download figure:
Standard image High-resolution image
Figure A1–A2. (a)–(j) Scatterplots between sum of FC-AOD, Sum of FC-AAOD A1(a)–(j) and sum of FC-UVAI relationships A2(a)–(j). R-square linear fit and regression bands at 95% confidence interval are also shown. A1–A2(a) Punjab, summer, India; A1–A2(b) Punjab, winter, India; A1–A2(c) Southern Vietnam; A1–A2(d) Thailand; A1–A2(e) Eastern Ghats, India; A1–A2(f) Northeast India; A1–A2(g) Eastern Myanmar; A1–A2(h) Laos; A1–A2(i) Riau, Indonesia; A1–A2(a), (j) Kalimantan, Indonesia.
Download figure:
Standard image High-resolution image
Download figure:
Standard image High-resolution image
Figure A3–A4. (a)–(j) Scatterplots between sum of FRP-AOD, sum of FRP-AAOD A3(a)–(j) and sum of FRP-UVAI relationships A4(a)–(j). R-square linear fit and regression bands at 95% confidence interval are also shown. A3–A4(a) Punjab, summer, India; A3–A4(b) Punjab, winter, India; A3–A4(c) Southern Vietnam; A3–A4(d) Thailand; A3–A4(e) Eastern Ghats, India; A3–A4(f) Northeast India; A3–A4(g) Eastern Myanmar; A3–A4(h).Laos; A3–A4(i) Riau, Indonesia; A3–A4(j) Kalimantan, Indonesia.
Download figure:
Standard image High-resolution image