
Abstract
Recognizing humans' unmatched robustness, adaptability, and learning abilities across anthropomorphic movements compared to robots, we find inspiration in the simultaneous development of both morphology and cognition observed in humans. We utilize optimal control principles to train a muscle-actuated human model for both balance and squat jump tasks in simulation. Morphological development is introduced through abrupt transitions from a 4 year-old to a 12 year-old morphology, ultimately shifting to an adult morphology. We create two versions of the 4 year-old and 12 year-old models— one emulating human ontogenetic development and another uniformly scaling segment lengths and related parameters. Our results show that both morphological development strategies outperform the non-development path, showcasing enhanced robustness to perturbations in the balance task and increased jump height in the squat jump task. Our findings challenge existing research as they reveal that starting with initial robot designs that do not inherently facilitate learning and incorporating abrupt changes in their morphology can still lead to improved results, provided these morphological adaptations draw inspiration from biological principles.
Export citation and abstract BibTeX RIS

Original content from this work may be used under the terms of the Creative Commons Attribution 4.0 license. Any further distribution of this work must maintain attribution to the author(s) and the title of the work, journal citation and DOI.
1. Introduction
During their lifespan, humans experience a remarkable journey of continuous development, fostering learning and acquiring various skills [1, 2]. From the earliest stages of childhood, humans evolve both their morphology and cognition. Morphology refers to the physical structures and form of the body and cognition involves the mental processes of acquiring knowledge and skills. Most motor skills are acquired by humans during the formative phase of their bodies [3, 4], characterized by relatively larger heads and torsos compared to their legs [5] along with limited muscle strength [6–8]. This configuration leads to a higher center of mass (COM) thus reducing mechanical stability. Progressing from childhood to early adulthood, humans continue to fine-tune their skills and develop their cognition while their bodies naturally evolve towards mature muscles and a more evenly distributed configuration [5, 6].
The recognition of the importance of the co-development of morphology and cognition in biological systems has led to a shift in focus in the robotics field. Despite the majority of this field still giving precedence to the cognitive development using unchanging morphologies, there is now an emphasis on natural morphological development; studying changes in the robot's body shape, properties, and capabilities throughout its lifetime and learning process [9]. This is seen in altering physical property, for instance, the size or mass of the body [10–13] and adjusting the robot's action possibilities during learning [14, 15] in simulation and hardware. These adjustments are applied to legged, virtual, and soft robots to learn a broad scope of anthropomorphic tasks ranging from reaching and grasping to walking, as seen in biology.
These works have revealed that the effect of morphological development on learning varies, with potential benefits and drawbacks based on the chosen development approach. Naya-Varela et al [16] aimed to clarify potential implementation guidelines with the NAO robot learning to walk, suggesting that morphological development offers advantages when there is a well-tuned synergy between morphology, controller, task, and learning algorithm. This synergy is especially relevant in complex problems where the primary morphology facilitates initial-stage learning. In contrast, Benureau and Tani [12] started learning with immature bodies, similar to those found in young biological systems, characterized by smaller size, weaker strength, and lighter weight and achieved better results when compared to a non-development approach, even though the initial morphology did not facilitate learning [12]. Disagreement exists in this field, but there is a consensus against abrupt developmental changes. Bongard [10] showed decreased performance of quadrupeds and hexapods in light-reaching tasks when introducing four discrete morphological steps. These changes, for example, involved transitioning from anguilliform robots to legged robots, with a one-third leg length and a 30∘ angle added in each developmental step. Similarly, abrupt freeing and restricting of degrees of freedom led to instabilities in learning the bipedal mechanism of swinging the legs under external perturbations [17]. Naya-Varela et al [11] varied developmental strategies in speed and parameters to suggest avoiding abrupt changes for improved outcomes over non-developmental strategies. They agreed that abrupt changes exceed the capacity of the control algorithm, disrupting its synergy with the morphology.
In this work, we draw inspiration from ontogenetic development, specifically human growth, and introduce a streamlined approach tailored for application in robotics. For the first time, we investigate ontogenetic morphological development in simplistic muscle-actuated human models that learn to balance and squat jump in simulation. We create younger body configurations that emulate natural human growth stages that do not necessarily find the tasks easier to learn. In the context of morphological development, we employ abrupt changes from a 4 year-old to a 12 year-old and finally an adult including adapting the segment length, segment mass, and muscle strength. To find the control policy for successful task performance, we employ optimal control based on the Covariance Matrix Adaptation Evolution Strategy (CMA-ES). We compare the performance of the tasks with morphologies undergoing development to the performance of the tasks solely performed with adult morphology. Our simulations reveal that the muscle-actuated models, experiencing morphological changes inspired by human development, exhibit more robust balance and higher jumps. These results propose promising prospects for the design of highly adaptable robotic systems.
2. Experimental setup
In the following, we outline the robot's morphology, approaches to morphological development, model scaling procedure, employed controller, and the executed anthropomorphic motions.
2.1. Biomechanical model
We use SCONE simulator with the implemented HyFyDy model H0914 [18, 19]. The model consists of an upper body, pelvis, and two legs each containing three segments: thigh, shank, and foot. The upper body combines the head, neck, torso, and upper extremities into one segment. Each leg is actuated by seven muscles controlling the hip, knee, and ankle joints. This configuration allows a total of nine degrees of freedom, restricting the movement of the model to the sagittal plane. Each foot is equipped with two spherical contact points approximating the toe and heel. The contact force is determined by the Hunt–Crossley contact model [20], incorporating a friction cone characterized by coefficients representing static, dynamic, and viscous friction [21]. Additionally, a symmetry constraint is introduced, ensuring that corresponding muscles in both legs, such as the right and left soleus, receive identical activation patterns. The model is simulated with a control step size of 0.001 s.
2.2. Developmental strategies
The adult model is scaled down to create two distinct morphological development tracks to be compared to the non-development track (NonDev): ontogenetic (OntoDev) and uniform scaling development (UniDev).
NonDev: The NonDev continuously uses the adult morphology throughout optimization.
OntoDev: In the OntoDev, every segment of the model undergoes proportional length scaling, like in humans, along with the total model mass. The mass distribution is modified in accordance with the updated body configuration. Among young children, the torso's length and mass make up a significantly larger fraction of the total body compared to adults [5]. Simultaneously, the mass and length of the pelvis, femur, tibia, and foot are relatively lower. Therefore, the COM of the child model is notably higher in relation to their overall body height compared to adult models.
UniDev: Conversely, the UniDev involves resizing all segments of the model using a common average ratio. This ratio is derived as the mean ratio of all segments. Although the total body weight is based on physiological data, the distribution of mass across segments adheres to that of the adult model.
As a result, the primary differences between the ontogenetically and the uniformly scaled models lie in their segment lengths and mass distribution, while both models maintain the same overall mass. The developmental stages included in each path are predefined. For ease of implementation, we choose the developmentally significant ages of 4 year-old and 12 year-old based on Gallahue's hourglass motor development model [4].
4 year-old: At 4 years, humans undergo the fundamental movement phase. By this age, children have essential ingredients for advanced movements, such as walking [22]. Sutherland [22] hypothesized that changes in walking that occur after the age of four can be attributed to changes in limb length, which is the primary focus of this work, rather than the development of the central nervous system. Additionally, very young children use natural supports, such as parent's hands or tables to execute balance and locomotion tasks which are not considered in this study [23].
12 year-old: The age of 12 is selected to avoid accounting for growth spurts which typically peak at the age of 14 in boys [24]. Growth spurts involve an increase in bone mass without a proportional growth in muscle strength, which would complicate the scaling process [25].
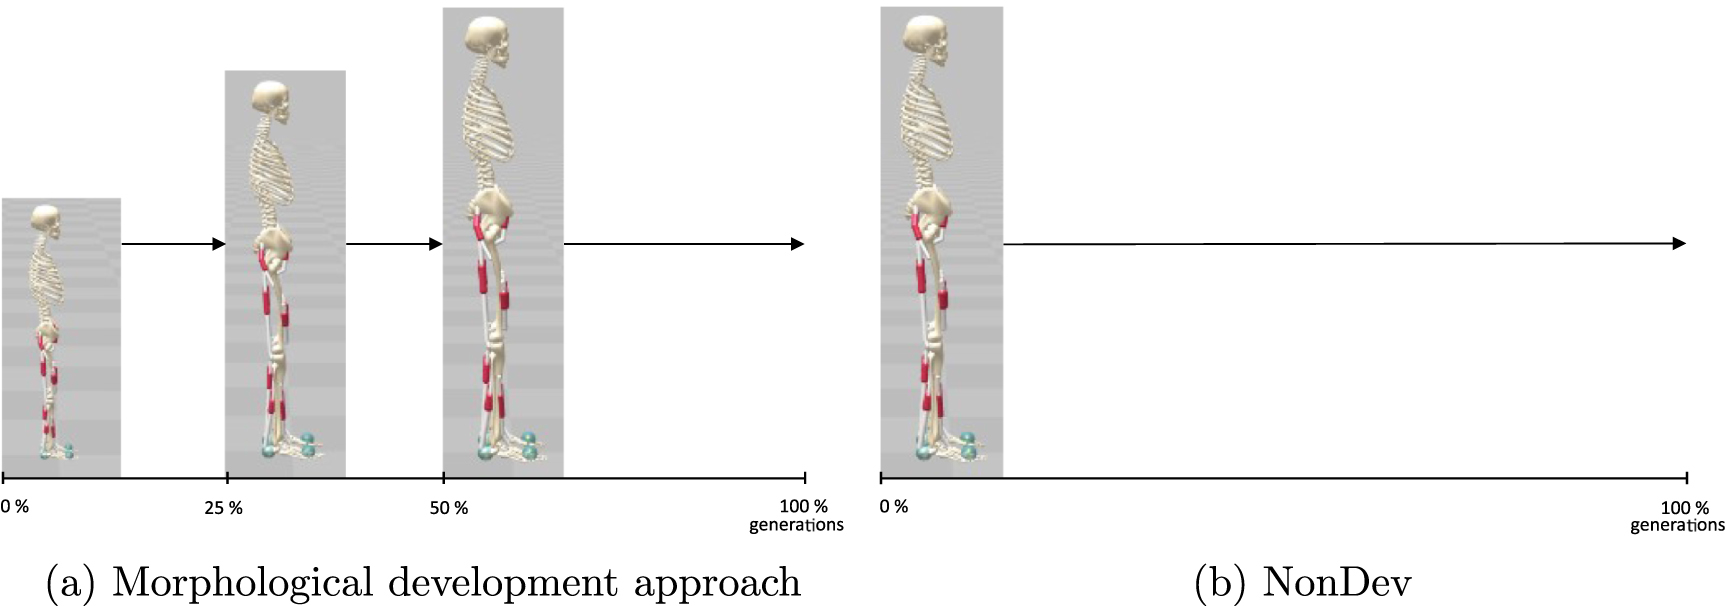
Learning a morphological development strategy starts with the 4 year-old version of the model. Quarter-way through the optimization an abrupt morphological change occurs to continue learning with the 12 year-old. We continue learning with the adult morphology halfway through the learning process. In the NonDev, only the adult model is used consistently throughout the entire optimization process. Figure 1 displays the development timetable and the distinct models employed across the generations.
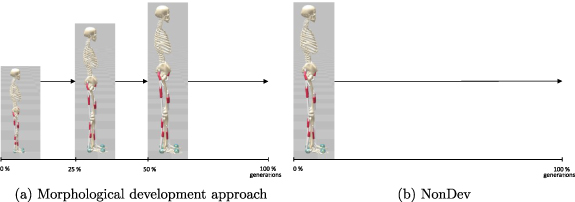
Figure 1. Comparison of implementations of morphological development approaches (OntoDev and UniDev) with the NonDev. (a) Morphological development starts with a 4 year-old's morphology, transitioning quarter-way through the optimization to a 12 year-old's morphology and ultimately to the adult morphology halfway through the optimization. (b) NonDev continuously uses adult morphology throughout optimization.
Download figure:
Standard image High-resolution image2.3. Biomechanical model scaling
To implement the child models for the OntoDev, we take inspiration from nature where growth occurs usually non-uniform and irregular. We start by scaling down the body segments with the data set from Snyder et al [26]. They provide information about the total body mass and segment lengths for different age categories. A comparison is made between the segment length for adults and the length for the targeted age groups. These ratios are used to resize each segment along the three dimensions. This results in the 4 year-old ontogenetic development version (Onto4y) having the most immature body. The torso has the highest COM in relation to the entire body height of 63.1% and a mass of 67.3% relative to the overall mass. Conversely, in the UniDev, all segments are uniformly scaled down by the same mean ratio, maintaining the mass distribution as in the original adult model. Therefore, the uniformly scaled 4 year-old (Uni4y), uniformly scaled 12 year-old (Uni12y), and adult models have a torso mass ratio of 45.9% and a COM height ratio of 58.1%. These values are quite similar to those of the ontogenetic 12 year-old model (Onto12y): 58.5% COM height and 47.9% torso mass.
The muscle length and length properties were scaled automatically with the segment sizes. Other muscle parameters are adjusted to maintain O'Brien's observation [27], ensuring that the shape of the moment-angle relationship is preserved in adult and scaled models during maximum voluntary contractions, or in our case, maximum muscle activation. To achieve this, we scaled the maximal muscle force following the approach suggested by Correa and Pandy [28]. Their work, focused on developing a method for scaling lower-limb peak isometric muscle forces in 7–13 year-old children, introducing a mass-length scaling law based on the assumption that muscle volume and body mass are linearly related [28]. For further refinement of muscle force, stiffness, and length, we altered the pennation angle. To accomplish this, we referred to the findings of Bizoni et al [29], which demonstrated a monotonically increasing pennation angle in the gastrocnemius medialis from birth, ultimately stabilizing after growth spurts. As a result, the muscle length ratio provides a simple and direct method for scaling the pennation angle of the muscle.
Lastly, the stiffness of both the ground contact points and joints, including joint limits, are scaled by the factor of segment length divided by the segment mass. This concept is derived from the work of Geyer et al [30] who introduced the dimensionless spring stiffness. The selected scaling factor aims to achieve dynamic locomotion invariant during the size changes, ensuring the normalized stiffness of the system remains constant. Consequently, the absolute stiffness stays unchanged.
2.4. Optimal control
While the morphological development stages were predefined, the control evolves automatically throughout the optimization process. The control problem with horizon N is defined as
with

and

We choose the CMA-ES to optimize the suitable control policy for each task and developmental strategy [31]. CMA-ES is a population-based, stochastic, and derivative-free optimization method commonly employed for black-box optimization problems. It utilizes various learning mechanisms to adapt the parameters of a multivariate normal distribution during the optimization process. The hyperparameter of the CMA-ES algorithm σ is set to the default value of 0.2 and the population size is fixed to 13, for both tasks across all developmental approaches, ensuring a fair comparison.
The chosen number of generations is determined by averaging the generation count needed for 10 adult morphologies' cost to converge with a minimum progress threshold of 1 during task performance. The NonDev optimization occurs continuously with the adult model. In the morphological development strategies, once a stage is completed, the human models are evaluated and the performance data from the best runs are saved to serve as the starting point for the next CMA-ES run. We repeat each task with 20 random seeds.
2.5. Anthropomorphic tasks
We focus on two key anthropomorphic movements pivotal in robotic applications, encompassing a broad spectrum from low-power to high-power actions. The same task formulation is applied across all three developmental strategies.
Balance task: For the balance task, we employ two preimplemented controllers, a proprioceptive muscle reflex and a vestibular reflex which are crucial for postural control in humans [32–35]. Throughout the optimization process, we expose the models to minor perturbations equivalent to 10% of their body weight to increase their overall robustness. These perturbations alternate directions along the x-axis pushing the model within the sagittal plane. Beginning with a forward acting force at the COM of the torso at 5 s, followed by a backward push at 9 s, this perturbation sequence recurs every 4 s until the run concludes. The cost function punishes falling, penalizes deviation of the torso, tibia, and fibula COM from the initial position, and minimizes energy consumption. Simulations end prematurely if the model falls. A successful run requires the model to maintain an upright position for 30 s as in the experiments of Yamamoto et al [36]. Appendix
Squat jump task: For the jumping task, the CMA-ES directly tunes the triphasic stimulation pattern for each muscle and the variable time between control points. The triphasic activation pattern denotes three distinct muscle activations occurring sequentially within each muscle during each run. The duration and intensity of each activation are adjusted by the CMA-ES based on the desired movement. The triphasic pattern is applicable as we have three joints with corresponding muscles that require activation in a proximal to distal sequence, as observed in human squat jump execution [37–39]. The model starts in a squatted position as introduced by Domire and Challis to be the preferred human squat position for high jumps [40] and terminates at the highest COM height. The cost combines the maximum height of the COM of the model and the maximum vertical pelvis velocity, both unnormalized to the model's morphology. Furthermore, it imposes a constraint on the extension of the upper body to 0∘. A run is taken into consideration when the final model initiates lift-off from the toes rather than the heels. Appendix
3. Results
We present the results obtained for the balance and squat jump tasks, with a focus on their cost function, kinematics, and kinetics.
3.1. Balance task
The cost function of the balance task in figure 2(a) demonstrates a strong initial decline in the mean of the 20 random seeds for all three strategies. Around one-quarter of generations, the adult morphology starts achieving values around 0, signifying that all seeds can successfully stand. The morphological developmental paths exhibit a notable peak at this point, with the UniDev attaining a cost value of 61.39 and the OntoDev reaching 130.07. Following this peak, there is another decline in cost. Notably, the OntoDev shows the highest peak during this transition, but all seeds learn to stand successfully with its Onto12y more rapidly than the Uni12y. In contrast, there are no visible peaks during the transition to the adult morphology. Towards the end of the optimization process, all strategies converge to approximately the same cost value: NonDev 0.36, OntoDev 0.37, and UniDev 0.38.

Figure 2. Cost comparison across the three developmental strategies for both anthropomorphic tasks. Morphological development strategies include abrupt transitions from a 4 year-old to a 12 year-old morphology quarter-way through optimization, ultimately shifting to an adult morphology halfway through. Vertical black lines indicate the transition times. (a) Balance task assessing stability over a duration of 30 s. (b) Squat jump task evaluating performance height and velocity.
Download figure:
Standard image High-resolution imageFurthermore, we evaluate the muscle activation associated with the learned stance after full optimization. In figure 3, it is evident that the median muscle activation is 0.14 for all strategies. For all non-outlier data points, the range starts at 0.01 and extends to 0.39 for the NonDev, 0.42 for the OntoDev, and 0.45 for the UniDev. The highest outlier is observed in the UniDev at 0.54. The NonDev exhibits some outliers with the highest at 0.43.
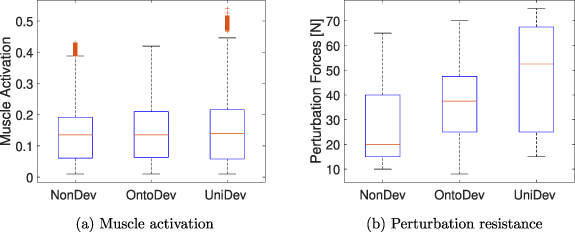
Figure 3. Balance task results for the three developmental strategies. (a) Total muscle activation at full optimization. (b) Post-optimization perturbation forces endured by the models before falling.
Download figure:
Standard image High-resolution imageThese muscle activations contribute to the overall maximal torque exerted around the joints (table 1). Notably, the ankle joint shows the highest torques in comparison to the hip and knee joints for all strategies. Comparing the distinct developmental strategies in the time of perturbations, the OntoDev displays the highest maximal torques in all joints: hip 2.37 ± 0.44 Nm, knee 5.55 ± 0.81 Nm, and ankle 16.58 ± 1.11 Nm. In contrast, the UniDev demonstrates the lowest maximal hip and ankle torques at 1.92 ± 0.30 Nm and 15.76 ± 1.04 Nm, respectively. The NonDev features the same maximal hip torques as the OntoDev at 2.37 ± 0.37 Nm and the lowest maximal knee torque of 5.25 ± 0.74 Nm.
Table 1. Maximum joint torques for the three developmental strategies in the balance task during perturbation forces of 10% body weight (mean ± std).
| NonDev | OntoDev | UniDev | |
|---|---|---|---|
| Hip torque (Nm) | 2.37 ± 0.37 | 2.37 ± 0.44 | 1.92 ± 0.30 |
| Knee torque (Nm) | 5.25 ± 0.74 | 5.55 ± 0.81 | 5.48 ± 0.81 |
| Ankle torque (Nm) | 15.98 ± 0.96 | 16.58 ± 1.11 | 15.76 ± 1.04 |
After full optimization, we subjected the models to higher perturbations to assess their robustness. The forces were applied at the torso's COM, starting at 5 s and recurring every 4 s in alternating directions along the sagittal plane as during optimization. However, in this assessment, we incrementally increased the forces by 5 N each time to determine the maximum forces the models could withstand before falling down. The perturbation forces endured are displayed in figure 3(b). The median force withstood by the NonDev is approximately 20.0 N, while the OntoDev has a median force of about 37.5 N. In contrast, the UniDev displays the highest median force, approximately 52.5 N. In terms of interquartile range, the UniDev illustrates the widest range, spanning from 25.0 N to 67.5 N. Conversely, the OntoDev demonstrates the narrowest range, varying from 25.0 N to 47.5 N. The NonDev values are in-between. Regarding the maximum force withstood, the NonDev has the lowest maximum at 65.0 N, whereas the UniDev strategy displays the highest maximum, reaching 75.0 N.
3.2. Squat jump task
The second task we investigate is the high-power squat jump. In this task, the initial mean values of the cost function show consistent patterns among the morphological development strategies (figure 2(b)). The OntoDev starts with the 4 year-old at −74.63, while the UniDev begins at −66.89. In contrast, the NonDev commences at −114.52. The NonDev exhibits the sharpest decrease, during that time the other paths exhibit less steep declines. During the transitions, the morphological development paths initially decrease sharply and then begin to converge. These sharp decreases at transition and the disparities in initial cost values can be attributed to the differences in height between the adult, the distinct 4 year-old models, and the various 12 year-old models, as the reward function factors in the maximal absolute COM height, which strongly varies for each of these models. After 500 generations, the OntoDev has the lowest mean cost of −166.86. The UniDev is at −165.37, and the NonDev ends at −160.35.
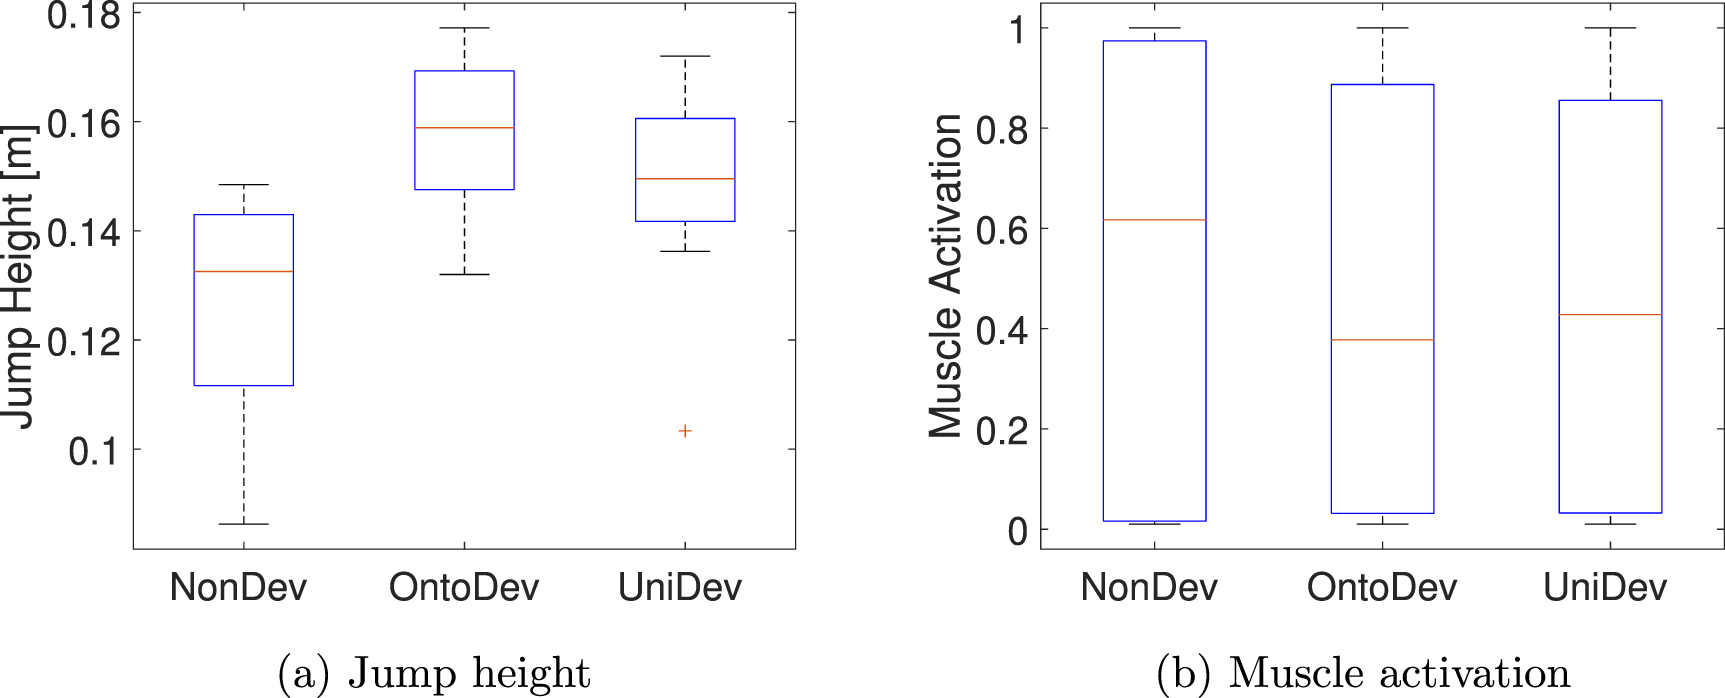
The cost function is primarily influenced by the COM height. In figure 4(a), we exhibit the COM jump height which represents the difference between the COM height during standing and the maximum attained COM height. Notably, the OntoDev exhibits the highest median jump height of 0.16 m, followed closely by the UniDev 0.15 m. In contrast, the NonDev records the lowest median jump height of 0.13 m. The interquartile range for the NonDev spans from 0.11 m to 0.14 m, falling below the median heights of the other strategies. In contrast, the OntoDev and UniDev have interquartile ranges of 0.15 m to 0.17 m and 0.14 m to 0.16 m, respectively. The upper adjacent values are set at 0.15 m for the NonDev, 0.18 m for the OntoDev, and 0.17 m for the UniDev. Notably, the UniDev exhibits an outlier at 0.10 m.

Figure 4. Jump task performance across the three developmental strategies. (a) Jump height, defined as the difference between the standing COM and maximal COM height. (b) Total muscle activation during the jump.
Download figure:
Standard image High-resolution imageFurthermore, joint angles are illustrated in figure 5. This figure comprises three subplots, each presenting a specific joint for all strategies. It is important to clarify that a decrease in the angles corresponds to an extension in the hip and ankle joints, in contrast to the knee angle, which indicates a flexion. Initially, the hip angle starts with a decrease to a minor minimum in all strategies. In the NonDev, it is followed by a minor increase getting back to the initial angle of 75.0∘ before the joint extends, whereas the morphological development strategies exhibit a more pronounced maximum before the decrease, with OntoDev reaching 85.6∘ and UniDev reaching 82.1∘. This pattern of a minor increase in the NonDev and a stronger increase in the morphological development strategies is also evident in ankle angles. Conversely, knee angles show a direct increase in the NonDev, while in the morphological development strategies, there is an initial decrease followed by extension, with OntoDev flexing to  and UniDev reaching
  , initially starting from
  .
.
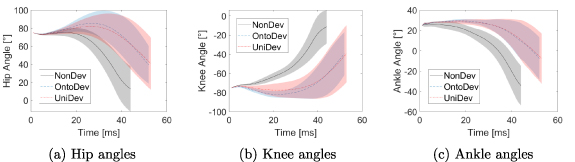
Figure 5. Hip, knee, and ankle angles for the three developmental strategies in the squat jump task. Each subfigure displays the respective joint angles for the three strategies: (a) hip, (b) knee, and (c) ankle.
Download figure:
Standard image High-resolution imageThese joint angles are generated through muscle activation. All muscle activation values are summed up in figure 4(b) displaying a similar range of values for all strategies. The median of the NonDev is the highest at 0.62, followed by the UniDev at 0.42 and lastly the OntoDev at 0.38.
In table 2, we present the maximum joint torques resulting from the muscle activation for the hip, knee, and ankle joints. All joint torques have their maxima in the NonDev and their minima in the UniDev approach. In the NonDev, the maxima are 98.42 ± 34.48 Nm for the hip, 91.02 ± 28.12 Nm for the knee, and 62.90 ± 22.94 Nm for the ankle. In the UniDev, the maxima are 70.60 ± 22.64 Nm for the hip, 72.52 ± 12.58 Nm for the knee, and 48.84 ± 17.76 Nm for the ankle. The maximal torques of the OntoDev fall between those of the two other strategies.
Table 2. Maximum joint torques for the three developmental strategies in the squat jump task (mean ± std).
| NonDev | OntoDev | UniDev | |
|---|---|---|---|
| Hip torque (Nm) | 98.42 ± 34.48 | 84.14 ± 29.67 | 70.60 ± 22.64 |
| Knee torque (Nm) | 91.02 ± 28.12 | 90.28 ± 19.98 | 72.52 ± 12.58 |
| Ankle torque (Nm) | 62.90 ± 22.94 | 59.94 ± 22.20 | 48.84 ± 17.76 |
To understand the final torques, we analyze the joint torques at the transition between different morphologies and at the end of the NonDev. Making the torques comparable we normalize these by the total body mass and height for each model, respectively. The maximal normalized torques are presented in table 3. Notably, the Onto4y exhibits the highest maximal hip torques at 0.92 ± 0.29  . The subsequent highest torque is seen in the adult at 0.79 ± 0.28
  . The Onto4y also demonstrates the highest maximal knee and ankle torques, albeit closer to the other values. Specifically, at the knee, the Onto4y records 0.72 ± 0.24
  , followed by the Onto12y at 0.71 ± 0.17
  . At the ankle, the Onto4y and the Onto12y report a maximal torque of 0.54 ± 0.16
  . Interestingly, the Uni4y ranks third in maximal torques for the hip and knee, and fourth for the ankle. In contrast, the Uni12y displays the lowest maximal normalized torques in all joints.
Table 3. Maximum normalized joint torques to total body mass and total body height for each model in the squat jump task. The results for the Onto4y and Uni4y are obtained from generation 125, the Onto12y and Uni12y are from generation 250, and the adult results are from NonDev at generation 500.
| Onto4y | Onto12y | Uni4y | Uni12y | Adult | |
|---|---|---|---|---|---|
Hip torque ( ) ) | 0.92 ± 0.29 | 0.71 ± 0.24 | 0.75 ± 0.23 | 0.47 ± 0.16 | 0.79 ± 0.28 |
Knee torque ( ) ) | 0.72 ± 0.24 | 0.71 ± 0.17 | 0.66 ± 0.23 | 0.54 ± 0.11 | 0.67 ± 0.24 |
Ankle torque ( ) ) | 0.54 ± 0.16 | 0.54 ± 0.19 | 0.48 ± 0.16 | 0.40 ± 0.14 | 0.50 ± 0.19 |
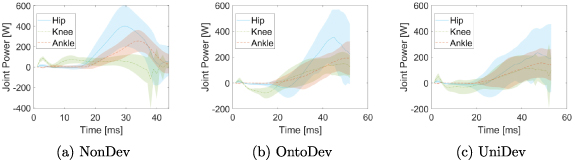
Furthermore, we consider the joint power at the end of the optimization. These are illustrated in figure 6 with three subplots each depicting hip, knee, and ankle joint power for one strategy. The general trend observed in all cases is an increase in power to reach a maximum, followed by a decrease. However, there are notable differences in the hip, knee, and ankle power patterns between the different strategies. In the NonDev, the hip and ankle exhibit the highest maxima, with values of 397.38 W at time 30 ms and 254.56 W at 34 ms, respectively. In contrast, the knee power in this approach is relatively lower, with a maximum of 116.18 W at 3 ms. Conversely, in the OntoDev, the knee power reaches the highest maximum among all strategies of 149.48 W at 49 ms. Additional peaks are observed at 45 ms for the hip and 51 ms for the ankle in the OntoDev. The UniDev strategy strikes a middle ground between the NonDev and the OntoDev regarding maximum power. It is noteworthy that UniDev's power peaks materialize at different time points, specifically at 47 ms for the hip, 45 ms for the knee, and 49 ms for the ankle. Additionally, the hip and knee power patterns in the OntoDev, as well as the knee power in the UniDev, display an initial decrease and clear negative power before following the overall trend of increasing to a maximum.
Figure 6. Hip, knee, and ankle power for the three developmental strategies in the squat jump task. Each subfigure displays the respective powers for one strategy: (a) NonDev, (b) OntoDev, and (c) UniDev.
Download figure:
Standard image High-resolution image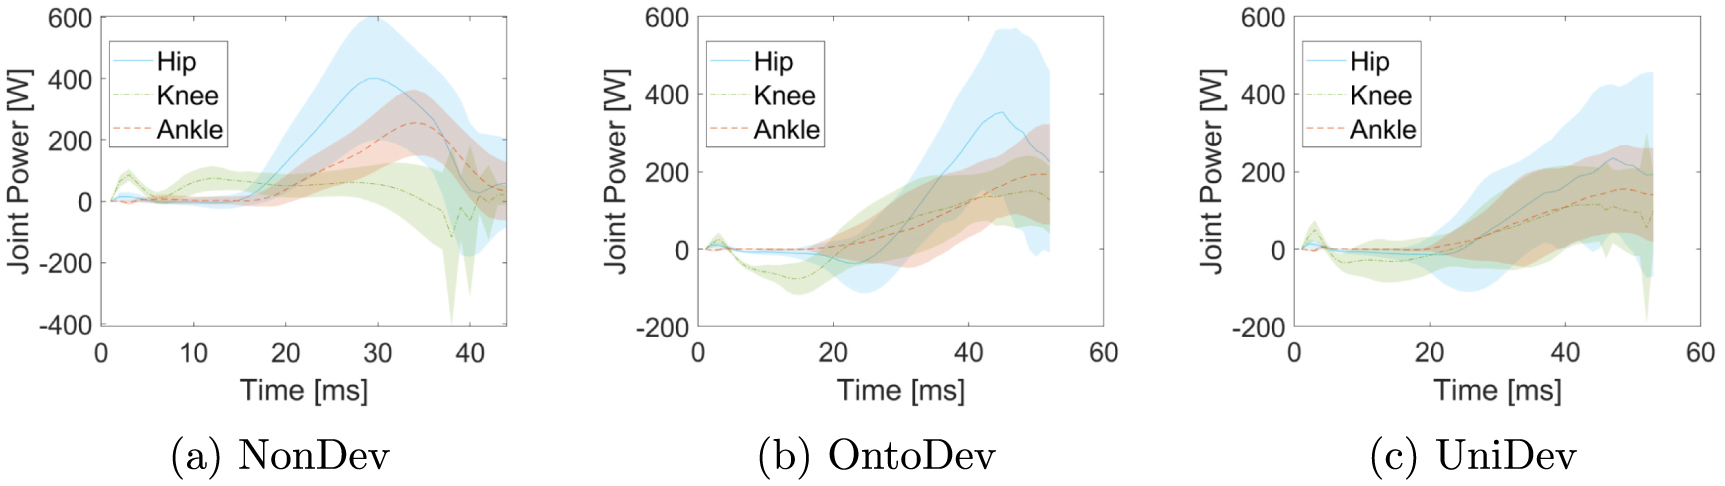
4. Discussion
Our work draws inspiration from human ontogenetic development to enhance stability in an upright stance and height of a squat jump. With a practical perspective for robotics, our biomimetic solution emphasizes streamlined implementation, leveraging only a limited number of growth steps while still achieving improved outcomes.
4.1. Impact of morphological development on balance task
After the full optimization, we observe similar cost values in the balance task which is due to the algorithm gradually reducing muscle activation after learning proper standing. However, our implemented approach gives the morphological development paths less time to adjust to the task with the adult morphology after the last transition. In contrast, in the NonDev the adult utilizes all generations to refine the performance. Despite this disadvantage for the morphological developmental paths, they still show comparable cost function outcomes.
Although the cost function of the balance task yields similar results for the different strategies, there is a clear increase in robustness to perturbations after optimization with the morphological development paths. As the median muscle activation is the same for all strategies (figure 3(a)), we hypothesize that the enhanced robustness stems not from increased muscle co-activation but rather from growth. To explain the improved robustness, we investigate the maximum torques during perturbations of 10% body weight. Given the nature of the balance task to minimize effort, the disparities between strategies in terms of torques are not distinctly pronounced. Consequently, we withhold a detailed analysis of individual torques at the transitions in the morphological development strategies, reserving this evaluation for the high-power squat jump task. Overall, the OntoDev strategy showcases increased robustness through higher maximal joint torques during perturbations compared to the other strategies. This could be influenced by the initial immature body configuration of the Onto4y during optimization. In contrast, the UniDev strategy exhibits maximal knee torques, minimizing hip and ankle torques, therefore fostering adaptability to high perturbations while ensuring stability through the knee. The torque distribution in the UniDev is influenced by the Uni4y's even mass distribution and body configuration which overall requires smaller torques. Conversely, the NonDev strategy relies heavily on hip forces, displaying the lowest knee and middle ankle maximum torques. Relying only on the hip to stabilize during perturbations might be adequate for low forces, but when high perturbation forces occur post-optimization, the NonDev falls more easily compared to the other developmental strategies.
4.2. Impact of morphological development on squat jump task
Unlike the balance task, the algorithm in the high-power squat jump task is not explicitly guided by the cost function to utilize the optimization time for further reducing muscle activation. Following full optimization, a distinct improvement is evident in the cost function for the morphological development strategies compared to the NonDev. Moreover, we observe a decreasing trend in the morphological developmental paths after 500 generations, suggesting that a longer optimization process could lead to even better results, while the NonDev has already reached saturation.
Additionally, we demonstrate higher jump heights in the morphological development paths compared to the NonDev. However, merely considering the values of maximal torque, as in the balance task, is insufficient to explain this difference. Although the NonDev exhibits the highest torques in all joints, it paradoxically achieves the lowest jump heights (table 2 and figure 4(a)). Contrary the UniDev representing the lowest maximal torques, manages higher jump heights than the NonDev. Two other aspects influenced by body growth contribute to superior jumps.
Firstly, examining the sequence of maximal joint power (figure 6), we use Bobbert's and van Ingen Schenau's insights [37] into human squat jumps. They explain that hip, knee, and ankle joint powers typically peak sequentially from proximal to distal, optimizing work efficiency by mitigating the negative impact of proximal segments on COM acceleration [39]. Interestingly, this sequential pattern aligns with the OntoDev results, underlining how the Onto4y prioritizes propelling its heavy torso initially to achieve an optimal take-off position. Notably, the Onto4y displays the highest maximum hip torques normalized to body mass and height among the models (table 3). These results suggest that uneven body growth may play a role in shaping the power generation sequence, perhaps even in humans. The UniDev further contributes to this point, with maximum knee power slightly preceding maximum hip power, likely influenced by the Uni4y's evenly distributed mass and segment length, putting even emphasis on the hip and knee power for the jump. In contrast, the NonDev achieves maximum knee power within the first milliseconds of the run, with the hip and ankle maximum power following much later, negatively impacting the resulting jump height.
Secondly, we observe that the overall median muscle activation is lower in the morphological development paths compared to the NonDev. This reduction could be attributed to the OntoDev and UniDev additionally learning a small counter-movement before lifting-off, as depicted in joint angles and joint power (figures 5 and 6), effectively reducing effort while enhancing jump height, a behavior not observed in the NonDev.
4.3. Global implications of morphological development
In summary, the improvements attributed to incorporating bioinspired growth can be outlined as follows: In the balance task, the NonDev strategy concentrates on developing a robust approach tailored to the immediate task, at the same time the morphological development paths automatically evolve strategies that generalize for higher perturbation forces. In the context of jump performance, the NonDev primarily focuses on enhancing the torque magnitudes, whereas morphological development paths explore improved coordination of the torques, resulting in lower effort and improved performance. These conclusions align with the findings of Naya-Varela et al's study [41], suggesting that morphological development guides the exploration process towards advantageous solutions compared to merely adding noise without considering growth.
We demonstrated that both morphological development strategies are beneficial compared to the NonDev, even though their initial morphologies do not necessarily have an easier time learning, due to weaker muscles and immature body constellation. This emphasizes the insights from Benureau and Tani's research [12], challenging the guidelines proposed by Naya-Varela et al [16]. They show that you do not necessarily need to use initial morphologies that simplify early-stage optimizations when using simple muscle implementations, such as actuated springs, in their 2D muscle-driven tentacle robot [12]. Our results with a more complicated muscle implementation and human models support their findings.
Furthermore, this work marks the first instance demonstrating that abrupt model changes can still yield better performance compared to the NonDev, which is contrary to current state-of-the-art [10, 11, 17]. These studies have in common the use of torque actuation while our work relies on muscle actuation. Generally in the robotics field, muscles enhance efficiency, increase robustness to force perturbations not present during learning, and reduce the demand on information processing capacity, facilitating learning when compared to torque-actuated models [42–47]. Thus, muscle actuation appears more capable of handling significant disturbances than torque actuation, which in our case is the abrupt changes in morphology introduced. This can be attributed to the fact that humans naturally experience growth and muscles adapt accordingly, possessing these inherent attributes. Therefore, our model is inherently capable of handling these abrupt changes in comparison to the literature where torque actuation fails.
4.4. Comparison of task performance with human performance
Given our use of muscle-driven models, it would be prudent to compare our simulation performance with those documented in the literature for human subjects. The experiments from Domire and Challis [40] on squat jumps where the participants prefer to start in approximately the same position as this work attain a mean height of  m. Other studies [48–51] report mean jump height to be between 0.20 m and 0.52 m, depending on factors including age, athleticism, and starting position. Our results, including the maximal height of 0.18 m, fall below this reported range. Several aspects contribute to this difference. Firstly, our model lacks arms, which are significant contributors to propelling the body upwards during human jumps [52, 53]. Secondly, our model's foot contact points to the ground are limited to two, which does not allow for the natural toe-off movement that humans utilize in jumping. Thirdly, the adult HyFyDy model H0914 used in our study has lower maximal muscle forces compared to other simulation models. For example Domire and Challis [40] use a maximal soleus force of 13 500 N in their simulation meantime the HyFyDy model is at 3549 N.
For the balance task, we refrain from conducting an extensive comparison of the results to the literature similar to the comparison for the squat jump task, due to the inclusion of perturbations in our optimization process, which, to the best of our knowledge, do not align with existing experiments in the literature. Nevertheless, we acknowledge that the robustness achieved in the balance task falls below human levels. This is partly due to the symmetry constraint imposed on the controller, preventing lateral or backward steps to counter external forces as humans would react. Additionally, our simulation for the balance task relies solely on reflex controllers neglecting feedforward control, which is a simplification that does not encompass the full spectrum of mechanisms contributing to stability in humans [54, 55].
4.5. Limitations
The models utilized have several limitations due to their simple structure, capturing only a restricted set of muscles, segments, and degrees of freedom. As direct measurement of maximum muscle force is not feasible, accurate modeling and scaling remain a challenge. While we acknowledge the importance of considering additional parameters, such as tendon stiffness and the ratio of fiber to tendon length for each muscle, our study predominantly centers around O'Brien's observation [27] regarding a consistent angle-moment shape across different age groups. The present scaling of muscle parameters, encompassing pennation angle, optimal length, tendon slack length, and maximal muscle force, could be further refined, but the absence of established guidelines and inadequate data poses a challenge.
Additionally, this study does not represent a subject-specific development, only using median data models for three age groups. Despite humans learning these movements in earlier years, we selected these ages for the sake of modeling simplicity and coverage of significant age ranges. Capturing the full complexity of humans and their variations, encompassing individuality and all age groups would be impossible. However, with more intricate models and a broader age range, future research can delve into continuous growth, allowing a nuanced analysis of human development. Despite these limitations, our research represents a potential stepping stone for future investigations, especially when compared with previous studies that employed significant simplifications yet successfully simulated human behavior—such as modeling human stances resembling natural behavior with a double-inverted pendulum model [56].
To teach the models the anthropomorphic tasks, we employ the CMA-ES. It follows an approach, similar to the progression seen in evolution over generations. This process differs from how individual humans learn, which iteratively occurs within a single lifetime. Human learning involves a complex interplay between low-level and high-level control mechanisms, which is still not fully understood by humans. While CMA-ES has proven effective in learning various anthropomorphic tasks in previous studies [42, 57–59], there are various approaches that even more closely emulate the high-level path of human learning. Although exploring human-like learning is an interesting topic, it deviates from the primary focus of this work. Instead, our emphasis was on morphology. Delving into controller design that more closely emulates human learning could be a separate research endeavor, given its complexity.
5. Conclusion
Our work illustrates how the implementation of morphological development, inspired by human growth patterns and a streamlined robotics approach, in muscle-actuated human models enhances their performance in simulation. Specifically, this is evident in the higher robustness to balance perturbations and the improved performance of squat jumps. Our findings challenge existing literature [10, 11, 17], as we have shown that even abrupt changes in morphological development can lead to improved results. Furthermore, we have highlighted that initial developmental stages need not necessarily ease the learning processes as previously suggested [16]. In contrast to the literature's focus on achieving the ideal synergy between the development and control algorithm by varying factors such as size, weight, or other parameters throughout morphological development, our study suggests that a bioinspired scaling approach could inherently lead to improvements.
Besides selecting the appropriate developmental approach, designing a robot for each stage is a technical difficulty of morphological development. Benureau and Tani [60] aim to streamline the process by involving minor variations in size, mass, and muscle strength around the adult morphology. To implement these modifications, they suggest changing the gravity in simulation or modifying the maximal torque, along with using specialized actuators in the hardware. While this accounts for the changes in mass and strength, it does not eliminate the challenge of continuous length development. Differently, our work only predefines three morphologies with abrupt transitions. Although our approach contrasts the observed patterns in the natural world regarding species development including diverse morphologies, introducing constraints facilitates the implementation and prepares for an easier transfer to hardware. Additionally, since our cost function does not exhibit major peaks during the transition between the 12-year-old and adult morphologies in the balance task, we could envision a scenario where one creates the younger models in simulation, transferring the optimized strategy from the 12-year-old simulation to the adult morphology in hardware.
Although our findings are demonstrated with only one set of hyperparameters, we would expect similar results when varying the σ and control step size, as recently demonstrated that muscle actuation has a high robustness to hyperparameter variations in comparison to torque actuation [42]. It would be intriguing to investigate whether the findings of Benureau and Tani [12], who deeply investigated the impact of population size and development duration in their work, showing saturation of the effect of development in performance beyond specific values, hold for human tasks that involve intricate muscles.
Our findings have been consistently observed across a diverse range of tasks, spanning from a low-power balance task to a high-power jump task. However, these tasks, despite demonstrating improved performance, remain relatively simple to learn. According to current morphological development research [16], undertaking more demanding anthropomorphic tasks should yield more pronounced outcomes, providing insight into the effect of the methods used.
Acknowledgments
This work was funded by the German Research Foundation (Deutsche Forschungsgemeinschaft, DFG) under Germany's Excellence Strategy—EXC 2075 - 390740016. Additionally, the authors thank the International Max Planck Research School for Intelligent Systems (IMPRS-IS) for supporting Nadine Badie. They express sincere appreciation to Pierre Schumacher and Isabell Wochner for their fruitful discussions on the theoretical framework. Gratitude is also extended to Maria Hammer, Michael Günther, and Patrick Lerge for their invaluable technical feedback on modeling and scaling aspects.
Data availability statement
All data that support the findings of this study are included within the article (and any supplementary files). Furthermore, we have included example videos demonstrating the anthropomorphic movements considered in our research.
Appendix A: Balance task formulation
The balance task employs two control mechanisms: a proprioceptive muscle reflex and a vestibular reflex. The proprioceptive reflex is defined individually for each muscle as

taking the length difference between the actual L and a predefined feedback offset L0 into consideration and incorporating the length feedback gain KL . Similarly, the vestibular reflex is constructed, encompassing a positional element denoted by the index 'P' and a velocity element denoted by the index 'V'. All respective parameters are detailed in table 4. Additional subscripts include 'prop' representing proprioceptive, 'vest' signifying vestibular, 'hip' denoting all hip muscles, 'knee' indicating all knee muscles, and 'ankle' expressing all ankle muscles.
Table 4. Summary of parameters for proprioceptive and vestibular reflexes, including reflex gains, offsets and delays. Depending on the parameter we display either the value or the std.
| Name | Value |
|---|---|

| ±1.000 |
 (m) (m) | 0.500 |
 (s) (s) | 0.010 |
 (s) (s) | 0.020 |
 (s) (s) | 0.035 |

| ±0.300 |

| ±0.100 |

| 0.100 |
The cost function is shaped as
with Δ the deviation of the initial upright position along the x- and y-axis for each of the segments,  a penalty for muscle activation above 0.20 in any muscle, and
  a penalty for falling below a
  of 0.30 m. We introduce the COM deviation term for each segment to enhance the overall model robustness. Excluding these terms results in lower forces withstood by all strategies and less consistent upright standing in the different seeds. In this work, we did not explore more generalized functions to prevent falls, as our focus was on observing models in an upright position with symmetric activation similar to how humans stand.
Appendix B: Squat jump task formulation
The squat jump task relies on a feedforward control manner. The initial control points for all muscles are set at 0.35 ± 0.01 and are constrained to be within the range of 0.00 and 1.00. The time interval between different control points is initially set at 0.200 ± 0.001 and can vary within the range of 0.001 and 1.000.
The objective for the squat jump task is given as

where  denotes the height of the COM,
  the pelvis vertical linear velocity and
  a penalty for pelvis orientation extended beyond 0∘. Notably, all terms in the cost function maintain their original values for each model, without normalization, neglecting the influence of variations in model morphologies. The equation, inspired by Pandy et al's cost function [61], is adapted to promote counter-movement before lift-off, initiating the reward for
  and
and  from 0.35 s until the conclusion of a run, rather than solely considering the time of take-off. Additionally, to prevent the model from adopting an arched back position to minimize the cost, we introduce the pelvis extension penalty.
Balance with Weak Perturbations (6.0 MB AVI)
Balance with Strong Perturbations (5.5 MB AVI)
Onto12y (<0.1 MB HFD)
Onto4y (<0.1 MB HFD)
Uni12y (<0.1 MB HFD)
Uni4y (<0.1 MB HFD)
Squat Jump (0.3 MB AVI)