

Abstract
Objective. Cochlear implants (CIs) have become the gold standard treatment for deafness. These neuroprosthetic devices feature a linear electrode array, surgically inserted into the cochlea, and function by directly stimulating the auditory neurons located within the spiral ganglion, bypassing lost or not-functioning hair cells. Despite their success, some limitations still remain, including poor frequency resolution and high-energy consumption. In both cases, the anatomical gap between the electrode array and the spiral ganglion neurons (SGNs) is believed to be an important limiting factor. The final goal of the study is to characterize response profiles of SGNs growing in intimate contact with an electrode array, in view of designing novel CI devices and stimulation protocols, featuring a gapless interface with auditory neurons. Approach. We have characterized SGN responses to extracellular stimulation using multi-electrode arrays (MEAs). This setup allows, in our view, to optimize in vitro many of the limiting interface aspects between CIs and SGNs. Main results. Early postnatal mouse SGN explants were analyzed after 6–18 days in culture. Different stimulation protocols were compared with the aim to lower the stimulation threshold and the energy needed to elicit a response. In the best case, a four-fold reduction of the energy was obtained by lengthening the biphasic stimulus from 40 μs to 160 μs. Similarly, quasi monophasic pulses were more effective than biphasic pulses and the insertion of an interphase gap moderately improved efficiency. Finally, the stimulation with an external electrode mounted on a micromanipulator showed that the energy needed to elicit a response could be reduced by a factor of five with decreasing its distance from 40 μm to 0 μm from the auditory neurons. Significance. This study is the first to show electrical activity of SGNs on MEAs. Our findings may help to improve stimulation by and to reduce energy consumption of CIs and thereby contribute to the development of fully implantable devices with better auditory resolution in the future.
Export citation and abstract BibTeX RIS

Content from this work may be used under the terms of the Creative Commons Attribution 3.0 licence. Any further distribution of this work must maintain attribution to the author(s) and the title of the work, journal citation and DOI.
Introduction
Spiral ganglion neurons (SGNs) mediate sound perception by transmitting information from the mechano-sensitive hair cells within the cochlea to the cochlear nucleus in the brain stem. The signal is then further transferred along the ascending auditory pathway to the auditory cortex (Appler and Goodrich 2011). Two types of afferent neurons innervate hair cells and reside within the spiral ganglion (SG): type 1 neurons, representing 90–95% of the neuronal pool, innervate inner hair cells, responsible for sound perception. Type 2 neurons, which instead innervate outer hair cells, seem to contribute to signal amplification (Berglund and Ryugo 1987, Romand and Romand 1987). Conditions where either the hair cells or the auditory neurons are lost or damaged are referred to as neurosensory hearing loss.
According to estimates by the WHO, 360 Million people are affected worldwide from disabling hearing loss (factsheet 2014) with severe consequences for professional and private life. For mild to moderate forms, conventional hearing aids alleviate the communication problems. In severe forms of hearing loss and deafness, the auditory function can only be restored by a neuroprosthesis called cochlear implant (CI). This device includes a linear electrode array containing up to 22 electrodes, surgically inserted into the scala tympani of the cochlea, which functionally replaces lost inner ear sensory cells by directly stimulating the auditory nerve (O'Donoghue 2013).
Despite the success of current CI systems, there is a substantial variability in performance across CI-users and limitations for music listening, tonal languages, and noisy environments. One of the major bottlenecks for optimal stimulation is the anatomical gap between the implanted electrode array and the stimulated regions of the auditory nerve. The normal distance from a CI electrode to the SGNs in current clinically used systems is in the range of hundreds of micrometers (Shepherd et al 1993, Tykocinski et al 2000). Since the current generated by the electrode has to overcome this distance, the contrast in the current distribution over space is strongly reduced due to a relatively large space-constant (Ifukube and White 1987). This is also known as current spread, one of the factors causing 'channel cross talk', resulting in an impaired frequency resolution (Friesen et al 2001, Hughes and Stille 2010, Lee et al 2010). Additionally, neighboring electrodes cannot be used at the same time due to overlapping electrical fields, resulting in a further decrease in frequency resolution and challenges with temporal coding. Finally, the high currents required result in a high-energy consumption of these devices, associated with significant recurring battery costs, hindering the development of fully implantable devices.
It is a generally accepted view that eliminating the spatial gap between neurons and the electrode array will improve the effectiveness of auditory nerve stimulation (Wilson and Dorman 2008). Due to the reduction in spatial current distribution between the electrode and the neuron, it should be possible to stimulate the neurons more specifically compared to the current CI technology. The hoped-for result is to achieve less blurring of the pattern of stimulation.
A reduction of energy consumption of up to 20% can already be achieved today by moving the CI electrodes closer to the nerve using modiolus hugging devices (Wackym et al 2004). Moving the electrodes even closer by surgically inserting them directly into the modiolus improves frequency resolution and allows for increasing channel numbers up to 194, due to a more specific stimulation of the SGNs. However, this procedure is highly traumatic for cochlear tissues and therefore, to our knowledge, not pursued further by CI manufacturers (Volckaerts et al 2007). Alternatively, strategies to promote growth of SG nerve fibers into the scala tympani by the use of neurotrophic factors are being examined in pre-clinical models, using local delivery (Glueckert et al 2008) or gene transfer approaches (Shibata et al 2010, Budenz et al 2015) with the aim of recruiting SGN processes, through growth, onto the electrode array.
In order to gain detailed information about the potential advantages of a gapless interface between the CI electrodes and the SGNs, we developed an in vitro model using SGN cultures on multi-electrode arrays (MEAs). MEAs appear well suited to mimic the features of a CI, as they allow for extracellular stimulation and recordings and permit the analysis of different SGN–CI interface parameters.
Planar MEAs are two-dimensional arrangements of electrodes that allow for the recording of electrical activity from many neurons simultaneously with a high temporal resolution (Nam and Wheeler 2011, Spira and Hai 2013). So far, they have been successfully employed for the study of the cortex (Baruchi et al 2008), hippocampal cultures (Marconi et al 2012), the retina (Grumet et al 2000, Maccione et al 2014) and the spinal cord (Streit et al 2001, Tscherter et al 2001, Heidemann et al 2014), among others systems. Due to the fact that SGNs are not forming a neuronal network among themselves, but act as bipolar neurons connecting sensory hair cells to the cochlear nucleus, MEAs are used in this setting for parallel simultaneous measurements of unconnected neurons and thus for characterization of the direct group response to stimulation.
Here we show for the first time that stimulation and recording of auditory neuronal activity from SGN explants using MEAs is feasible. We characterize spontaneous as well as electrically induced activity and identify specific features of the stimulation pulses that allow for a reduction of the energy required to elicit a response from the neuronal culture. Finally, we were able to quantitatively assess the influence of the distance of a stimulating CI electrode, mounted on a micromanipulator, from the SGN culture on the MEA, thereby creating a platform by which the effects of the distance between stimulation electrode and nerve cells can be investigated in vitro.
Material and methods
Isolation and culturing of SGNs
Five to eight day old mice pups (C57/Bl6) were used for the study. The animal protocol for tissue harvesting was approved by the local animal welfare authority (BE117/12, Amt für Landwirtschaft und Natur des Kantons Bern, Switzerland). The pups were decapitated, the heads were cut sagittally and the brains removed. Both otic capsules were isolated from the skull and transferred into cold Hank's Balanced Salt Solution (Invitrogen, USA) for further dissection under a binocular dissection microscope (Nikon SMZ100, Japan). The cochleae were carefully dissected and the surrounding bone, the stria vascularis and the Organ of Corti were removed consecutively. Finally, the SGs were isolated. Three to four explants (200–500 μm) were cut from the SG, and plated directly without a dissociation step without distinguishing between apex, middle or basal part. SG explants were cultured either on coverglasses, 96 well plates or MEAs, previously coated for 30 min to 1 h with MatrigelTM (Corning, USA) diluted in 1:10 Neurobasal medium containing the following ingredients: Neurobasal (Invitrogen, USA), B27 (Invitrogen, USA), 4-(2-hydroxyethyl)-1-piperazineethanesulfonic acid (HEPES) (Invitrogen, USA), Glutamax (Invitrogen, USA), Ampicillin (Sigma, USA), 10% fetal bovine serum (FBS) (Invitrogen, USA) and 5 ng ml−1 brain derived neurotrophic factor (BDNF) (R&D Systems, USA).
Immunostaining and neuronal density quantification
Samples were fixed with 4% paraformaldehyde for 10 min and washed three times with PBS. For permeabilization, samples were treated for 5 min with 0.01% Triton-X-100 in PBS and further incubated with 4% BSA in PBS (with 0.001% Triton-X-100) for 2 h. Samples were either stained for 1:200 TUJ (R&D Systems, USA) alone or in combination with 1:100 peripherin (Millipore, USA). Primary antibodies were incubated overnight at 4 °C. On the next day, samples were washed three times with PBS (Invitrogen, USA) and incubated with secondary fluorescently labeled antibody (anti mouse-Alexa Fluor 488 and anti rabbit-alexa Fluor 555, both Invitrogen, USA), diluted 1:500 in PBS (with 4% BSA + 0.001% Triton-X-100) and left for 2 h at 4 °C. Cultures growing on MEAs were analyzed using a Leica DMI4000 B microscope (Leica Microsystems, Germany) equipped with CCD cameras (DFC425 C and DFC360 FX, both Leica Microsystems, Germany). Fluorescent microscopy images were analyzed using ImageJ™ software. 8 bit Images were thresholded for each channel and analyzed to identify neurons (TUJ and/or Peripherin) or nuclei, respectively. The positive pixel area occupied by neurons was normalized to the DAPI positive area. The area occupied by SGN explants on MEA was calculated for 3–6 MEAs per condition.
For this analysis the TUJ + pixel area was estimated exclusively in the area that included 68 electrodes (2.2 mm × 1 mm). Qualitative assessment of the lengths of neurites of SGN explants was estimated using the imageJ plugin Neuron J (Meijering et al 2004).
MEA setup
MEA slides (Qwane Biosciences, Lausanne, Switzerland) containing 68 platinum electrodes with a dimension of 40 × 40 μm and an inter-electrode distance of 200 μm were used. The MEA electrodes were made of black platinum (approximate impedance of 10 k at 1 kHz). The MEAs contain four large ground electrodes that are placed around the recording site. A custom-made setup was used to amplify and digitize the electrical signals of the electrodes (Tscherter et al 2001).
Electrophysiological recordings from SG explants on MEAs
Two to three SG explants were placed on MatrigelTM-coated MEAs and incubated for a total duration of 6–18 days in vitro (DIV), depending on the experiment performed. For the direct comparison of neuronal activity at different time points, independent cultures were used for each time point. Recording was then performed at day 6, 12 or 18. In all cases, the dissected Organ of Corti was placed in co-culture with the explants, but at a distance of 3–6 mm from the explants outside of the electrode area (figure 1(a)). In the first 5 DIV, 100 μl of NB-medium supplemented with 5 ng ml−1 BDNF (R&D Systems, USA) and 10% FBS (Invitrogen, USA) was added daily. At 6 DIV, 2 ml of NB-medium supplemented with 5 ng ml−1 BDNF was added once for the remaining 1–13 DIV. At the end of incubation, the MEA cultures were transferred to the recording setup and the NB-medium was replaced by extracellular solution (ECS) (145 mM NaCl, 4 mM KCl, 1 mM MgCl2, 2 mM CaCl2, 5 mM Hepes, 2 mM sodium pyruvate, and 5 mM glucose (pH 7.4)) (all Sigma, USA). Spontaneous activity was recorded for a minimum of 5 min. Successful spontaneously active cultures were defined as MEA experiments showing spontaneous activity from at least one of the 68 electrodes.
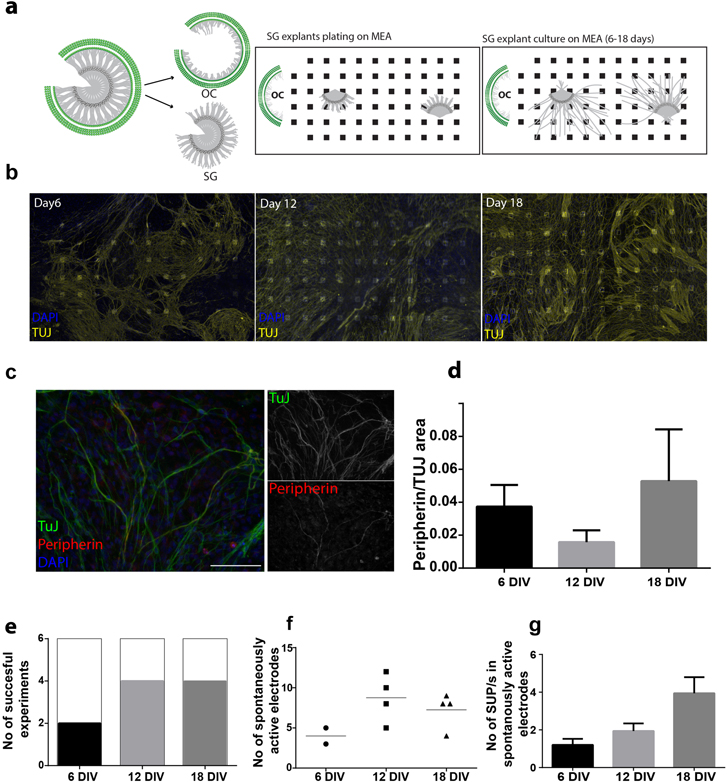
Figure 1. Characterization of the SGN cultures. (a) Schematic representation of SG explant culture on MEA: upon isolation of the SG from the OC, explants of 200–500 um are cut and placed on MEA. The OC is placed in co-culture, outside of the electrode functionalized area. Explants are cultured in vitro for 6–18 days. (b) Schematic representation of SG explant culture on MEA immunostained for TUJ (yellow) and DAPI (blue) on days 6, 12 and 18 in vitro. (c) Spiral ganglion explant culture immunostaining for peripherin (red) and TUJ (green). Separate stainings are shown in the inserts. Scale bar 100 μM. (d) SG explant cultures were used for quantification of peripherin (type II) positive neurons relative to TUJ positive cells (type I and II neurons) at 6, 12 and 18 DIV. Data are given as mean ± SEM (n = 3 for each time point). (e) Neuronal maturation in culture is assessed by electrophysiological recordings on MEA at day 6, 12 and 18. The number of successful experiments, defined as at least one electrode per MEA able to record spontaneous activity, is indicated for each time point. n = 6 independent experiments were performed for each time point. (f) Average number of electrodes per MEA detecting spontaneous activity. Only successful experiments (2 out of 6 at day 6, 4 out of 6 at day 12 and 4 out of 6 at day 18) are taken into account. (g) SUPs/second from each electrode showing spontaneous activity is calculated and shown as mean ± SEM, from the same 6 experiments as in (e) (day 6, n = 8 electrodes, day 12, n = 35 electrodes and at day 18, n = 29 electrodes).
Download figure:
Standard image High-resolution imageFor some experiments, cultures were superfused with ECS containing 30 mM potassium.
Tetrodotoxin (TTX, Alomone Labs, Israel) was used at a concentration of 1 μM to block voltage-gated sodium channels and the resulting activity was set as a zero reference to define the background noise of the system. The glutamatergic AMPA receptor blocker 6-cyano-7-nitroquinoxaline-2, 3-dione (CNQX, Sigma, USA) was applied at the concentration of 10 μM.
Download figure:
Standard image High-resolution image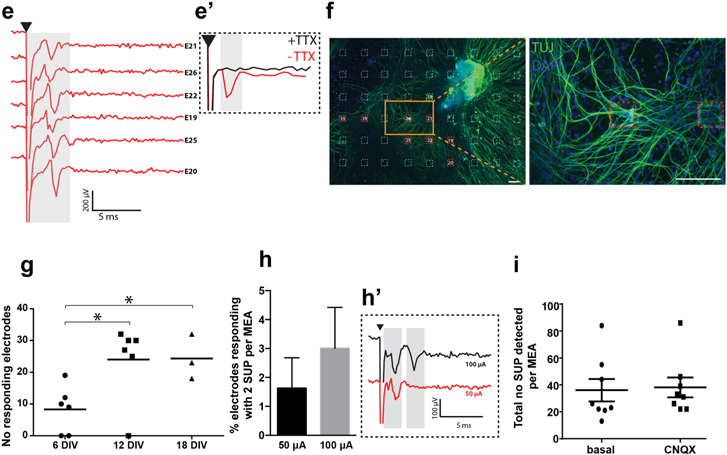
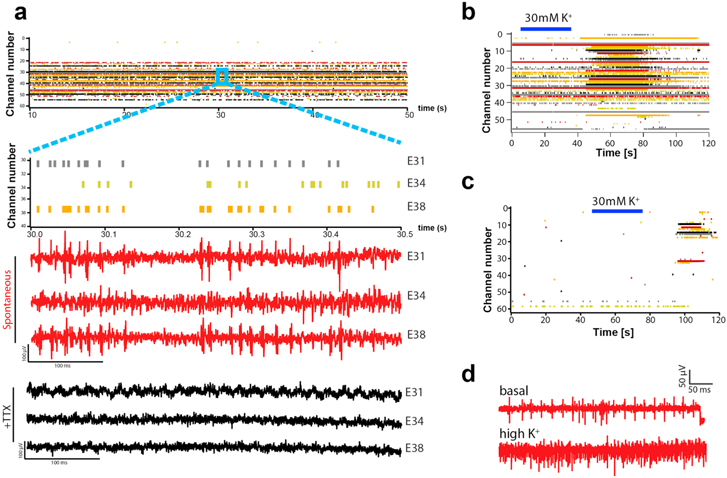
Figure 2. Electrophysiological characterization of SGNs on MEAs. (a) Raster plot of single electrodes (represented by different colored lines, 34 in this experiment) visualizing the detected SUPs in a highly active culture. Three electrodes (E31, E34 and E38) are selected for clarity and their response is shown. Raw traces for the same electrodes prior to (red) and after (black) application of TTX are shown. (b) Raster plot visualizing detected SUPs in a highly active culture perfused with ECS followed by perfusion with high potassium solution (30 mM K+, blue bar). (c) Raster plot visualizing detected SUPs in a representative low active culture perfused with ECS followed by perfusion with high potassium solution (30 mM K+, blue bar). (d) Representative example of raw data traces obtained for spontaneous activity during basal activity (top trace) and after perfusion with 30 mM K+ (bottom trace) from the same electrode. (e) Representative example of raw data traces from six electrodes (E21, E26, E22, E19, E25, E20) as shown in (f), obtained after electrical stimulation from a neighboring MEA electrode (electrode 58 in figure (f)) using a biphasic pulse (50 μA, 40 μs). The stimulation artefact is shown (black arrow head). Action potentials are generated shortly after the stimulus (gray shaded area). Insert (e´) shows a representative example of an action potential elicited by electrical stimulation and blocked by TTX (black trace). (f) Right: spiral ganglion explant culture on MEA immunostained for TUJ at day 18 shows the extent of coverage of the MEA surface by neuronal processes. Electrodes are indicated with white dashed lines for clarity. An example of response to stimulation is shown: green labeled electrode was used for stimulation (E58), red labeled electrodes detected neuronal response (E21, E26, E22, E19, E25, E20). Left: a magnification of the area (right) is shown. Electrodes are indicated with white dashed lines for clarity. Scale bars =100 μm. (g) The average number of responding electrodes at day 6 (n = 6 independent MEAs), day 12 (n = 6 independent MEAs) and day 18 (n = 3 independent MEAs) per MEA is shown. Each electrode from the MEA is used consecutively for stimulation using a biphasic pulse with a total duration of 80 μs (anodic phase first) and 80 μA amplitude. The total number of responding electrodes per experiment is annotated. Data are given as median (Mann–Whitney test *p < 0.05). (h) Percentage of responding electrodes following biphasic stimulation (40 μs total duration; 50 or 100 μA amplitude) displaying two SUPs per MEA. (n = 63 stimulation sites in 18 independent MEAs). (h') Representative example of an electrode responding with 2 SUP at 100 μA (black trace) and with 1 with 50 μA (red trace). (i) Total number of SUPs detected per MEA is shown for basal activity and activity after treating the culture with CNQX. Stimuli were applied consecutively to all MEA electrodes. Data are given as mean ± SEM (n = 8 independent experiments).
Download figure:
Standard image High-resolution imageStimulation with MEA
For electrical stimulation of the culture from the MEA itself, monopolar biphasic stimuli were applied via one of the electrodes and the responses were recorded from the remaining ones. The stimuli were applied with an anodic or cathodic phase duration of 20 μs–100 μs, respectively. The stimuli were either voltage (0–1500 mV in 250 mV steps) or current (0–150 μA in 25 μA steps or 0–80 μA in 5 μA steps) controlled by a stimulator (Multi Channel Systems Stimulator STG 2008). The stimulation was performed manually with 10 consecutive pulses. Only electrodes responding with an action potential in at least 7 out of 10 stimulations were defined as responding electrodes and further analyzed.
For the comparison of single biphasic pulses and train stimulations (consecutive single pulses) (figures 3(c)–(f)), pairs of neighboring electrodes were chosen: the first electrode was selected for stimulation while a neighboring electrode was used for recording. We first identified the threshold for a single biphasic pulse of 40 μs to elicit a positive response from the neighboring electrode. Then, we increased the total duration of the pulse by applying a 80 μs long single biphasic pulse or train stimulation. With the new pulse we decreased the current in 5 μA steps to find the respective thresholds (7/10 response). The same procedure was used for 120, 160 and 200 μs total pulse durations. For the generation of figure 3(e), we did not measure every amplitude/duration combination to keep the duration of an experiment reasonably short and get reliable results. We assume that an electrode that responds to a stimulation with a given strength and duration, will also respond to a pulse with the same strength but with longer duration. This was extrapolated up to an energy level of 9 nJ (150 μA, 40 μs pulse), being the maximum level tested. This assumption was confirmed with punctual tests, namely, if an electrode responded at 120 μs and 200 μs, we assumed it would also respond at intermediate values (160 μs) and this was confirmed in a subset of electrodes.

Download figure:
Standard image High-resolution image
Figure 3. Evaluation of different pulse configuration to activate SGN on MEA. (a) The average number of responding electrodes after stimulation from a single electrode is plotted for different stimulation voltages applied (ranging from 0 to 1500 mV). A biphasic pulse is applied with a total duration of 40 μs with either anodic of cathodic phase first. Data are given as mean ± SEM; Mann–Whitney test (n = 35 independent electrodes from 10 independent MEA). (b) The average number of responding electrodes after stimulation from a single electrode is plotted for different stimulation currents applied (ranging from 0 to 150 μA. A biphasic pulse is applied with a total duration of 40 μs with either anodic or cathodic phase first. Data are given as mean ± SEM; Mann–Whitney test (n = 35 independent electrodes from 10 MEA). (c) Schematic representation of the different stimulation patterns used on our culture. Stimuli are either prolonged by increasing the number of repetition of the single pulses (red, train stimulation) or by lengthening each phase, but maintaining a single biphasic pulse (black). (d) Biphasic pulses and train stimulations of equal duration are compared. The average stimulus amplitude (μA) required to elicit a response at a neighboring electrode is plotted for each given pulse duration. *p < 0.05, **p < 0.01 versus corresponding single biphasic pulses Mann–Whitney test (n = 12 electrodes). (e) Percentage of electrode pairs with the recording electrode responding to 80 μs (black squares) and 160 μs (black dot) single biphasic stimulation and 80 (red squares) and 160 μs (red dots) train stimulation compared to the 40 μs standard stimulus (green) (n = 12 electrode pairs). (f) Biphasic pulses or train stimulations of equal duration are compared. The average energy (nJ) required to elicit a response at a neighboring electrode is plotted for each given pulse duration (single biphasic pulse: 40 μs n = 20; 80 μs n = 53; 120 μs n = 16; 160 μs n = 6; 200 μs n = 4) (train stimulation: 40 μs n = 25; 80 μs n = 23; 120 μs n = 4; 160 μs n = 4). **p < 0.01 versus corresponding single biphasic pulses; Mann–Whitney test (n = 12 electrodes). (g) Schematic representation of the different stimulation patterns used on our culture. The total pulse duration ranges from 80 to 200 μs. A: Standard stimulus B: quasi-monophasic pulse. C, C' and C'': biphasic pulses containing 20, 40 and 60 μs of interphase gap. (h) Biphasic pulses (A in schematic) are compared to quasi-monophasic (B) or pulses containing and interphase gap (C, C' and C''). The threshold energy (nJ) is plotted for each given pulse configuration *p < 0.05, ***p < 0.001; Mann–Whitney test (n = 12 electrodes).
Download figure:
Standard image High-resolution imageFor quasi-monophasic pulses (figure 3(g B)) and pulses with an interphase gap (figure 3(g C, C' and C'')), a standard biphasic stimulus of 80 μs was used as a reference to identify the lowest amplitude threshold to elicit a response from a neighboring electrode. The pulse was then modified and the current decreased in steps of 10 μA. For quasi-monophasic pulses, the area under the curve of the anodic and cathodic phase was kept constant. The time/amplitude-ratio chosen for these experiments was 1–4, thus an anodic phase duration of 40 μs with an amplitude X results in a cathodic phase duration of 160 μs with an amplitude X/4 (figure 3(g B)). For the interphase gap, three durations were applied, 20, 40 or 60 μs (figure 3(g C, C' and C'')).
Stimulation using an external electrode
A schematic of the setup with the custom-made external electrode, provided by MEDEL (Innsbruck, Austria), mounted on a micromanipulator (Sutter Instruments, USA) and the MEA used for recording is shown in figure 4(a). The external electrode was used to mimic the CI electrode (100% platinum and 300 μm diameter) but was composed of a wire made of 90% platinum and 10% iridium, with a diameter of 127 μm that was encased for electrical isolation in medical-grade silicone and mechanically stabilized by a glass pipette. The tip of the wire was free of silicone and used for stimulation (3.5 k impedance). Random areas of spontaneous neuronal activity were detected on MEAs and further chosen as location for external-mediated stimulation. The electrode was placed in the center of the selected area and moved in a step-wise fashion away from the culture. This process was visually controlled using a microscope to avoid damage to the culture. Measurements were performed at 0 (gapless configuration), 10, 20, 30 and 40 μm above the culture using a biphasic stimulus ranging from 0 to 1500 mV in 250 mV steps with a biphasic stimulus starting anodic first. Stimulation was performed with three consecutive pulses. Responses of the SG neurons were recorded on the MEA. The number of responding electrodes on the MEA was used as a proxy for estimating the efficiency of stimulation.
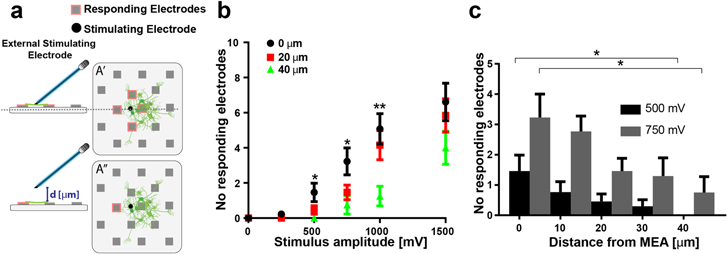
Figure 4. Distance dependence of SGN responses to stimulation. (a) Schematic representation of the setup used for external stimulation. An external electrode mounted on a micromanipulator is placed in contact with the culture and then moved away from the culture in steps of 10 μm. The external electrode is used for stimulating the culture with a biphasic pulse of 40 μs and amplitude ranging from 250 mV to 1500 mV. Examples of responding electrodes for two distances (d) are shown (A' and A''). (b) The average number of responding electrodes for a gapless position (black) or for 20 μm (red) and 40 μm distance (green) is shown. Data are given as mean ± SEM *p < 0.05, **p < 0.01 Mann–Whitney test (n = 12 electrodes), and refer to the comparison 0–40 μm. (c) The average number of responding electrodes for a gapless position, 10, 20, 30 or 40 μm distance is shown for a stimulating pulse of 40 μs duration and 500 mV amplitude (black bars) and 750 mV (gray bars). Data are given as mean ± SEM *p < 0.05; Mann–Whitney test (n = 13 electrodes).
Download figure:
Standard image High-resolution image
Energy estimation
To estimate the energy of the stimulation pulses used in our experiments, the equations E = R · I2 · t (for current stimulation) or E = U2 · t/R (for voltage stimulation) were used. R is the resistance of the stimulation electrode, I the current amplitude, U the voltage amplitude and t the total duration of the stimulus. For MEA electrodes, the average resistance R was assessed in four cultures (five electrodes each) by applying current pulses by a stimulator (Multi Channel Systems Stimulator STG 2008, Germany) and measuring simultaneously the voltage on an oscilloscope (Tektronix TDS 210, USA) and using the equation R = U/I. For the external electrode, the threshold voltage U was obtained from a linear fit to the stimulus response curves and the known resistance of 3.5 k was used.
Response analysis
A custom-made Labview software (National Instruments, Switzerland) was used to control the A/D card (NI-DAQ-card, AT-MIO-64E-3, National Instruments, Switzerland). Data were digitized at a rate of 6 kHz with 12 bit resolution and stored on a hard disk for offline analysis (see Tscherter et al 2001). For recordings of spontaneous and potassium induced activity, single unit potentials (SUPs) were detected using a peak-detection algorithm and visualized as raster plots (custom-made IgorPro software package, Wavemetrics, USA). The selectivity of the algorithm was controlled using recordings obtained in the presence of TTX. For the evaluation, spontaneously active electrodes were defined as electrodes showing a minimum activity of 0.1 SUP per second. A successful MEA experiment was defined as a MEA culture showing the above-defined SUPs in at least one electrode. Alternatively, for recordings of activity induced by stimulation, SUPs were detected and annotated manually. A positive response was defined as a spike appearing at a constant time delay after stimulation in at least 7 of 10 consecutive stimuli. The appearance at a fixed time point allowed for exclusion of spontaneously occurring action potentials. The minimum amplitude considered for an AP was 25 μV. The presence of two instead of just one action potentials per electrode following stimulation was assessed in a subset of experiments (18 independent MEA cultures, using 63 independent electrodes for stimulation in total), manually annotated, and expressed as percentage of responding electrodes displaying two SUPs per culture. Two different stimulation pulses were used: (1) biphasic, 40 μs total duration, 50 μA amplitude (E = 1 nJ), (2) biphasic, 40 μs total duration. 100 μA amplitude (E = 4 nJ).
Statistical analysis
Multiple comparison analysis was done using ANOVA multiple comparison (with Bonferroni correction). For 2 group comparisons, the Wilcoxon–Mann–Whitney-test was used for non-parametric data analysis. For parametric tests, Student's t-test was used. Statistical analysis was performed using Graph Pad Prism 6 (GraphPad Software, La Jolla, CA 92037 USA). Data are shown as mean ± standard error of the mean (SEM). Significance was labeled as ns (p > 0.05), *(p < 0.05), **(p < 0.01) and ***(p < 0.001).
Results
Characterization of SGN explant growth and spontaneous activity on MEA
We set up to identify the optimal neuronal cell source and culture condition that would allow measurement of auditory neuron response profiles to extracellular stimulation on MEA (total number of 68 electrodes and a inter-electrode spacing of 200 μm). Therefore, different cell preparations were assessed including primary and neuronal progenitor/stem cell derived neurons (supplementary material and supplementary figure S1). Neuronal density and the length of the processes were identified as initial key parameters to select upon. We estimated cellular density using a image based approach where the surface area occupied by neurons (TUJ+) was estimated relative to the total DAPI area (supplementary figure S1(b)). Based on this initial assessment, we choose for our study SGN explant cultures, given the robust outgrowth of neuronal processes in vitro (supplementary figure S1 and figure 1), which extended for over two millimeters (data not shown and supplementary figure S1(d)).
To maximize neuronal density on MEAs, two to three explants were plated on each array in co-culture with the Organ of Corti, placed outside the recording area, to provide trophic support (schematic in figure 1(a)). Neuronal density increased with prolonged culture: 31.8% ± 1.79 (N = 3) of the electrode functionalized area was occupied by TUJ + cells at day 6 and increased to 43.26% ± 5.5% (N = 6) at day 18. Representative examples for 3 time points (after 6, 12 and 18 DIV) are shown in figure 1(b).
In order to specify whether the neurons in our SG explant cultures were type I or II cells, we determined the ratio of peripherin-positive neurons (type II) over the total of TUJ positive cells (Hafidi 1998, Huang et al 2007, Barclay et al 2011). For 3 time points in culture, this ratio was below 5% (figures 1(c) and (d)). Therefore, while not exclusively, the electrophysiological characterization described below is largely representing the activity of type I SG neurons.
To test the functionality of the SG explants on MEAs and to define optimal time points for further analysis, we measured neuronal activity by detecting spontaneously occurring action potentials, here tagged SUPs, at day 6, 12 and day 18 in culture. At the three time points, we determined the number of successful experiments (figure 1(e)), the number of spontaneously active electrodes per successful culture (figure 1(f)) and the SUPs frequency in active electrodes (figure 1(g)). At each time point 6 independent cultures were measured. At day 6, only 2 showed spontaneous activity, while at day 12 and 18, in 4 out of 6 cultures we detected spontaneous activity in at least one electrode per MEA (see methods for SUP detection and the precise definitions for successful cultures and spontaneously active electrodes). We detected spontaneous activity starting from day 6 onwards, being the earliest time point assessed, and observed an increase with prolonged culture time, however, this was not statistically significant, but in agreement with the increase in neuron coverage of the electrode area.
As older cultures appeared to provide more reliable results, further analysis was performed exclusively on 16–19 DIV cultures. Overall, a total of 98 experiments were performed within this study, using primary 18 DIV cultures and we detected spontaneous activity in 80% of the cultures, from a number of electrodes ranging from 1 to 34 per MEA.
Electrophysiological analysis of SG explants on MEAs
In order to confirm the neuronal origin of the detected SUPs, TTX was applied to block voltage-gated sodium channels. An example of traces from a culture showing spontaneous activity is shown in figure 2(a). A raster plot showing all active electrodes in the culture is shown (top panel). Three channels are selected for clarity (electrodes 31 (E31), 34 (E34) and 38 (E38)) and their raw traces prior to (red traces) or after (black traces) application of TTX are shown. In cultures where little spontaneous activity was observed, we investigated whether mature neurons were present but only rarely active by superfusing the cultures with an ECS containing 30 mM potassium to depolarize neurons and to elicit action potentials. 14 out of 20 cultures tested showed an increase in the firing rate (SUP/s). This was on average a 6.5-fold increase (range from 1.08 to 33 fold increase). An example of a highly active culture, further enhanced by high potassium superfusion is shown in figure 2(b). In some cases, electrodes from which no spontaneous activity could be detected under basal conditions became active upon superfusion with high potassium (figure 2(c)). These findings indeed revealed the presence of rarely active mature neurons. Original traces are shown in detail for spontaneous (figure 2(d) top) and high potassium induced activity (figure 2(d) bottom).
Besides recording spontaneous activity, the MEA setup also allowed us to comparatively assess optimum electrical stimulation parameters for auditory SG explant cultures. A rectangular biphasic pulse with a total duration of 40 μs was used as a reference stimulus. Stimuli were applied via one of the MEA electrodes and the responses were recorded from the remaining ones. An example of SUPs that were induced by such a pulse is shown in figure 2(e). Electrode numbers correspond to the electrodes depicted in figure 2(f), from nearest (E21) to farthest (E20) away from the stimulating electrode (E58). Again, upon incubation with TTX, the electrically induced response was abolished (figure 2(e´) (insert, black traces).
Immunostaining of SG explant cultures on MEAs for the neuronal marker TUJ revealed both somata as well as processes of neurons on the electrode surface (figure 2(f) right panel). Due to the high cellular density it was not possible to accurately discriminate between the two and attribute the recordings exclusively to one or the other.
Experiments, in which stimuli were applied consecutively to all MEA electrodes, revealed that, also in this case, the number of responding electrodes per MEA increased with prolonged time in culture (figure 2(g)). For further analysis, 18 DIV was used as a standard.
In addition, we evaluated the percentage of electrodes in which multiple SUPs could be detected following stimulation (biphasic pulses of 40 μs total duration). This observation was overall a rare event and depending on the energy of the pulse used for stimulation (figure 2(h)). Indeed, only 1.6% ± 1 of all responding electrodes per culture displayed two SUPs following biphasic pulses of 50 μA amplitude (estimated energy 1 nJ), but 3% ± 1.4 following 100 μA amplitude pulses (estimated energy 4 nJ). Precisely, we stimulated in 18 independent MEA cultures with totally 63 electrodes and induced with a 50 μA pulse two SUPs in 5 out of 184 responding electrodes and in 24 out of 411 with the 100 μA pulse. Electrodes responding with more than 2 SUP were not observed. A third (9/24) of these electrodes where double SUPs were obtained at 100 μA, only responded with a single SUP at 50 μA, confirming that the appearance of a second action potential depends on the stimulation strength. The latency between the 1st and 2nd event was 2.9 ± 0.4 ms (n = 5) or 3.1 ± 0.5 ms (n = 24) respectively for the lower and high energy pulse.
To evaluate whether synaptic transmission is involved in the generation of the activity measured on MEA, the glutamatergic receptor blocker CNQX was added to the culture and electrode-induced stimulation was assessed. Stimuli were applied consecutively to all MEA electrodes. Our analysis did not reveal a statistically significant difference in the number of SUPs detected per MEA: 36.0 ± 8.4 and 38.1 ± 7.4 in untreated and CNQX treated culture, respectively, (n = 8) (figure 2(i)). Furthermore, we found short latencies, on average 1.67 ms ± 0.05 and 1.72 ms ± 0.06 (n = 8) for untreated and CNQX treated respectively. We therefore conclude that there is no evidence for the formation of glutamatergic synaptic connections between the neurons in our explant cultures.
Characterization of the most effective electrical stimulation protocols
We then assessed the effect of stimulus shape for voltage-controlled stimuli, ranging from 0 to 1500 mV (figure 3(a)) as well as for current-controlled stimuli ranging from 0 to 150 μA (figure 3(b)). The number of responding electrodes to each stimulation protocol was used as a readout of the effectiveness of the stimulation. No statistically significant difference between biphasic pulses starting with an anodic versus cathodic phase was observed in voltage (figure 3(a)) and current controlled experiments (figure 3(b)). There was however a trend for higher numbers of responding electrodes when stimulating with an anodic phase first, under voltage and current control.
In a further step we aimed at identifying a pulse-shape that reduced the energy required to elicit a response compared to the previously used standard stimulus. For these experiments, pairs of neighboring electrodes were chosen: the first electrode was selected for stimulation while a neighboring electrode was used for recording. For the 40 μs stimulus the minimum current stimulation required to induce SUPs from at least one electrode was 56.5 μA ± 2.9. We modified the standard stimulus by increasing the duration in two alternative fashions as exemplified in figure 3(c): on the one hand we increased the repetition of 40 μs standard stimuli (train stimulation, red lines), on the other hand, we increased the anodic and cathodic phase duration (long pulse, black lines). We found that increasing the anodic and cathodic phase duration is significantly (p = *0.05; **= 0.01) more effective than increasing the number of short stimuli in the train, as the former allows for much greater reduction in the amplitude of the threshold current, in particular for long stimuli (figure 3(d)). Further, it shows a larger percentage of electrode pairs with a responding recording electrode (figure 3(e), see methods). We further estimated the energy used in the two stimulation protocols. Increasing the duration for a single biphasic stimulus reduced the energy of the pulse at threshold 2.4 and 4 fold, respectively for the 120 and 160 μs stimuli, compared to the standard pulse, while there is a 2.5 and 3.3 fold increase of threshold for the train stimulation, respectively for the 120 and 160 μs stimuli (figures 3(d) and (f)).
In a second set of experiments, interphase gap and quasi-monophasic stimulation were used to further optimize the stimulation of the explant culture. An interphase gap is achieved by inserting a zero-current period between the two phases of a biphasic stimulus. Three durations for this gap were applied 20, 40 and 60 μs, while the duration of the anodic and cathodic phases was kept constant at 40 μs each (schematic in figure 3(g)). For the experiments with quasi-monophasic stimuli, a long and low-amplitude phase was combined with a short and high-amplitude phase. The area under the curve of the anodic and cathodic phase was kept constant (see methods). The results of these experiments are shown in figure 3(h). Pairs of neighboring electrodes were chosen: the first electrode was selected for stimulation (0–150 μA) and a neighboring electrode for recording. A biphasic stimulus (A) (figure 3(g)) with a total duration of 80 μs was used to define the threshold in current amplitude at which the recording electrode failed to respond. Next, the biphasic 80 μs stimulus was modified either by introducing a quasi-monophasic pulse (B) (figure 3(g)) or an interphase gap (C, C', C'') (figure 3(g)) and again the threshold was determined. The threshold levels of each pulse configuration are shown in figure 3(h). Using a quasi-monophasic pulse, we were still able to induce a response, even at significantly lower energy levels (figure 3(h)). Both the quasi-monophasic pulses as well as the insertion of a short interphase gap resulted in significantly reduced estimates from 2.29 ± 0.45 nJ to 1.24 ± 0.21 nJ (biphasic; p < 0.001), 1.77 ± 0.32 (40 and 60 μs interphase gap; p < 0.05) in current compared to the standard biphasic stimulus.
Distance-dependent responses of SGN explant cultures to external electrical stimulation
Stimulation of the auditory neurons from a gapless position is believed to allow for reduction of energy consumption of CIs, as well as for improving frequency resolution. To validate this concept in vitro, we have been assessing the distance dependent response of the auditory neurons to an external stimulating electrode.
By increasing the distance of the stimulating electrode to the SGN explant culture on the MEA, the number of responding electrodes was substantially reduced. In figure 4(b) we show the results for stimulation with the external electrode at distances of 0, 20 μm and 40 μm. As expected, the closer we are with the external electrode to the culture, the more electrodes respond to the stimulation. This fact is shown in more detail for low stimulation voltages of 500 and 750 mV in figure 4(c). We estimated the energy of the pulse needed for successful stimulation of the culture. For this, the voltage required to activate a minimum of one electrode was extrapolated from linear fits to the measured response curves (as shown in figure 4(b)). From these threshold voltages, the energy to elicit a stimulus was estimated. While in a gapless configuration, 1.5 nJ was sufficient to elicit minimal responses, 7.5 nJ were required once the electrode was placed at 40 μm. Summarized, a gapless position of the external electrode reduces the energy content of the pulse required for minimal stimulation.
Discussion
This study is the first to utilize MEAs for analysis of electrophysiological characteristics of auditory neuron populations in vitro. Extracellular electrode based stimulation and recording using MEAs is in our view a well-suited approach to identify effective stimulation protocols and parameters that could be used to optimize neuroprosthetic devices such as CIs.
Characterization of electrophysiological behavior of SGNs on MEAs
The selected MEA platform enabled us to detect SGN spontaneous activity (figures 1 and 2) as well as stimulus-induced activity (figures 2 and 3) in cultured primary neurons. SG explants appeared to be a robust primary culture for these assessments, possibly because of the preservation, at least in part, of tissue organization and composition. SG explant cultures have been moreover successfully used by other groups for electrophysiological assessment of firing characteristics of SG neurons (Liu and Davis 2007) using patch clamp approaches.
Microexplant cultures also allowed for MEA recordings (supplementary figure S2), however this was attempted only in 2 to 3 cultures. Other cell preparations described in the supplementary material were not tested for recording due to the extreme low density of the neurons on the array (supplementary figure S1 (c)). Further optimization may be needed for these cultures in order to increase cellular density and neuronal coverage of the electrode array.
Neuronal activity was observed already at 6 DIV, in agreement with previous reports (Lin and Chen 2000). At this early time point however, a lower number of electrodes showed activity, compared to later time points. In addition, the firing rate (SUP/s) was continuously increasing over time (figures 1(e)–(g)). These data suggest that some degree of maturation, in combination with improved covering of the electrodes, occur through extension of the culture time from day 6 to day 18 days in vitro. Based on our immunostaining results it is reasonable to assume that the activity recorded in our experiments is predominantly from type I neurons, as less than 5% of the neurons stained positive for peripherin, an intermediate filament specific for type II neurons (figures 1(c) and (d)). This finding is in line with observations by others, where it was shown that at postnatal day 6, more than 95% of auditory neurons present in the SG are in fact type I neurons (Barclay et al 2011).
Single cell recordings using patch clamp have been pivotal in the characterization of the electrophysiological properties of SGNs as a function of maturation stages. Heterogeneity in firing properties and voltage-dependent ionic currents of SG neurons were previously described depending on the apical or basal location of the neurons, (Mo and Davis 1997, Liu and Davis 2007, Liu et al 2014), as well as dependent on different neurotrophins, namely BDNF and NT3, exogenously provided to the culture (Adamson et al 2002, Zhou et al 2005, Needham et al 2012). We characterized the response profiles of early postnatal SG neurons, co-cultured as explants with the Organ of Corti and in the presence of BDNF, without discriminating between different locations within the cochlea. It is therefore possible that culture conditions used in this study have affected firing properties compared to the in vivo situation. Further studies will help to clarify if these intrinsic firing features can be discriminated also by extracellular recordings using this platform.
MEAs are mostly used to record neuronal network activity and to aid the understanding of network plasticity and connectivity in dissociated culture or tissue slices. However, in this study, we have no indication that SGNs develop synapses and form neuronal networks. Therefore, in all probability, we recorded with this platform the activity of a population of independent SGNs. Evidence for a direct activation of neurons without synaptic processing networks comes from the analysis of the latencies of the responses to stimulation (figure 2(i)). We found in fact short latencies, which were not affected by the addition to the culture of a glutamatergic/AMPA receptor blocker (CNQX).
Due to the absence of a neuronal network and the specific features of our MEA platform, successful recording relied on high density of the neuronal culture, to allow for crossing, or very close proximity, of the same neuronal fiber over both the stimulating and recording electrodes. Even in high-density cultures, with neuronal coverage of 35–40% of the electrode covered area, the number of responding electrodes to a single stimulating electrode, ranged from 4 to 8 (out of 68). The responding electrodes were found mostly in proximity to the stimulation site (an example is given in figure 2(f)).
Because of the high cellular density on the MEA, it is not clarified if neuronal activity measured was actually derived exclusively from the processes or from the somata of the neurons, as both could be detected by immunostaining, close to the electrode pads (figure 2(f)). In the prospect of extrapolating our results for CI devices, it could be of importance to characterize the selective response of neurites versus cell bodies to electrical stimulation by using improved types of MEAs such as high density MEAs.
Translation of our findings to CI devices
This study has highlighted the importance of two important parameters with the potential to improve neuroprosthetic stimulation of auditory neurons by CIs: (1) the configuration of the electrical stimulation pulse and (2) the distance of the stimulating electrode from the targeted auditory neurons.
In our experiments we focused on charge-balanced biphasic stimuli, as they are actually used in clinical grade CIs to avoid damage of neural tissues (Shepherd 1991, Shepherd et al 1999, Bahmer and Baumann 2013) and of electrode contacts. In addition, these stimuli were found to be more effective than monophasic stimuli in E18 rat embryos neocortex cultures (Wagenaar et al 2004, Yazdan-Shahmorad et al 2011). However, this finding is in contrast to observations from guinea pig and cat animal models, where monophasic stimuli were more effective (Miller et al 2001). Similar to (Wagenaar et al 2004), we did not find a significant difference when comparing biphasic pulses starting with anodic or cathodic phase first, either when current- or voltage-controlled. We mostly focused on current controlled pulses in this study as the electrical field and potential near the electrode can be directly estimated (Maher et al 1999a) and CIs currently stimulate with current-controlled pulses to ensure a defined stimulus and maintain charge injection below safety limits (Shannon 1992).
We found that increasing the total length of the biphasic pulse is more effective than increasing the number of single consecutive stimuli (train stimulation). This allows for lowering the minimum current threshold as well as the total energy required to elicit a response. The effect becomes significant starting with pulses of 120 μs in duration, and is more pronounced with longer pulses (figures 3(c)–(f)). We also identified quasi-monophasic pulses as very energy-effective pulses to induce SGN activity. Similarly, the introduction of an interphase gap slightly reduced the thresholds compared to a standard biphasic pulse, however to a lesser extent.
The excitability of neuronal tissue by pulsed electrical stimulation has been described in strength duration curves that are characterized by the rheobase and the chronaxie (Shepherd et al 2001, Rattay et al 2012). The rheobase is the minimal stimulus amplitude for infinitely long stimuli and chronaxie is the minimal duration of the stimulus at twice the rheobase. With stimulus durations of 40–200 μs we are in the range below chronaxie (200–700 μs for unmyelinated axons) where the strength duration curve is mainly determined by the time constant of the charging of the membrane to reach threshold for activation. Therefore, decreasing the stimulus duration in this range has to be compensated by exponentially increasing stimulus strength with increasing charge transfer and energy consumption. This explains why longer stimuli are more energy-efficient than short pulses (including the quasi-monophasic pulses), why the long biphasic stimuli are much more efficient than the trains of short stimuli and also why the interphase gaps increase energy efficiency compared to the standard stimulus without a interphase gap.
Because of the high-frequency content of the acoustic signal and the need to stimulate electrodes in sequence, CIs have severe time constraints. A frame rate of more than 1000 Hz is needed to achieve maximal sound clarity with current coding strategies (Wilson et al 1991). Therefore, the end result is a biphasic pulse of short duration (in the order of 50 μs in total) and relatively high current amplitude (in the range of 0.1–1 mA). Current state-of-the-art CI technology does not allow long pulse durations at very high stimulation rates due to crosstalk between electrode contacts. In the context of a gapless interface between electrodes and the auditory neurons, however, this crosstalk between electrodes should be minimized and long pulses of low energy may become favorable. In addition, these long pulses may be safer to avoid stimulation induced nerve damage (Ramekers et al 2014) and may be a good starting point to reduce energy consumption of the entire CI device a prerequisite to develop fully implantable CI systems in the future, which may make hearing loss therapy invisible.
Interphase gap durations of up to several milliseconds have been shown to reduce hearing thresholds in CI patients (Carlyon et al 2005) and thus make stimulation more effective in terms of required current amplitude and power consumption. Therefore, the pulse configuration we have identified in this study may result in improving the efficiency and safety of the CI devices.
Finally, we confirmed the hypothesis that efficiency of SGN stimulation is increased by decreasing the distance between the stimulating electrode and the auditory neuron culture. In fact, by reducing this distance from 40 μm to 0 μm (gapless position), we could achieve stimulation of the neurons with a reduced energy of the pulse.
While currently the distance between the CI and SGN is in the order of hundreds of micrometers, recruitment of nerve fibers to the electrode array, by providing neurotrophic, chemoattractant and adhesion cues may resolve this anatomical gap. Infusion of neurotrophins in Scala Tympani has been shown to modulate neuronal sprouting (Wise et al 2005, 2011, Glueckert et al 2008). Provision of an extracellular matrix has been shown to induce SGN outgrowth (Chikar et al 2012). Further modification of the electrode array to implement directional growth to the electrode pads in combination with surface modification to allow for neuronal docking could lead to the development of a gapless interface between the implants and the neurons (Tan et al 2013).
In theory, the reduction in energy consumption achieved by reducing the gap between the neuronal processes and the CI could be as high as one order of magnitude. In animals implanted with a CI, the threshold values to evoke electrically-induced auditory brainstem responses are currently in the order of 100 μA and above (Coco et al 2007). Action potential generation in a situation in which the stimulation electrode is in direct contact to the neuron (it is axon) is achieved at approximately 5 μA (Maher et al 1999b) and similar results are obtained here for SGN cultures. Our model of the gapless interface may therefore allow for a more realistic prediction of possible energy reduction and stimulation efficiency increase. However, many other parameters that were not tested within our study, are critical for the overall energy consumption of a CI system and our results can therefore not be extrapolated directly for hypothetical future CI systems featuring a gapless interface to auditory neurons.
Overall, we can conclude that electrophysiological response profiles of auditory neurons can be reliably obtained on MEAs. In addition, the extracellular MEA technology offers a more representative model of neuroprosthetic stimulation of auditory neurons by CIs, through which performance of these systems could be improved in the future.
Acknowledgments
The authors thank the technician Ruth Rubli at the Physiology Department of the University of Bern, Switzerland for valuable technical help in the experiments, Professor Stefan Heller, Department of Otolaryngology, Head & Neck Surgery at the Stanford University of School of Medicine, USA, Professor Robin Davis Cell Biology and Neuroscience, Co-Founder and Acting Director, Brain Health Institute, Rutgers University, USA and members of the NANOCI consortium (www.nanoci.org) for valuable comments and advise. Pavel Mistrik and Claude Jolly form ME-DEL for providing the external stimulating electrode. The work performed in this study is part of the NANOCI project, which is funded through the FP7-NMP programme by the EU (Grant Agreement No. 281056).