

Abstract
Objective. The performance of neuroprostheses, including cochlear and retinal implants, is currently constrained by the spatial resolution of electrical stimulation. Optogenetics has improved the spatial control of neurons in vivo but lacks the fast-temporal dynamics required for auditory and retinal signalling. The objective of this study is to demonstrate that combining optical and electrical stimulation in vitro could address some of the limitations associated with each of the stimulus modes when used independently. Approach. The response of murine auditory neurons expressing ChR2-H134 to combined optical and electrical stimulation was characterised using whole cell patch clamp electrophysiology. Main results. Optogenetic costimulation produces a three-fold increase in peak firing rate compared to optical stimulation alone and allows spikes to be evoked by combined subthreshold optical and electrical inputs. Subthreshold optical depolarisation also facilitated spiking in auditory neurons for periods of up to 30 ms without evidence of wide-scale Na+ inactivation. Significance. These findings may contribute to the development of spatially and temporally selective optogenetic-based neuroprosthetics and complement recent developments in 'fast opsins'.
Export citation and abstract BibTeX RIS
Introduction
Spatial precision is a key advantage of optical neural stimulation techniques [1, 2], which is of importance in neural prosthetics such as retinal and cochlear implants where limiting the spread of electrical activation within tissues is a major challenge [1, 3–7]. Optogenetics in particular has been applied successfully to auditory stimulation in vivo [1, 2, 8, 9] and the approach was reviewed by Weiss et al [10]. While approaches such as focused multipolar electrical stimulation help reduce the spread of activation, they result in increased activation thresholds [7, 11]. Optogenetics, where light sensitive ion channels (opsins) are genetically inserted into cell membranes [12], has shown promise in improving spatial precision.
The most commonly used opsin is channelrhodopsin-2 and its variants (ChR2) which can generate action potentials (APs) when exposed to blue light near 470 nm. Unfortunately, these opsins have a higher power requirement and slower ion channel kinetics compared to electrical stimulation alone, which restricts the maximum stimulation rate achievable and limits the application of currently available optogenetic tools for implantable devices [1, 10]. Additionally, there are concerns over the phototoxic effects of long-term blue light exposure [13–15]. These factors have led to engineered ChR2 variants with faster ion channel dynamics and a peak sensitivity shifted towards red light. The fastest variants reported to date can be driven at frequencies approaching 500 Hz [16, 17] however for cochlear implants, which stimulate neurons that are capable of reliably firing at 1 kHz, higher stimulation frequencies may be desirable [18, 19]. Other potential targets for fast optical control include the spinal cord where stimulation rates up to 10 kHz have been demonstrated for pain relief [20], and retinal stimulation where sub-millisecond electrical pulses are used to selectively target retinal ganglion cells [21, 22].
Combining optical and electrical stimulation to evoke APs was first demonstrated with infrared neural stimulation [23]. Here a similar 'optogenetic costimulation' effect is described with the ChR2/H134 opsin variant in primary auditory neurons, the neural target of cochlear implant stimulation. By combining optical and electrical stimuli that are individually below the threshold to evoke APs, a combined stimulation technique has the potential to reduce power consumption and light exposure from optical stimulus, and to improve the temporal dynamics of optogenetic ion channels.
Materials and methods
The use and care of the experimental animals in this study were approved by St Vincent's Hospital (Melbourne) Animal Ethics Committee (#14-028 and #18-003) and follows the Guidelines to Promote the Wellbeing of Animals used for Scientific Purposes (2013), the NHMRC Code for Care and Use of Animals for Scientific Purposes (8th edition, 2013) and the Prevention of Cruelty to Animals Amendment Act (2015).
Spiral ganglion neuron (SGN) dissociated culture preparation
Transgenic mice expressing ChR2*H134R in SGNs were derived by breeding COP4*H134R/EYFP mice (Jax strain 012569:B6;129S-Gt(ROSA)26Sortm32(CAG-COP4*H134R/EYFP)Hze/J) with Cre-parvalbumin mice (Jax strain 008069:B6;129P2-Pvalbtm1(cre)Arbr). Cultures of dissociated spiral ganglion neurons (SGNs) were prepared from male and female postnatal day 3–5 transgenic mice. The mice were anaesthetized by hypothermia for euthanasia by decapitation. The temporal bones were dissected from the skull in a bath of minimal essential media (MEM) containing non-essential amino acids (Invitrogen, MA) and penicillin/streptomycin (Invitrogen, MA) and the otic capsule was removed from the cochlea. The spiralling sensory epithelium, including the hair cells, was removed leaving the central modiolus containing the SGN cell bodies. The modioli were placed in an enzymatic solution (HBSS (Invitrogen, MA) containing 0.2 mg ml−1 ethylene diamine tetra-acetic acid (EDTA), 0.025% trypsin (Merck, N.J.) and 0.01% DNaseI (Roche, Basel, Switzerland)) for 9 min at 37 °C. The reaction was terminated by the addition of fetal bovine serum (FBS; Trace Scientific, Melbourne, Australia). The digested tissue was centrifuged for 5 min at 1500 rpm and resuspended in MEM containing 0.02 mg ml−1 DNaseI and 0.01% FBS. Gentle mechanical tituration was performed followed by centrifugation for 5 min at 1500 rpm. The SGNs were resuspended in an appropriate volume (120 µl per coverslip) of neurobasal media (Invitrogen, MA) supplemented with N2 (Invitrogen, MA), L-glutamine (Invitrogen, MA), B27 (Invitrogen, MA), 20 ng ml−1 NT-3 (PeproTech, N.J.), 20 ng ml−1 BDNF (PeproTech, N.J.) and penicillin/streptomycin. The SGNs were plated onto 10 mm glass coverslips. Coverslips were coated with 0.01 mg ml−1 laminin solution (Invitrogen, MA) in 500 µg ml−1 poly-L-ornithine (Sigma, MO) and placed in an incubator at 37 °C, 10% CO2 24 h prior to use. Once plated, the media was changed after 4 h. Total culture time was 48 h prior to the patch experiment.
Electrophysiology
Glass pipettes were pulled from 15 cm thick-walled glass pipettes (SDR GC150F, Castle Hill, Australia) using a Sutter P87 Flaming Brown Micropipette Puller (Sutter Instruments, CA). Pipette resistance was 5–10 MΩ. The intracellular solution consisted of (in mM) K-glu 115, KCl 7, HEPES 10, EGTA 0.05. Sucrose was used for osmolarity (305–310 mOsm) and 2.5 M KOH to adjust pH to 7.1–7.3. Extracellular solution consisted of (in mM) NaCl 137, KCl 5, HEPS 10, D-Glucose 10, CaCl 2, MgCl 1. Sucrose was used to adjust osmolarity (305–310 mOsm) and 10 M NaOH to adjust pH to 7.3–7.4. All reagents were purchased from Sigma. A junction potential of 12.8 mV was subtracted from all recorded potentials.
Recording was carried out using a Multiclamp 700B digitizer (Molecular Devices, CA) and Digidata 1440A amplifier (Molecular Devices, CA) with a CV-7B head stage. An OptoPatcher (A-M Systems, WA) was used to align the fibre through the patch pipette. Recordings were made using Axograph software. The light source was a custom 488 nm laser (OptoTech, Melbourne, Australia) with light delivered through a 105 µm core silica optical fibre with 125 µm silica cladding, 3 mm PVC jacket and numerical aperture of 0.22 (AFW Technologies, Melbourne, Australia). The fibre was connected to the laser using an FC connector and the distal end was bare fibre. A schematic of the electrophysiology setup is available in figure S1 (stacks.iop.org/JNE/17/016069/mmedia). Laser settings including pulse width and power were set by a custom software interface connected by USB, and pulses were externally triggered by a Multiclamp 700B TTL output. Laser power was measured at the tip of the bare fibre in air with a Coherent Fieldmaster power meter and LM10 power meter head (Coherent, CA) as well as a photodiode. The linear region was determined, and a line of best fit used to convert input settings to output power (see figure S2).
Stimulus threshold levels for each stimulus mode were determined using pulses of increasing power (3 ms electrical, 10 ms optical). Pulse durations were selected to allow greater control of subthreshold membrane dynamics and are consistent with typical in vitro stimulation frequencies for SGNs, which are commonly below 70 Hz [24].
Threshold stimulus was determined at the stimulus intensity (injected current or irradiance) where APs occurred for at least five out of ten presented stimuli (pulse widths were 3 ms for electrical or 10 ms for optical). The holding current for cells was continuously monitored and stimulus thresholds were periodically reassessed using the same protocol. Cells where abandoned when the holding current exceeded 100 pA, which was often associated with a shift in AP threshold.
Experimental design statistical analysis
All analysis was carried out using custom scripts written in Python 3.6 using Jupyter Notebooks. Python libraries including pandas, numpy and scipy and statsmodels were utilised. Statistical tests, significance levels and sample sizes are stated in the text or figure captions. Sample sizes are typically given as the number of cells, with multiple repetitions carried out on each cell. Error bars are standard error of the mean (SEM) and in the text errors correspond to mean ± SEM.
Stimulus levels for both optical and electrical stimulation were placed in bins (5% for optical and 10% for electrical). For the triple pulse data, a holding level of −61 ± 4 mV (excluding junction potential) was required at the start of recordings. Recordings with optical power levels outside the linear region of the laser as determined by laser power measurements were discarded. For costimulation analysis, recordings where an optically evoked or electrically evoked AP was present were also discarded. APs were defined as a rapid spike in membrane voltage where instantaneous rate of change exceeded a threshold, as in Sekerli [25].
Code accessibility
The analysis software is available from https://github.com/willhartneuro/sgn_costimulation. Data files are available from https://web.gin.g-node.org/willhart/sgn_costimulation.
Results
Combined subthreshold stimuli evoke APs in auditory neurons
Dissociated SGNs were obtained from P3-5 transgenic PvalbCre × COP4*H134R/EYFP mice which express ChR2/H134. Cultured SGNs were 15–20 µm in diameter and characterised by a phase bright round cell body, visible nucleus and bipolar branching processes [26]. The enhanced yellow fluorescent protein (EYFP) enabled visual identification of ChR2 positive cells. A typical ChR2/H134R-positive SGN is shown in figure 1(a).
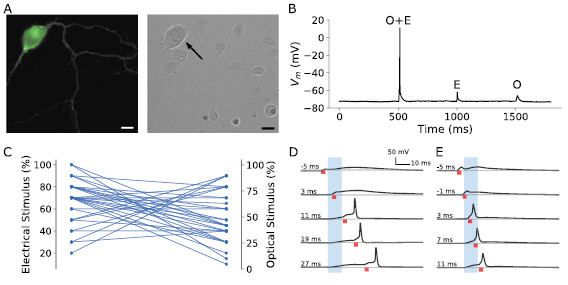
Figure 1. (a) A typical SGN in dissociated culture, shown using fluorescence microscopy (left, enhanced yellow fluorescent protein, EYFP), and with a bright field image (right). Scale bars are 10 µm. (b) A typical cell response to a triple pulse costimulation protocol. Firstly, a combined optical and electrical pulse (O + E at 500 ms), each individually below threshold, followed by an isolated electrical (E at 1000 ms) and isolated optical stimulus (O at 1500 ms) at the same stimulus levels. In this recording, electrical stimulus was 50% of threshold, optical 90% of threshold. (c) Costimulation power levels where APs were evoked, for all delays between optical and electrical stimuli. (d) and (e) Example O + E costimulation voltage traces, each panel taken from a different cell, with various delays between the two stimuli, and with different power levels showing the time dependency of APs. The power levels are (d) 40% optical, 40% electrical, and (e) 45% optical, 80% electrical. The electrical stimulus is denoted by a red bar underneath each trace, while the optical stimulus is denoted by the blue shaded region. The delay between the two stimuli increases from top to bottom and is noted on the figure, relative to the start of the 10 ms optical stimulus. A delay of −5 ms indicates electrical stimulation begins 5 ms before the start of the optical stimulus.
Download figure:
Standard image High-resolution imageFor each neuron examined, the firing threshold (the power level where APs were evoked for at least half of presented stimuli) was determined separately for 3 ms electrical pulses (176 ± 13 pA) and 10 ms optical stimuli (10.3 ± 3.4 mW, measured at the tip of the optical fibre in air). This threshold power is defined as 100% stimulation level, while power levels below or above are denoted 'subthreshold' and 'suprathreshold' respectively. The exact number of neurons recorded with each stimulus protocol is noted in the results below.
To examine the potential of costimulation to evoke neural firing, three sequential pulses were then applied in current clamp mode: combined optical and electrical (O + E), electrical only (E) and optical only (O), with individual power levels set to subthreshold levels. Figure 1(b) shows an example trace from this protocol with the O + E pulse evoking an AP while separate pulses did not. A plot of the combinations of optical and electrical stimulus levels that evoked APs is in figure 1(c).
Costimulation APs obtained from two different neurons are shown in figures 1(d) and (e), each at different power levels with the delay between optical and electrical stimuli varied. In each case there is a temporal dependency for the costimulation effect, as most APs occur later in the optical stimulation period or after the completion of the optical input.
In wild type cells not expressing ChR2, optical pulses did not elicit membrane depolarisation, and when presented together with electrical stimulation as high as 90% also failed to elicit APs (n = 4 cells, see figure S3). These results indicate that the presence of ChR2/H134 in the membrane is required to elicit costimulation APs.
Costimulation APs have similar characteristics to electrical APs
The key characteristics of APs were evoked by four stimulus modes—O, E, O + E and all-electrical (E + E) costimulation. The all-electrical electrophysiology protocol was used to identify whether cells responded differently to stimuli following electrical or optically mediated depolarisation. This protocol substituted the 10 ms optical pulse by a 20 ms electrical ramp. The ramp current was tuned for each cell to evoke a depolarisation of similar magnitude to that from the 10 ms optical stimulation. A schematic of this protocol is available in figure S4. The response to these four stimulus modes are shown in figure 2(a). Mean amplitude for APs was significantly different for all stimulation methods (one-way ANOVA, p < 0.01), with costimulation spikes having the largest amplitude (105.6 ± 0.6 mV, n = 7 cells) followed by electrical (100.2 ± 1.4 mV, n = 11 cells) and then optical (87.1 ± 1.5 mV, n = 21 cells). The mean spike duration at 0 mV was also significantly different (one-way ANOVA, p < 0.01). Costimulation APs (0.87 ± 0.01 ms, n = 7 cells) had significantly shorter duration than electrically evoked APs (1.29 ± 0.02 ms, n = 11 cells, TukeyHSD p = 0.001) and optically evoked APs (1.19 ± 0.04 ms, n = 21 cells, TukeyHSD, p = 0.001).
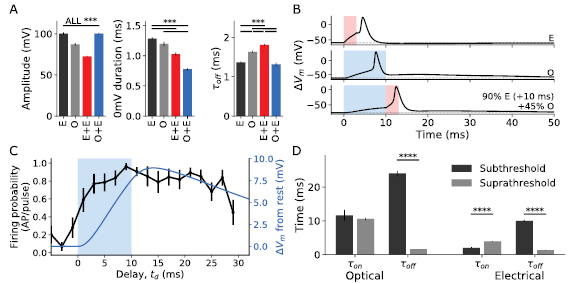
Figure 2. (a) Characteristics of the AP shapes for E, O, E + E and O + E stimulation. The amplitude of APs (from the holding potential to the maximum voltage reached during the AP), the duration in milliseconds at the 0 mV crossing point, and the off time constant, given as the time for APs to decay to 36.8% of the peak value. Significance from TukeyHSD, *p ⩽ 0.05, **p ⩽ 0.01, ***p ⩽ 0.001. Error bars are SEM. For optical, n = 21 cells, for electrical n = 11 cells, for all-electrical n = 7 cells, and for costimulation n = 7 cells. (b) Comparison of three APs—E, O and O + E. The blue shaded area indicates optical stimulus, while the red shaded area indicates electrical stimulus. In O and O + E stimulation, a slow repolarisation of approximately 40 ms is evident following the AP. (c) The probability of costimulation stimuli to elicit APs based on the delay of the electrical pulse relative to the optical pulse. All the power levels considered here exceed the costimulation threshold across all delays where the electrical stimuli lag the onset of optical stimuli. The average membrane potential during optical stimulation where APs are not evoked is overlaid in blue, and the duration of the optical stimulus is shaded blue. (d) Comparison of time constants for subthreshold and suprathreshold optical and electrical stimuli. There are substantial differences in dynamics between subthreshold and suprathreshold stimulus responses. Significance from two-tailed t-test, **** indicates p ⩽ 0.0001. Error bars are SEM.
Download figure:
Standard image High-resolution imageThe 'off' time constant τoff, defined as the time taken to repolarise from peak to 36.8% of peak amplitude following an AP, was not significantly different for costimulation and electrically evoked APs (costimulation 1.22 ± 0.06 ms, electrical 1.36 ± 0.03 ms, TukeyHSD, p = 0.16) while optically evoked APs had significantly slower off dynamics (1.63 ± 0.03 ms, TukeyHSD, p = 0.001) which suggests that costimulation APs are predominantly driven by the electrical trigger pulse. Optically stimulated cells (both O and O + E) had a persistent low-level tail depolarisation which was not captured by these time constants but is evident in the AP traces in figure 2(b).
Costimulation firing probability depends on membrane potential and rate of change
To determine optimal timing of stimuli required to evoke a costimulation AP, the onset of the electrical stimulus was varied relative to the optical stimulus. Initially electrical stimulus led electrical by 3 ms and was subsequently delayed in increments of 2 ms until it lagged the onset of optical stimulus by up to 30 ms. APs were more likely to be fired when the electrical stimulus occurred after the onset of optical stimulus. For stimulus levels which were shown to produce costimulation APs, a threshold firing probability of 0.5 spikes per pulse was achieved when electrical stimuli were presented 3 ms after the onset of optical stimulation, see figure 2(c). The firing probability approached one when electrical stimulus onset lagged the onset of optical by 10 ms, which is also the point at which optical stimulus ceases but before the maximum voltage deviation. The firing probability remained high for 15 ms after the cessation of optical stimulus, before decaying slowly.
Overlaid in blue in figure 2(c) is the average change in membrane potential resulting from subthreshold optical stimulation. This had positive correlation with the firing probability (Pearson correlation coefficient ρ = 0.85, p < 0.001). The rate of change of membrane potential was poorly correlated with firing probability over the entire range of delays (Pearson correlation coefficient ρ = 0.11, p = 0.66), however firing probability correlated with instantaneous rate of change of membrane potential while the optical stimulus was active (Pearson correlation coefficient ρ = 0.94, p < 0.01). Multiple linear regression using Vm and  as the dependent variables yielded a strong correlation across the entire range of delays (Pearson correlation coefficient ρ = 0.91, p < 0.01;
  ).
).
The time constants for isolated subthreshold optical and electrical stimulation can be seen in figure 2(d), compared against suprathreshold stimulation. Onset dynamics were in a similar order of magnitude for subthreshold and suprathreshold responses, but repolarisation was significantly faster following APs compared to subthreshold depolarisation. For optical stimuli τon was not significantly different between subthreshold and suprathreshold responses (τon = 11.7 ± 1.6 ms for subthreshold, τon = 10.6 ± 0.4 ms for suprathreshold, two tailed t-test, p = 0.44). These relatively lengthy time constants were likely related to the slow depolarisation elicited by the 10 ms optical pulse. The off dynamics were significantly faster where an AP occurred (τoff = 24.0 ± 0.8 ms for subthreshold, τoff = 1.63 ± 0.03 ms for suprathreshold, p < 0.001).
For electrical only stimulation (3 ms pulses) the τon was significantly shorter for subthreshold responses (2.0 ± 0.2 ms) compared to suprathreshold responses (3.9 ± 0.1 ms, two-tailed t-test, p < 0.001). This surprising result was most likely related to the selected pulse parameters ensuring AP voltage threshold was only reached near the end of the 3 ms electrical pulse. The repolarisation of the cell was significantly faster for suprathreshold (1.36 ± 0.03 ms) compared to subthreshold (1.0 ± 0.3 ms, two-tailed t-test, p < 0.001).
The strong correlation between optical depolarisation and firing probability and the similarity in characteristics between E and O + E APs suggests that during optogenetic costimulation voltage-sensitive ion channels and the opsins combine in an 'additive' fashion to evoke costimulation APs. To examine whether this same additive mechanism would exist simply through electrically evoked membrane depolarisation, the response of cells to E + E costimulation was examined. Overlaid responses to E + E stimulation with increasing delay between the electrical trigger and ramp are shown in figure 3(a). Several characteristics are shared with the costimulation APs, including the presence of two peaks (one for the ramp and one for the 3 ms trigger pulse), as well as evoked APs once the cell membrane was sufficiently excited by the combined stimuli.
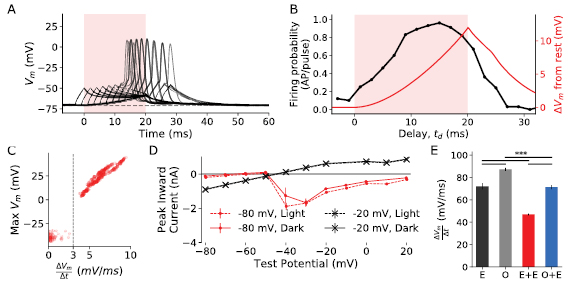
Figure 3. (a) Voltage traces from all-electrical (E + E) stimulation, with increasing temporal delay between the electrical ramp and the electrical trigger pulse. The shaded region indicates the duration of the electrical ramp. As with O + E stimulation, APs are more likely later in the electrical ramp. (b) The firing probability (APs per stimulus pulse) as a function of temporal delay for all electrical stimulation in black. As with O + E stimulation firing is more likely later in the electrical ramp. The averaged membrane potential change during the 20 ms electrical ramp only is overlaid in red. (c) Phase space plot of the peak amplitude of APs or subthreshold depolarisations against the rate of change of membrane potential in the 10 ms prior to the AP. Consistent with published results, the peak amplitude and firing probability is correlated with rate of change of membrane potential and a clear threshold value is evident near 3 mV ms−1. These results were obtained by tuning a current ramp of fixed duration until APs were generated, and then increasing the ramp time for the same peak current, resulting in a lower rate of change of membrane voltage until APs were abolished. (d) Comparison of the maximum evoked current in voltage clamp to 200 ms test pulses following 300 ms conditioning potentials (at −20 mV or −80 mV), with and without a 50 ms optical pulse just prior to the test pulse. There is no significant difference in amplitude (a proxy for Na+ inactivation) with the addition of a 50 ms optical during the conditioning pulse, immediately prior to the test pulse (n = 3 cells, error bars SEM). (e) Comparison of average membrane rate of change during the upstroke of APs as a measure of Na+ inactivation, compared between O + E (n = 7 cells), E (n = 11 cells), E + E (n = 7 cells) and O (n = 21 cells) stimulation. Significance from TukeyHSD, ***p ⩽ 0.001. Error bars are SEM.
Download figure:
Standard image High-resolution imageFigure 3(b) shows the firing probability for the all-electrical costimulation imitation, overlaid with the membrane potential change due to the 20 ms ramp. A comparison of the change in membrane potential following the optical pulse in O + E, and the electrical ramp in E + E costimulation is available in figure S5. Like optical stimulation, the peak firing probability was achieved after 10 ms and remained high throughout the duration of the ramp. Unlike optical stimulation, upon cessation of the electrical ramp stimulus the firing probability rapidly dropped in a manner inconsistent with the relatively slow repolarisation associated with subthreshold electrical stimulation (τoff = 10.0 ± 0.3 ms). The firing probability for all-electrical costimulation had a weak positive correlation with the membrane voltage (Pearson correlation coefficient ρ = 0.44, p = 0.051), however the correlation with the instantaneous rate of change of the membrane potential revealed a more positive correlation during the ramp (ρ = 0.55, p = 0.01). The correlation was stronger if only the period during the stimulus was considered, corresponding to  (ρ = 0.66, p = 0.02).
The relationship between  and firing probability is well known in the literature [27] and usually attributed to the increased Na+ inactivation during slower depolarisations [28, 29]. Here varying gradient current ramps revealed a similar dependency on
  for SGNs (see figure 3(c), n = 6 cells).
Costimulation APs have reduced Na+ inactivation compared to electrical-only APs
The difference in AP facilitation after the base stimulus for O + E (figure 2(c)) or E + E stimulation (figure 3(b)) indicates that the Na+ channels may activate or inactivate differently in response to optical and electrical stimuli. The degree of inactivation with and without optical stimulus was assessed using a two-pulse protocol similar to [30]. For −80 mV conditioning pulses, a transient inward current akin to INa was evoked for test pulses above −50 mV (figure 3(d)). For a conditioning pulse of −20 mV the transient currents were initially inwards but became predominantly outward after a test pulse of −20 mV or above. The inclusion of an optical stimulus at the end of the conditioning pulse did not significantly alter the inactivation curves (two sided Kolmogorov–Smirnov; at −80 mV, score = 0.22, p = 0.96, at −20 mV, score = 0.11, p = 1.0).
The average  during the upstroke of APs (measured from when
  exceeds the derivative threshold until the peak Vm) can also be used as a proxy measurement of Na+ inactivation [31]. O + E had significantly higher
  than E + E costimulation (O + E = 75.3 ± 1.8 mV ms−1, E + E = 46.9 ± 0.8 mV ms−1, two-tailed t-test p < 0.001, figure 3(e)), which may indicate greater Na+ inactivation during the electrical ramp compared to the optical depolarisation. The average derivative from O + E costimulation was like electrical only stimulation (two-tailed t-test, p = 0.33) and was lower than optical only stimulation (87.16 ± 1.38 mV ms−1, p < 0.001) consistent with reduced reliance on Na+ channels during optically evoked APs. These results indicate that optogenetic costimulation may be used to increase cell excitability through membrane depolarisation for extended periods of time without evidence of wide-scale Na+ inactivation.
Costimulation increases the firing rate in response to pulse trains
After the response of cells to single costimulation pulses was examined, pulse trains were presented at 10, 20, 33 and 50 Hz to examine the effectiveness of optogenetic costimulation to increase spike rate. A combination of subthreshold and suprathreshold optical and electrical stimuli were tested (varying between 0% and 140% of single pulse threshold power). The electrical stimulus was fixed at a 3 ms delay to optical stimulus, and the same pulse parameters were used as with single pulse protocols (10 ms optical and 3 ms electrical).
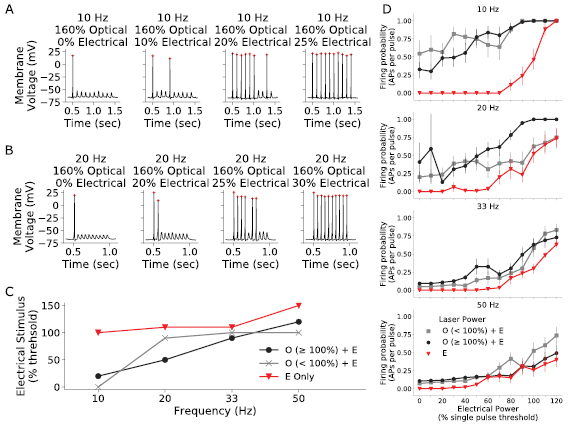
Typical cell responses to combined optical and electrical trains at 10 Hz and 20 Hz are shown in figures 4(a) and (b). In these examples, optical power was held constant while electrical power increased as shown in the panels from left to right. The number of APs fired increased as electrical power was increased, and responses were phase locked to the stimulus. There was evidence of adaption in subsequent pulses in the pulse trains. The adaption ratio (defined as the amplitude of the last spike in the train to the first) fell from near one at 10 Hz (0.94 ± 0.00, n = 10 cells), to 0.69 ± 0.01 at 50 Hz (n = 10 cells). Adaption was slightly larger but not significantly different at 50 Hz for costimulation (0.73 ± 0.02, n = 5 cells) compared to electrical only stimulation (0.77 ± 0.01, n = 5 cells, two-tailed t-test, p = 0.49).
Figure 4. An example of 10 (a) and 20 Hz (b) costimulation pulse trains. For this particular cell, the suprathreshold optical stimulus reliably evoked an AP on the first pulse, but not on subsequent pulses in the absence of electrical stimulus. As electrical power was increased (moving from left to right in each subfigure) with constant optical power, a greater number of APs were evoked across the pulse train. The peak amplitude of subsequent pulses at 20 Hz and above reduced as the frequency was increased. (c) The electrical stimulus level required to achieve a firing probability of 0.5 for electrical only (red triangles; optical off), subthreshold optical and electrical (grey crosses), and suprathreshold optical with electrical (black circles). The electrical stimulus level required increases with frequency for all stimulus modes. Subthreshold and suprathreshold optical costimulation exhibited similar electrical stimulus levels, and in both cases were generally reduced compared to electrical only stimulation (n = 12 cells). (d) Average firing probability for increasing electrical power, grouped by pulse frequency. Black lines indicate suprathreshold optical power, grey lines subthreshold optical power and red lines indicate the absence of optical stimuli. (n = 12 cells, error bars are SEM).
Download figure:
Standard image High-resolution image
The electrical stimulus level required to achieve a firing probability of 0.5 for different stimulus modes is shown in figure 4(c). When optical stimulation was present, the level of electrical stimulation required to reach 0.5 firing probability decreased. The outcome was observed at each frequency tested and indicates that the benefits of costimulation are maintained in pulse train conditions. Surprisingly, the electrical stimulus for subthreshold and suprathreshold optical costimulation was similar, which is likely related to the electrical pulse (3 ms delay) occurring before the maximum depolarisation from the optical pulse (τon ≈ 12 ms). A delayed presentation of electrical input (to coincide with peak depolarisation from optical stimulation) would be expected to reveal larger changes in threshold with increasing optical power.
Figure 4(d) compares firing probabilities for all frequencies tested, grouped by optical power level and electrical power level. The number of APs generated for a given optical power level increased with increasing electrical power. At all frequencies, costimulation (with either subthreshold and suprathreshold optical stimulus) led to a higher probability of firing compared to electrical-only stimulation (p < 0.05, Kolmogorov–Smirnov two sample test), while subthreshold and suprathreshold optical were not significantly different (p > 0.05). The firing probabilities of all modalities converged at frequencies close to the in vitro stimulation limit for this cell type [24].
For optical stimulation on its own, pulse trains at 10 Hz achieved a firing probability close to 0.5. With the costimulation technique, it was possible to drive pulse trains with 0.5 firing probability at up to 33 Hz, at least three times faster than using optical stimulation alone, while maintaining lower electrical currents compared to all electrical stimulation.
Discussion
Optogenetic stimulation techniques are of interest in implants which are susceptible to crosstalk between channels due to the spread of electrical activation in the tissue. Nonetheless, optical stimulation when used in isolation has larger power requirements [8] and slower temporal dynamics compared to electrical stimulation, thereby limiting its applicability to neuroprosthetics. For example, the pulse rates used in cochlear implants can range from 250 to more than 4000 pulses per second per electrode [4], which would render optical stimulation as a poor alternative to electrical stimulation from both a battery-life and speech intelligibility perspective. While significant progress has been made toward generating more temporally responsive channelrhodopsin mutants [17], we explored an application of optogenetic tools that might complement both established and next generation opsins.
This study has demonstrated that combining subthreshold optogenetic stimulation with subthreshold electrical stimulation can evoke APs in auditory neurons and increase pulse train firing probabilities compared to standalone optical stimulation. This approach can be used to enhance the performance and application of existing engineered opsins and optics-based probes without requiring significant reengineering of the opsin. In the cochlear implant, the costimulation technique might thereby provide a method by which we could realistically improve the spatial precision of intracochlear electrical stimulation, even when using opsins not designed with costimulation in mind.
Comparison to infrared neural stimulation
The costimulation technique was first examined in the setting of INS [23] and demonstrated the potential of combined optical and electrical input to offset the limitations of a single source of stimulation. However, because INS is thermally driven, the response depends on the rate of change of temperature in the tissues [32], and the relationship between required optical and electrical stimulus levels is logarithmic [23, 33]. Consequently, as the optical power drops below 70%, an exponentially increasing electrical power is required to reach costimulation threshold. In contrast, optogenetic stimulation is driven by direct changes in ionic conductance and allows APs to be evoked with relatively low optical and electrical power. This suggests a lower sensitivity to optical stimulus level using optogenetic costimulation, and hence this technique is likely to be more energy efficient compared to infrared costimulation and result in lower tissue heating.
This study utilises longer pulses with increased delays compared to Duke et al [23] and demonstrates longer periods of enhanced cell excitability following optical stimulus. Due to the slow channel kinetics of opsins, the peak current can often occur after the light source is turned off. Therefore, optogenetic costimulation confers the ability to control the degree and onset of enhanced excitability over longer periods with a smaller optical stimulus compared to INS. This capability could provide additional tools for adaptive control schemes in implantable devices, where the neuron excitability could be controlled by an optical stimulus while an electrical stimulus is used to trigger APs.
Relationship between costimulation firing probability and Na+ inactivation
We demonstrate here that the firing probability for costimulation stimuli was related to both the change in membrane potential and the instantaneous rate of change of membrane potential during the optical stimuli. This dual dependency is consistent with in vivo observations of a dynamic voltage threshold [27, 29, 34, 35] and is likely a result of synchronised activation and inactivation of Na+ channels. Typically, Na+ inactivation occurs more slowly than activation, and channels do not necessarily open prior to inactivating [36–38]. When depolarisation is sufficiently slow, inactivation can occur within the same time scale as activation [27, 30] and the pool of Na+ channels available to generate an AP is lower compared to after a fast depolarisation [28, 29].
Sodium channel dynamics during slow depolarisation are of interest for the O + E costimulation described in this study due to the long subthreshold optical depolarisation. The results in figure 2(a) established that O + E APs were most similar to electrical APs, and the extended period of depolarisation did not result in desensitization of the cell. Indeed, APs were generated up to 30 ms after the onset of optical stimulus.
This contrasts with the significantly higher inactivation measured with E + E stimulation. A possible explanation is that open- and closed-state inactivation processes are impacted in different ways by optical and electrical stimuli. For instance, open-state Na+ inactivation may be lower during optical depolarisation if fewer Na+ channels are activated compared with electrical depolarisation. An alternative hypothesis is that the slow-inactivating photocurrents overwhelm the reduction in Na+ currents due to inactivation. However, as ChR2 currents are significantly reduced at more positive membrane potentials, this effect would be strongly voltage dependent [39]. Whatever the underlying cause, this behaviour demonstrates a key benefit of costimulation (O + E) APs; namely that optically evoked changes in membrane potential appear to prime the neuron more efficiently than a similar electrical depolarisation.
Applicability to other opsins
The ChR2/H134 opsin considered here is a high photocurrent variant with low irradiance thresholds [40–42]. Optically evoked APs in vitro have been driven at frequencies from 5 Hz [43] to 100 Hz [44] at a variety of power levels, while in vivo firing rates of up to 70 Hz have been reported [1]. While the ChR2/H134 opsin reduces the irradiance level required for stimulation, and hence may reduce power consumption in implantable devices, the off time constant (τoff ≈ 18 ms) limits the maximum firing rate. Therefore, in this study the optical stimulus was used as an adjunct to electrical stimulus, with the role of 'priming' the neuron into an excitable state where lower intensity electrical stimuli could be applied to evoke APs.
There are many different opsins now available that could be combined with electrical stimulation in different ways. For instance, recent research efforts into engineered opsins such as f-Chrimson [17] or Chronos [16, 45] have focused on decreasing τon and τoff to allow neurons to be optically driven at higher spike frequency. These types of opsins could be used to trigger APs in high frequency trains, with electrical stimulus used to prime the neurons.
As the optogenetic costimulation approach described here is unlikely to be linked to specific opsins, the ability to drive faster spikes with optogenetic costimulation may allow researchers to enhance the firing rates of existing fast opsins, or to focus on aspects such as enhanced biocompatibility above pure opening and closing dynamics when designing future opsin variants.
Optical irradiance and power consumption
Typical energy requirements for achieving APs in the cochlear using optogenetic stimulation (2 µJ mm−2) are ten times higher than for electrical stimulation (0.2 µJ mm−2) [1, 8, 46]. Efficiency of optical delivery devices is typically 10%–30% [47–49], suggesting that optical neural interfaces may require several orders of magnitude more power than electrical devices. Therefore shifting the burden of activation from optical to electrical excitation would likely reduce the power required to evoke APs.
In addition to reducing power requirements, the costimulation technique also reduces the blue light exposure of tissues. Blue light toxicity is an emerging concern; while several studies have shown viral delivery of optogenetic ion channels to be safe over months [50, 51], other studies have shown a link between blue light exposure and neuronal death in vitro [14] or in the retina [15]. In both studies, increased blue light toxicity was associated with higher power levels, and so reducing the radiant exposure or allowing faster control of red-shifted opsins may reduce the potential for damage.
Translation to implantable devices
This study focused on in vitro characterisation of the response of auditory neurons to combined optical and electrical stimulation. This in vitro investigation of the optogenetic costimulation effect can help to guide future in vivo experiments. Furthermore, by gaining an insight into the underlying ion channel dynamics for single cells, it may be possible to derive new techniques and approaches that can be applied in vivo.
The costimulation technique could potentially provide benefits for implantable devices by working around the limitations of existing standalone optical and electrical stimulation modes. One expected benefit of optogenetic costimulation is improved spatial precision compared to electrical stimulation. Validating this behaviour is beyond the scope of this electrophysiology study, however optogenetic stimulation has previously demonstrated to have near-physiological spatial precision in the auditory system [1, 2]. The spread of activation following costimulation is likely to be dominated by the electrical stimulus, where injected current is the key parameter in the volume of activation [52]. As costimulation allows APs to be evoked with reduced electrical current, this suggests that costimulation may have reduced spread of activation compared to electrical stimulation on its own. This may be particularly beneficial in spike trains, where for instance with costimulation it was possible to achieve firing probabilities approaching 100% for 10 and 20 Hz pulse trains using electrical stimulus at about a quarter of the single pulse AP threshold. Coupled with fast opsins, this could allow neurons to be driven at high frequency with a fraction of the electrical stimulus, thus reducing the spread of activation. This hypothesis requires further testing in subsequent in vitro or in vivo experiments.
Alongside the potential spatial precision of the costimulation technique, there are several other considerations that impact on the ability to translate the technique into implanted neuroprosthetics. For instance, engineering a device capable of delivering spatially precise optical and electrical stimulus may require new approaches to device development [53]. Translation to in vivo devices will require reassessment of the stimulus parameters, such as the duration and intensity of the different stimuli. The parameters may also need to be tuned for specific applications, for instance the slow optical depolarisation and delayed electrical trigger pulse may introduce a latency to first spike of a few milliseconds that may not be acceptable in some applications. Finally, as the key benefits are achieved following subthreshold stimuli, this implies that some sort of closed-loop control may be required in vivo to ensure that the initial stimulus does not evoke APs.
Outlook
The technique described here allows the benefits of both electrical and optical stimulation to be retained in implantable devices, as well as avoiding some of the challenges associated with optogenetic stimulation alone. Providing additional tools and techniques that complement the advances being made in opsin design is likely to improve the quality of future implantable devices enabled by optogenetics.
Acknowledgments
This work is supported by Action on Hearing Loss International project grant G89 and the ARC Training Centre in Biodevices (IC140100023). William Hart is supported by an Australian Government Research Training Program (RTP) Scholarship. The COP4*H134R/EYFP mouse line was generously provided by Professor Heather Young of the University of Melbourne, Australia and the Cre-parvalbumin mice were kindly provided by Prof Steven Petrou of the Florey Institute of Neuroscience, Australia. The Bionics Institute acknowledges the support it receives from the Victorian Government through its Operational Infrastructure Support Program.
WH, RR, AT, AW, JF, PS, KN disclose a potential financial conflict of interest related to a patent application.