


Abstract
One of the physiological responses of bacteria to external stress is to assemble into a biofilm. The formation of a biofilm greatly increases a bacterial population's resistance to a hostile environment by shielding cells, for example, from antibiotics. In this paper, we describe the conditions necessary for the emergence of biofilms in natural environments and relate them to the emergence of biofilm formation inside microfluidic devices. We show that competing species of Escherichia coli bacteria form biofilms to spatially segregate themselves in response to starvation stress, and use in situ methods to characterize the physical properties of the biofilms. Finally, we develop a microfluidic platform to study the inter-species interactions and show how biofilm-mediated genetic interactions can improve a species' resistance to external stress.
Export citation and abstract BibTeX RIS

Content from this work may be used under the terms of the Creative Commons Attribution 3.0 licence. Any further distribution of this work must maintain attribution to the author(s) and the title of the work, journal citation and DOI.
1. Introduction
A natural response of many species of bacteria to increasing levels of stress is the formation of biofilms, in which cells assemble together and produce large amounts of a polysaccharide-based exopolymer matrix [1]. The biofilm developmental program usually starts with the collective production by the cells of this dense, chemically inert exopolymer matrix as a response to external stress (pH, osmolarity, starvation, shear) [2]. Biofilm formation is beneficial to the cell population as a whole, since it allows cells to survive within highly stressful environments that would prevent the survival of free-swimming cells [2]. In fact, it has been proposed that since gene expression varies tremendously between planktonic cells and sessile cells in biofilms, they may even be seen as two different types of differentiated cells within a multicellular organism [3]. We will discuss this idea at the end of this paper. Figure 1 gives a very schematic picture of the typical conception of a biofilm, although we will soon define a biofilm more generally as an aggregate of bacteria which may or may not be fixed to a surface.
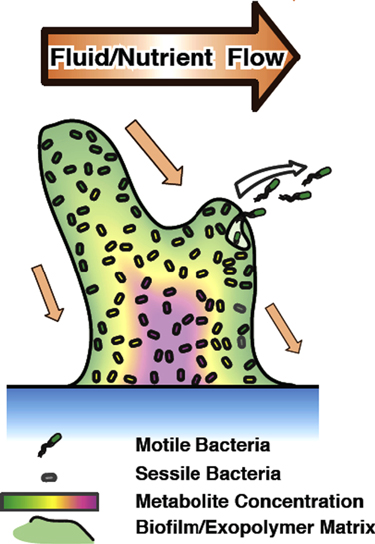
Figure 1. Physiological representation of a biofilm. As a response to external stress (starvation, pH, osmolarity), cells secrete an exopolymer matrix that links cells together to form a multicellular entity called a biofilm.
Download figure:
Standard image High-resolution imageSince the diffusion of metabolites and chemicals is greatly limited inside the matrix [4], the microenvironment created by a biofilm is highly heterogeneous and physiologically stressful [5]. It is, however, accompanied by a high level of specialization within the bacterial community. For example, subpopulations of bacteria inside a biofilm, each a few hundred microns apart, may become specialized to grow aerobically, process nutrients through fermentative pathways, digest the hydrogen sulfide produced by other cells, or resist the high shear forces near the biofilm edge [5, 6].
In humans with bacterial infections, antibiotic treatment is often ineffective because the limited diffusivity inside a biofilm decreases the actual dose that reaches the bacteria. This is why biofilms are a recognized source of recurrent and persistent bacterial infections [7, 8]. As bacteria assemble together, cell death and lysis contribute to the formation of cavities inside the biofilm [9]. The presence of such cavities in biofilms allows cells to regain a planktonic state and move to a different habitat [10], not unlike a metastatic expansion from a primary human tumor.
In addition to the surface-adherent biofilms, bacteria also form aggregated communities in suspension, which is the main subject of this article. By collision and separation, these communities combine and recombine in a process called flocculation, and are ubiquitous from the laboratory to the ocean [11]. These flocs are properly perceived as suspended pieces of biofilm. Similarly to surface-adherent biofilms, the metabolic and biomechanical properties of flocs differ greatly from those of planktonic bacteria.
Although biofilms are typically viewed in a pejorative way, they can also be extremely beneficial. The ability of microbial communities (predominantly saprotrophic bacteria) to clean wastewater was originally discovered by Arden and Lockett in 1913 [12] in Manchester, UK. Primary sewage (domestic and/or industrial) was combined with flocculating micro-organisms and aerated with the resulting mixture, reducing the organic content of the sewage. The process was called activated sludge, in the mistaken belief that the sewage sludge had been activated, similar to the process used to create activated charcoal 6 . The first large-scale activated sludge plant was constructed in Sheffield, UK, in 1920, with widespread adoption occurring over several years in municipalities around the globe. For more thorough and practical descriptions of the relationship between flocculating and biofilm-forming bacterial communities and water and wastewater treatment, we direct the interested reader to [13, 14].
Thus, biofilms are extremely important in many ways. In this article we want to examine a more general phenomenon that can occur in almost any bacterial strain, including the ubiquitous (in microbiology labs) strain of bacteria known as Escherichia coli. We seek to demonstrate the generality of the initial clustering phenomena that ultimately leads to biofilm formation, as well as the physical properties, and discuss the evolutionary (fitness) attributes that can arise when a biofilm forms. We will discuss how microfabricated structures can be used to study the formative dynamics of biofilms, and present some of the mysteries that arise from these devices that we still do not understand.
2. Chemotaxis and bacterial communication
It has been shown in a beautiful set of experiments with large colonies of bacteria growing on agar plates that bacteria can interact with each other to form complex macroscopic patterns [15, 16]. In fact, other work has demonstrated [17, 18] that many bacteria do interact with each other via chemical signaling when clustered together—a process called quorum sensing, driven by a set of genes that has been well studied [19]. While there need not necessarily be a direct signaling process between bacteria to induce efficient aggregation, recent work has shown that bacteria actually signal each other in the initial stages of biofilm aggregation [20–22].
To show that cell–cell communication is requited to induce cell aggregation and biofilm formation, we first study the simplest equation that governs the physics of chemoattraction in the absence of quorum sensing, which can be written in terms of the local densities of the bacteria  and the local food density
  as
as
where  is the effective diffusion coefficient of the bacteria at a coarse-grained level,
  is the diffusion coefficient of nutrients,
  is the chemoattractive sensitivity and C is the consumption rate of the food by the bacteria. In the absence of consumption or chemotaxis, the bacteria simply diffuse with time, becoming ever more dilute. In the presence of food, the bacteria follow food gradients. Here we make the highly simplified assumption that the coefficient of chemoattraction
  is a constant. In addition, we assume that the food itself diffuses and is irreversibly consumed by the bacteria.
These sets of equations have many different time-dependent solutions, which depend on the initial conditions of the problem. The solutions do, however, have one defining characteristic: they ultimately drive the bacteria toward dispersal, not aggregation. This can be seen simply by noting in equation (1) that the net sign of the change in the bacterial density with time due to food consumption is negative: as the food is consumed, the bacteria will clearly move to regions of lower, not higher, bacterial density, to find regions where there is more unconsumed food.
This explanation should make sense, however, bacteria don't necessarily disperse in this way. Our previous results reported in [23] show that in an environment that is not boundary free, but instead consists of many boundaries (i.e. a maze), E. coli bacteria can behave in the opposite manner: they concentrate with time, and do not disperse, which would seem to be a counterproductive behavior. In this paper, we explore this seemingly 'illogical' (i.e. evolutionary unfit) behavior of E. coli bacteria.
The simplified set of differential equations of equation (1) fails to describe the phenomena of cell aggregation seen when E. coli are inoculated in an environment that is bounded with a fixed amount of food [15, 16]. The convergence of the bacteria indicates that something very important is missing in this set of equations, namely the presence of a signaling molecule between the bacteria that drives aggregation. Keller and Segel derived a set of differential equations [24] that included a chemoattractant molecule that brings the bacteria together, as opposed to the dispersal effect of pure chemotaxis in the presence of an external food source, which is not observed in real bacterial colonies.
Cell–cell communication through a signaling field  determines chemotaxis-based bacterial movement [23] within each micro-habitat patch (MHP). Keller–Segel's flux [25], which accounts for the diffusion
  (with strength D) and the mutual chemotaxis
  (with strength χ),

is usually used to describe the spatial dynamics  of bacterial densities
  as a function of local growth
  and chemotactic spatial coupling
  . At the local scale, the balance between dispersive forces
  and chemotaxis-based aggregation
  is critically dependent on density [26].
Let us now assume that the food used by the bacteria for metabolism has fallen to such a low level that what remains at concentration f is being used to create a chemoattractant molecule of concentration c, which is used to signal to the other bacteria about the forthcoming food crisis. The Keller–Segel equations for this situation are:


where γ is the rate at which the bacteria consume the food, β is the rate at which the signaling molecule is produced by the food, κ is the chemotactic sensitivity and α is the net growth rate. We can safely set α equal to zero here because the bacteria are presumed to be at a stationary state due to the paucity of food.
In this case, the effect of the attractant molecule is to act between the microorganisms and is generated by the (dwindling) food supply. Two effective 'forces' are at work: the dispersive effects of diffusion (i.e. motility) and the attractive (or repulsive) response to the generated signaling gradient. We will assume here that the sign of this latter force is attractive for the formation of a biofilm.
We discussed in the introduction the unusual response of bacteria in a maze as the internal medium is depleted; the bacteria cluster together into confined pockets of the maze rather than dispersing themselves, as one would perhaps expect, in an attempt to seek out the dwindling resources. This unusual effect of not following the food gradient can be brought out even more starkly by microfabrication of a simple 'castle keep', consisting of a small square with a small opening in it, as shown in [26]. In a normal chemotaxis experiment, bacteria might initially enter this square, following initially higher food gradients, but would then leave the square as this resource is exhausted. Exactly the opposite happens here: the bacteria crowd very densely into the keep, resulting in extraordinarily high occupation densities. Such a fundamental instability of the bacterial population can be seen in the Keller–Segel equations by a perturbative analysis. The simplest analysis is done by setting all the time derivatives to zero in equations (3)–(5) and setting the food concentration to some constant value of  , to see if there are any interesting spatial stationary states. A simple analysis reveals that the population can sustain one-dimensional (1D) aggregates with a spatial shape given by:

where L is a localization length given by:

A further instability can be discovered by analyzing how the flux of bacteria, as given by equation (2), changes with the perturbations of bacterial density  in equations (3)–(4). Below a critical concentration, perturbations lead to decreasing numbers of bacteria with time, due to diffusion. Above a critical concentration, perturbations lead to a collapse of the bacterial population to very high densities. The value of the critical concentration
  can be found by setting the net flux change equal to zero in the Keller–Segel equations:


where S is the area through which the bacteria move,  is the enclosed volume, and
  and
and  are characteristic lengths in the evaluation of the gradients. Equations (8) and (9) then yield:

Thus, in this section, we have shown how the Keller–Segel model of bacterial self-interactions via a signaling molecule can give rise to a fundamental instability in bacterial populations to crowd into small volumes, which is presumably the initial stage in the formation of biofilms. Of course, we have not answered the deeper question of why the bacteria would gain fitness from such a seemingly counter-productive phenotype.
3. Non-adherent biofilm formation in micro-habitat arrays
The 'castle keep' experiment [26] showed the fundamental clustering instability of bacterial populations, but did not demonstrate the formation of biofilms. The traditional way to study biofilm formation in vitro is through the use of a flow cell, a device used to culture bacteria, in which a constant flow of nutrients induces biofilm formation through shear stress alone. The developmental program followed by various bacterial species inside flow cells has been studied in detail over the years, and has been very well described [27].
Biofilms, however, are present in a wide variety of natural environments, many of which are not necessarily constantly flushed with a fluid flow of fresh nutrients. Because biofilms often form as a response to environmental stress, we believe that the sole use of flow cells to study biofilms fails to consider the more complex collective behaviors that are expressed by cells in response to stress. In this section, we use an MHP system to recreate the environmental conditions that occur in nature, and employ these conditions to induce biofilm formation in E. coli populations.
A micro-habitat array is a simple quasi-1D environment that generates a spatial fitness landscape to probe the collective dynamics of cells in response to stress. A general schematic of a micro-habitat array is shown in figure 2. The nanoslits, which connect the MHPs to the nutrient reservoirs on either side, greatly restrict the amount of nutrients that can diffuse (not advect) into the MHPs. These nanoslits need not be present for every MHP and can be placed as a function of position within the array: some individual MHPs, for example, may have a full complement of nanoslits, while others may not have any. MHPs are connected to each other via narrow 5 μm wide channels, so cells can move between MHPs of varying food availability. As the MHPs are not being exposed to any other regulated environment, an MHP array is most decidedly not a chemostat, in which excess cells can flow out of the device.
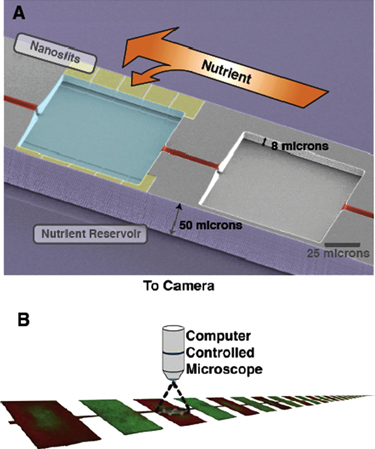
Figure 2. The micro-habitat patch device. (a) We physically recreate a metapopulation landscape using microfabrication. A computer-controlled microscope records the fluorescence intensity in each chamber every 15 min.
Download figure:
Standard image High-resolution imageFortunately, E. coli bacteria seem to spontaneously form non-adherent biofilms inside MHPs as the cell density increases. In fact, regardless of the fitness landscape used in our construction of the linear array of microhabitats, we almost always observe biofilm formation inside most MHPs. A few hours after inoculation, we typically observe cell aggregates which, despite constant jostling by the surrounding swimming cells, maintain their shape and structure. The fact that cells are sessile within each aggregate but are still able to resist external pressures suggests that cohesive forces keep cells bound together. Figure 3 shows a few examples of biofilms that are present inside MHPs for both single species (a)–(c) and competition (d)–(f) experiments. We will discuss these different kinds of experiments in section 4. To guide the eye, we have added a white outline around the well-defined biofilms, which we could make out as a result of their collective motion.
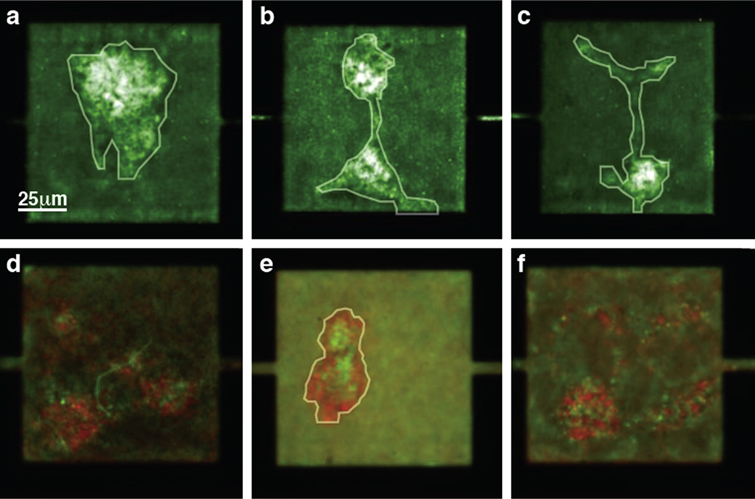
Figure 3. E. coli biofilms inside micro-habitat patches (MHPs). As the density of cells increases inside an MHP, large collections of swimming cells become sessile and assemble into a biofilm. A few representative examples of a wild-type E. coli (a)–(c) and wild-type (green) and GASP (red) cells (d)–(f) inside biofilms observed inside MHPs are shown here. To guide the eye, the outline of well-defined biofilms is highlighted in white. Note that in (a)–(c), the fluorescent signal is displayed using a black–green–white lookup table, while the fluorescence signals in (d)–(f) are shown using a black–green and black–red lookup table for the wild-type and GASP cells, respectively.
Download figure:
Standard image High-resolution imageNote that the morphology of each biofilm is very irregular, meaning that biofilm growth is probably not occurring isotropically. In addition, the shape of different biofilms grown under the same experimental conditions varies tremendously, with structures ranging from simple microcolonies to multiple colonies linked to one another by dendrite-like protrusions. Several studies have used 3D reconstructions from confocal imaging to quantify the physical parameters of biofilms, such as the surface-to-volume ratios and, perhaps out of mathematical hubris, fractal dimensionality [28, 29].
The type of biological (as opposed to physical) stress that is pushing cells to assemble together and form biofilms inside MHPs remains unknown; we have not yet developed a reliable way to monitor the gene expression of the metabolic state of these bacteria in situ. Future experiments could improve upon this weakness of these experiments by extracting cells from the MHPs for gene expression analysis or, alternatively, using fluorescent reporters tied to the expression of known stress response genes to directly monitor their levels of expression. A few clues, however, seem to indicate that an increased cell density plays an important role in biofilm genesis.
Figure 4 shows the development of a single-species biofilm inside an MHP. First, cells form small aggregates inside the MHPs. Then, as the density of the cell increases, the biofilm aggregates assemble together and progressively expand to occupy most of the space available. The propensity of wild-type cells to form biofilms strongly depends on the nutrient levels; we observe that in an alternating nutrient landscape, biofilms mainly form in the nutrient rich (NR) regions [30]. Since starvation occurs in NP regions first, this seems to indicate that biofilm formation is not tied to a lack of nutrients but to the increase in cell density.
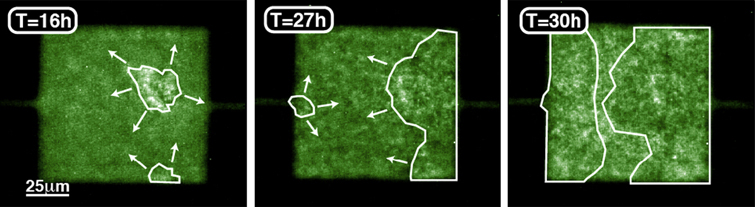
Figure 4. (a) In response to increasing cell densities, cells first form isolated biofilm seeds, (b) which then come together to form a larger biofilm. (c) As cells pursue their growth, the biofilm expands to fill most of the space available inside the MHP.
Download figure:
Standard image High-resolution imageObviously, there is a collective nature to these biofilms' development. This collective nature makes sense in light of what we discussed above when we considered the Keller–Segel equations (equations (3)–(5)), namely that bacterial behaviors are directly related to cell densities and cell–cell communication. We should also associate this collective nature with the phenomena of quorum sensing—a process through which certain genes or behaviors are only expressed in response to a sufficiently high cell density [31]. In fact, E. coli has the ability to form biofilms in response not only to stress [32, 33], but also to an increase in cell density alone through quorum sensing [34], although we suspect the two phenomena are highly inter-related.
In the case of mutant cells displaying a growth advantage in the stationary phase (GASP) phenotype, we expect their development to be different from that of wild-type cells. GASP mutants are adapted to grow in stressful environments and can diversify their nutrient sources to reach a final density inside MHPs that is higher than that of wild-type cells. The development of the biofilm remains fairly similar to that of wild-type cells and, as such, we do not deem it necessary to illustrate it. A major difference, however, is that biofilms comprised of GASP mutants reach much higher densities that those comprised of wild-type cells [30]; indeed, while wild-type cells form biofilms in less than 30% of the NP MHPs, GASP cells appear to form biofilms in 100% of these NP MHPs. This observation, considered in light of the fact that GASP mutants maintain a proliferative phenotype despite deteriorating growth conditions, is consistent with our proposition that biofilm formation is a direct consequence of high cell densities.
4. Biofilm development under competition
Previous studies have shown that under prolonged growth in the absence of agitation, GASP and wild-type strains of E. coli are both able to form biofilms [35]. Given what we have shown in the previous section, that biofilm development for E. coli is highly dependent on the planktonic cell density, one might therefore expect that the more complex redistribution of cells found during competition experiments, especially those observed in rapidly alternating fitness landscapes, would translate into more complex biofilm developmental dynamics. In particular, the relative fraction of each cell type in the NR and NP MHPs may translate into very different accretion dynamics in each habitat. In order to study these accretion dynamics, we analyze biofilm development on the microscopic scale—i.e. in single MHPs.
The steps involved in the biofilm's developmental progression in our device [30] are shown in figure 5(a)–(d). In order to delineate different phenotypes of the cells, we use wild-type cells that express green fluorescent proteins (GFP-WT) and GASP mutants that express red fluorescent proteins (RFP-GASP). As a function of time after inoculation of the MHPs, first, small aggregates of GFP-WT cells form inside the NR regions and assemble together ( ). RFP-GASP cells then join the wild-type aggregate and expand around it (
 ). RFP-GASP cells near the edge of the biofilm proliferate to fill most of the NR habitat (
 ), which in turn gradually limits the space available for free-swimming bacteria in the NR MHPs. As a result, RFP-GASP cells in the biofilm progressively become the dominant strain in the NR regions.
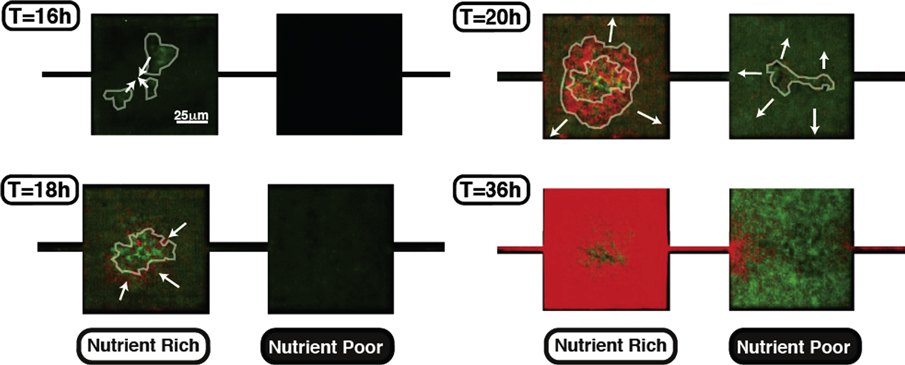
Figure 5. Biofilm development under competition. Since GASP cells fail to enter a stationary phase, (a) after the biofilm seeds form and (b) assemble together, they readily (c) outcompete the wild-type cells and contribute to most of the biofilm growth. (d) As growth occurs in the NR MHP, high cell density quenches the population distribution.
Download figure:
Standard image High-resolution imageGFP-WT cells, on the other hand, are still in a planktonic state in the NR regions. As the biofilm expands, the space available in the NR regions decreases and GFP-WT cells diffusively migrate into the NP regions. The increasing GFP-WT cell density in the NP regions also favors the formation of small cell aggregates (T = 20 h), which eventually fill all the space available in the NP MHPs, as swimming cells continue to migrate into them. After T = 36 h, there is no 'free' space available in either type of habitat, as most MHPs are packed with biofilms. The population distribution is thereby locked and no more inter-MHP cell exchange is possible, leaving a large frequency of RFP-GASP cells in the NR MHPs and GFP-WT cells in the NP MHPs.
5. Physical properties of non-adherent biofilms
The phenomenological description of a biofilm's development, although illustrative, remains mainly qualitative. As shown above, cells growing on their own or under competition conditions have slightly different developmental programs. The presence of two species with different growth phenotypes influences the overall spatial distribution, and cellular segregation by phenotype occurs locally. In fact, similar spatial arrangements have been demonstrated in dental biofilms (commonly known as dental plaque); cells from totally different species, most of them unculturable outside of a dental plaque environment, spatially distribute themselves into highly organized layers [36].
In this section, we use more quantitative tools to describe the physical properties of the biofilm aggregates we observe inside our MHP devices. For the sake of simplicity, we only study the emergent physical properties of wild-type biofilms. In particular, we study the overall motion of biofilm aggregates inside a densely populated bath of swimming cells. We then describe how the constant external pressure exterted by the planktonic cell population deforms these biofilms, and we link these deformations with density variations of the bacterial quasi-fluid. As the biofilm increases in size, we show that cells gradually embed themselves into the ever-growing biofilm.
Before diving into the results and the detailed analysis performed for this section, we first digress to describe the technique used to extract the physical properties of the studied biofilms. As shown in figure 3, biofilms inside MHPs are heterogeneous and display a wide variety of different structures. Furthermore, the inherently high density of cells reached inside biofilms, coupled with the limited numerical aperture of our microscopy setup, renders the localization of single cells challenging.
The localization and tracking of single cells at low densities, however, is relatively simple. We therefore combine low-density tracking to high-density biofilm monitoring by seeding MHP devices with RFP- and GFP-producing wild-type cells (GFP-WT and RFP-WT, respectively) at relative initial densities of 1–100. As a result, we can track the qualitative biofilm development by monitoring the GFP fluorescence of an MHP, and we can extract the localization of single cells inside a biofilm by recording the RFP fluorescence. Figure 6 shows a composite micrograph of a GFP-WT biofilm, of which 1% of the cells are RFP-WT: in this particular example, four RFP-WT cells are embedded in a GFP-WT biofilm aggregate. We can extract the position of each embedded RFP-WT cell and then use their position to extract the overall biofilm motion and the amount of strain the aggregate is subjected to.

Figure 6. Cells embedded into biofilms. We visualize the microstructure of biofilm aggregates by inoculating our device with 1% RFP-producing cells. As cells randomly embed themselves into biofilm structures, we use these RFP-producing cells to extract the microscopic properties of the biofilms.
Download figure:
Standard image High-resolution imageThe physical properties of these non-adherent biofilms are interesting: their deformation can be measured as a function of time, as they are subjected to physical forces due to the external impulses supplied by collisions with surrounding planktonic cells. Biofilms are usually cultured on glass slides under a constant fluid flow, and their elastic properties can thus be thoroughly studied by modulating the flow rate and studying their deformation [37]. Results seem to indicate that biofilms behave as viscoelastic fluids under these conditions, and that they typically have relatively long relaxation times of approximately 18 min [38] in response to mechanical stress. Here, we want to test whether the same physics also occurs for biofilms inside MHPs, despite different growth conditions. In particular, biofilms in MHPs are grown without shear stress and, in addition, form at length scales somewhat smaller than those usually observed in flow chambers: about 50–75 μm in linear length inside MHPs, as compared with 150–200 μm.
We may associate the random collisions between swimming cells and the biofilm with random collisions between water molecules and a sphere. A caveat here is that the temperature does not affect the motion of cells the same way that it affects the motion of water molecules; since temperature provides kinetic energy to a molecule, the analog of the 'temperature' of a bacterial bath is related to the swimming velocity of each cell. Luckily, E. coli swimming velocity remains constant over a wide range of environmental conditions at about  [39].
[39].
Experiments with small 'inactive' objects—for example, polystyrene beads less than 10 μm in diameter—show that diffusion inside a bacterial bath is very similar to Brownian motion [40]. Associating an effective temperature T to the diffusion constant D for beads of radius r inside a bacterial bath with fluid viscosity η, we use the Stokes–Einstein relation:

This leads to an effective temperature ' ' which is 100 times higher than room temperature. We will refer to the effective temperature as
  and will use this important result to compute the Young's modulus and rigidity modulus of biofilm aggregates.
The random collisions of swimming bacteria surrounding the biofilms thus act as a bath that applies force to the biofilms. In fact, these forces induce significant strain on the biofilm, which we will quantify in light of the random density fluctuations inside the surrounding bacterial bath. To measure the strain of a biofilm, we use datasets in which five to seven red fluorescent protein-expressing wild-type cells (RFP-WT) are embedded, purely by chance, into a single biofilm aggregate, as shown in figure 7. Having more than three embedded cells greatly increases the amount of information that can be extracted, because the biofilm deformation can be determined at a higher precision.
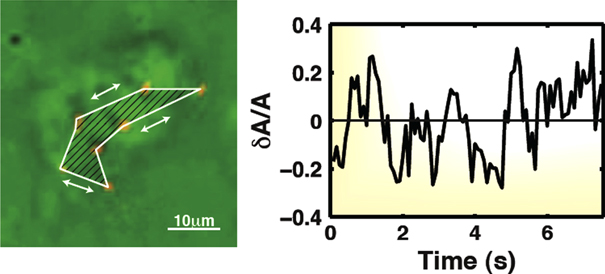
Figure 7. Strain inside a biofilm. In this example, the area enclosed by seven embedded RFP-WT cells is monitored over time. The temporal variations in the area defined by these cells varies by 15% (rms measurements).
Download figure:
Standard image High-resolution imageWe first plot the relative change in the total area delimited by the embedded RFP-WT cells inside the biofilm aggregate, seen as the enclosed region in figure 7. A computed algorithm generates the outline of the area enclosed by the cells and we monitor the root–mean squared variations over time to find that, surprisingly, the variations in the total area are approximately 15% (rms measurement), but can have peaks as large as 20%—which is substantial considering that they are mainly due to in situ pressure variations caused by swimming cells. Considered in terms of the viscoelastic properties of a biofilm, these results would suggest that the biofilm's bulk modulus B:

is quite small relative to many other materials, where v is the volume of the aggregate and p is the external pressure on the aggregate.
We estimate the magnitude of the bulk modulus from simple thermodynamic arguments. In an MHP, variations in biofilm volume result from fluctuations in the effective external pressure exerted on the biofilm aggregate by the surrounding motile bacteria. Since external collisions with swimming cells, not flow perturbations caused by swimming cells, are the main contributor of pressure against the biofilms [41], we associate these pressure fluctuations with local fluctuations in the number of cells in the bacterial bath. Simha and Ramaswamy have shown that the relative number variation  in a suspension of self-propelled particles scales as
  [42]. Accordingly, relative differences in pressure also scale as
  , assuming that an 'ideal gas'-like expression such as
  holds for bacterial baths, which is a reasonable approximation considering the fact that Wu et al demonstrated that the velocity distribution of bacteria at high densities is similar to that of an ideal gas [40].
In particular, assuming that the observed changes in volume of the biofilm are negligible as compared with the MHP volume, we can use the estimated density of motile bacteria and the expression for pressure fluctuations  given by
  for a cell density ρ inside the MHPs. From our previous estimate that the cell density is approximately
  cells per MHP [43], we obtain a pressure variation
  Pa.
Pa.
To estimate the bulk modulus of the biofilm, we discretize B as  and use the biofilm's root–mean squared volume variation, measured in figure 7, of 15% to find that
  Pa. This derivation is not meant to be taken as an absolute determination of the bulk modulus of a biofilm aggregate, but rather as a back-of-the-envelope estimate. This value is not, however, too far from the values observed in flow chamber work, which range from 17 to 300 Pa [37]. We compare this Young's modulus with other biological materials in table 1. Our approximation of the Young's modulus of a biofilm is in good agreement with other reported values [37, 44].
Table 1. The modulus of elasticity in pascals (Pa) associated with different biological structures.
| Material | Modulus (Pa) |
|---|---|
| Biofilm (volume fluctuations, here) | 600 |
| Biofilm (flow chambers [37]) | 17–240 |
| Biofilm (point of failure measurements [44]) | 6500 |
| Brain tissue [45] |

|
| Muscle tissue [46] |

|
| Bone [47] |

|
| Tooth enamel [48] |

|
6. Biofilms as clonal communities
Biofilms generally grow on surfaces and, following a period of attachment, cells within the biofilm form microcolonies that protrude away from the attachment plane. The microcolonies grow away from surfaces to distance themselves from competing cells and gain better access to nutrients in a manner analogous to tree growth in a forest: as plants compete for the same resource (light), the only way to outcompete their neighbors is to grow higher and wider. As a result, the structure of biofilms is inherently three-dimensional. The biofilm representations and analyses presented up until now have failed to emphasize this point.
Confocal imaging is a microscopy technique that achieves spatial resolutions and contrast levels much higher than are possible with regular epifluorescence microscopy. By rejecting most of the out-of-plane light using a pinhole in the conjugate plane of the detector, it is possible to reconstruct 3D volumes by recording planar sections of a material. Ever since the first 3D reconstruction of a biofilm using confocal imaging was published in 1991 [49], confocal imaging has been widely used as a non-destructive tool to study the microscopic properties of biofilms in situ. In this section, we use scanning laser confocal microscopy to study the developmental dynamics and the collective behaviors of E. coli bacteria inside MHPs.
We aim to determine whether we can extract the developmental dynamics of biofilm formation from a 3D reconstruction made using confocal imaging. In particular, we inoculate an MHP device with a 1:1 ratio of GFP-WT and RFP-WT cells, and culture them for 24 hours to allow for sufficient growth and biofilm formation. The fact that cells of each phenotype are present in a 1:1 ratio helps to better capture large-scale structures within the biofilm, as compared with the 1% inoculation experiments. We first record and construct a 3D representation of a biofilm, as shown in figure 8, and compare the structures produced by the cells in the two different color channels. Using this representation, we can locate range expansions of individual genotypes simply by observing whether or not large monochromatic domains are present in the biofilm.

Figure 8. Three-dimensional reconstruction of a biofilm. The 3D structural information of a biofilm can be extracted from confocal imaging of two wild-type populations (GFP-WT and RFP-WT) growing inside an MHP.
Download figure:
Standard image High-resolution imageThe structure of the biofilm shown in figure 8 is extremely rugged, although there are domains of predominantly green (or red) cells, as indicated by the arrows in figure 8. Furthermore, many of these domains are connected; a large fraction of the cells inside the biofilm are actually part of the 'same' biofilm formation. These domains are only 5–10 μm wide and their presence suggests that clonal growth (i.e. growth from a single founder population) is occurring within this particular biofilm.
The situation presented here is similar to the one presented in work done by Hallatschek et al, in which they study genetic drift and gene segregation in growing colonies of bacteria [50]. They showed that in the absence of genetic selection, a gene may still fix in a population due to genetic drift alone. We next attempt to better characterize the structure of biofilms inside MHPs to capture the truly three-dimensional nature of biofilms. In particular, we use intensity correlations to determine whether growth within a biofilm leads to clonal expansion due to genetic drift, a phenomenon already observed and characterized in bacterial colonies growing on agar plates [50].
We first characterize the spatial correlations within and between each species in figure 9. Specifically, we compute  , the correlation of a single genotype's density to all points located a radial distance r away, using
  , where
  is the fluorescence intensity of species i at location
  and the brackets denote an average over all points
  . Similarly, we measure
  , the cross-correlation between the GFP-WT and RFP-WT populations using
  . Figure 9 shows the functional dependence of
  and
and  (circles and squares, respectively) at a depth
  . Note that autocorrelation decays exponentially with increasing r, thereby providing a characteristic length scale of a single-species biofilm. The cross-correlation
  , on the other hand, progressively increases with r due to the volume exclusion between the two species. The characteristic length scale of this increase will also provide an indication of the characteristic aggregate size of the biofilm.
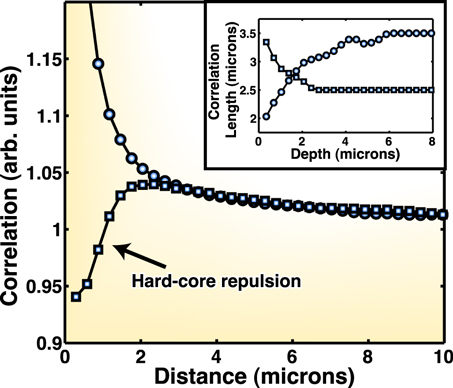
Figure 9. Spatial correlations. We measure the spatial autocorrelation (circles) and cross-correlation (squares) between the two species. Note that the cross-correlation is decreasing at small distances, an indication of some kind of hard-core repulsion between each cell. In the inset, we measure how the autocorrelation and cross-correlation distances vary with depth.
Download figure:
Standard image High-resolution imageWe extract characteristic length scales for the autocorrelation and cross-correlation to be approximately 3.5 and 2.5 μm, respectively, by fitting an exponential function to the measured correlations (figure 9, inset). Note that while there is an inherent exclusion between the GFP-WT and RFP-WT, which is simply due to the size of each cell, these length scales are somewhat greater than a single cell, which is usually  μm wide and
  μm long. These results indicate that cell aggregation is occurring at scales many times larger than a single cell. The size of the clonal expansion inside MHPs, however, is much smaller than that of colonies grown on agar plates [50], which eventually grow to be millimeter-sized.
We then characterize the genetic correlation of a biofilm along the z-direction by using the information about the depth-dependent cell distribution obtained from the confocal reconstruction. In figure 10, we show the fluorescence intensities as a vertical cross-section of the biofilm presented in figure 8. Note the presence of vertical domains of predominantly GFP-WT or RFP-WT cells. We create a binary image of the cross-section (using an intensity threshold of 75% of the maximum intensity) to better visualize the domains. Interestingly, the amount of overlap between the two genotypes is very small (these appear as yellow regions in the lower panel of figure 10) and the extent of the vertical domains is almost as high as the device itself.
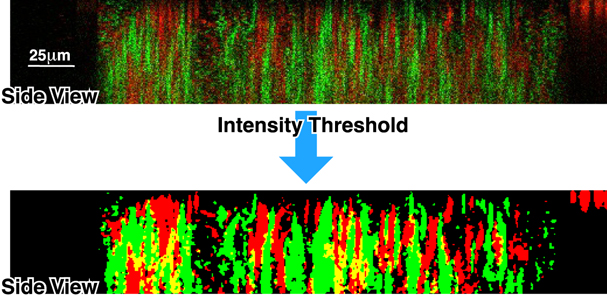
Figure 10. Vertical cell distribution. A representative example of a section of a biofilm shows vertically aligned domains of segregated GFP-WT or RFP-WT cells. The image is treated with an intensity threshold to better illustrate cell segregation.
Download figure:
Standard image High-resolution imageThe observations in figure 10 confirm a few assumptions. First, biofilm growth does seem to occur through genetic expansion, which is confirmed by the fact that we observe 'vertical' domains having the same phenotype in the 1:1 GFP-WT:RFP-WT biofilms. If the primary cause of growth were the random attachment of cells to the surface of the biofilm aggregate, we would not observe these domains. Second, biofilms do, in fact, seem to be attached to the floor of the MHPs when they are growing. This is indicated by the fact that these biofilms form vertical domains, meaning they probably grow upwards (toward the top of the MHP, where there is presumably less competition) from their attachment planes.
7. Conclusions and future directions
We have shown how we can use microfluidic technologies to study the development and evolution of biofilms. First we showed that the Keller–Segel model, when applied to bacterial self-interactions via signaling molecules, provides the first step toward the formation of biofilms through a fundamental instability, which prompts bacterial populations to crowd into small volumes. Then we described the developmental steps followed by a single species of bacteria as it forms biofilms inside micro-habitats with limited nutrient access. We next investigated the influence of biofilm formation on the competition dynamics of two bacterial species, and showed that each species spatially segregate themselves into habitats having access to different levels of nutrients. We continued to study the physical properties of non-adherent biofilms to measure their viscoelastic properties, and then used confocal microscopy to characterize the spatial distribution of cells within a biofilm to find that biofilm growth occurs through clonal expansion at the surface of the biofilms. We finished by describing a model system that allows us to study horizontal gene transfer (HGT) between spatially isolated biofilm populations. Using our model system, we described interesting events that seem to suggest that HGT, conferring antibiotic resistance, occurs between weakly interacting bacterial populations.
The remainder of this section will be rather speculative, and linked to the observation that the bacteria, which show quite different behavior at high cell density than free-swimming bacteria, are spending a significant fraction of their lifetime in a sessile state within the biofilms. In particular, we are interested in understanding the role that biofilm micro-habitats have in the evolution of bacterial communities. Indeed, it has been shown that the proximity of cells within a biofilm increases the potential for genetic exchange between individuals [51–53]. This genetic exchange often occurs through HGT, a general term for the transfer of genetic material between two organisms that may or may not be a member of the same species. HGT occurs in contrast to the transfer of genetic material from parent to offspring—called vertical gene transfer, or, more commonly, reproduction—that gave rise to the classic concept of Darwinian evolution. HGT occurs in nature through a number of different mechanisms, such as transformation, viral transduction and bacterial conjugation, and can result in either permanent genetic changes, if DNA is recombined into an organism's genome, or temporary changes, if organisms take up DNA but do not incorporate it into their genome.
As discussed above, E. coli have the ability to form biofilms, not only in response to stress, but also as a result of quorum sensing or as a response to an increase in bacterial density [30, 34]. A study by Maeda et al showed that when two different E. coli strains containing plasmids that confer different antibiotic resistances were allowed to form biofilms on pieces of membrane filter, some members of the population would undergo transformation to become doubly resistant [52]. Maeda et al measured that this would occur at a low frequency of between  and
and  per recipient cell [52]. Another study by Sun et al used stationary E. coli cultures to form biofilms and measured a transformation frequency of
  to
to  , which they noted is higher than the efficiency of some naturally competent bacteria, like M. smegmatis [54]. Though more work certainly needs to be done to fully characterize the behavior of E. coli within biofilms, we can understand from these studies that genetic exchange between bacteria not typically thought of as 'naturally competent' is certainly possible, and is spurred on greatly under conditions of stress and the formation of biofilms.
Our goal here is to study the capture of free DNA by competent E. coli cells. The general idea behind our experiment is to inoculate a device with two different strains that are able to interact and share media, but do not share physical space. To achieve this, we use two different strains of antibiotic-resistant E. coli, with different fluorescent markers on their respective plasmids, and observe the uptake by each strain of the other strain's plasmid as it is released into the environment. To ensure that DNA transfer does not occur through physical contact between individuals, we keep each population physically separated, so that they can not intermingle and form heterogeneous biofilms, in which we might not be able to make out the few cases of transformation.
The new device was obtained through a simple modification to the device described in the previous sections. Instead of one row, the new device has two rows of MHPs, in which the adjacent, interacting populations can grow and exchange genetic material through the 100 nm deep nanoslits (figure 11(a)). We use a separate inoculation port for each row, one on either end of the device, to ensure no cross-contamination occurs between each row of MHPs following the initial cell inoculation. Though the nanoslits restrict the bacteria themselves from moving between the two rows, they do still provide for the free exchange of media, including plasmids that might be present in that media. So, if a cell containing plasmids were to lyse, releasing its contents into the media, those plasmids would then be free to diffuse across the nanoslits and be taken up by cells on the other side. A cartoon depiction of this process is shown in figure 11(b).

Figure 11. (a) Schematic of the double 1D MHP chip used in the E. coli transformation experiments, showing MHPs in red, reservoirs in green and nanoslits as groups of dashes. (b) Scanning electron micropsope image of one of the double 1D MHP devices used in the proposed transformation experiments. Upon lysis, a cell releases its plasmids, which can then move across the nanoslits and be taken up by the cell in the other population. (c) Images of the same group of MHPs over a period of about 12 h, produced from merging the green and red channels. The production of RFP in the row to the right, which was only inoculated with GFP-producing bacteria, indicates the emergence of a doubly resistant population.
Download figure:
Standard image High-resolution imageTo observe the transformation occurring between two bacterial populations, we inoculated one row with GFP-producing, ampicillin-resistant E. coli and the other with RFP-producing, kanamycin-resistant E. coli. By flowing media containing each antibiotic in the reservoir closer to the strain with resistance to that antibiotic, as shown in panel (1) in figure 11(c), we produced a concentration gradient of each antibiotic across the width of the device. On both sides, the stronger concentration of antibiotic from the closer reservoir did not greatly affect the population with resistance to that antibiotic, but the weaker concentration from the further reservoir did produce a significant stress on the bacteria. This stress, felt by both populations, increases the competency rate of cells [54] and makes uptake of the plasmid from the other population favorable.
In figure 11(c), we observe a transfer of antibiotic resistance between the two isolated populations, but only between MHPs in which there was high cell density and significant biofilm development. In panel (1), the biofilms have already formed, though the cluster of RFP-producing, kanamycin-resistant bacteria in the bottom MHP have already begun to reduce in cell density. After a few hours, once many of these bacteria have died and released their plasmids into the media, a small population of bacteria begins to grow in the void left by the GFP-producing bacteria. This growth is newly visible in panel (2). For a couple of hours this new population appears to be producing only GFP, but it soon begins producing significant levels of RFP as well, indicating an event where transmission of antibiotic resistance between the two populations has occurred.
It is exciting to observe this kind of rapid migration of cells between MHPs following the exchange of a plasmid between two physically separated biofilms in a stressed environment. The close correlation of these two events indicates that this type of design could very rapidly select cells that have acquired resistance through HGT.
On a more speculative note, we have recently proposed that the physical properties of biofilms, as well as their developmental progression, mirror the destructive growth of cancer tissues within a host [55]. In biofilm communities, cells may switch metabolic states to cope with the limited influx of nutrients and oxygen due to the decreased diffusion of chemicals through the biofilm matrix. A similar cell specialization is also observed in cancer tissues: in addition to proliferative cancer cells, a tumor is also composed of specialized cells (e.g. fibroblasts, immune cells and endothelial cells, as shown in figure 12) that contain genetic alterations and actually co-evolve with the cancer cells [56, 57]. For instance, an extracellular matrix is produced in anomalously high quantities in tumors by stromal cells [58] and, like bacterial biofilms, limits the ability of chemotherapeutic drugs to penetrate the tumor. Since the additional matrix deposition also limits the diffusion of oxygen and nutrients into the tumor tissue, tumor cells switch to a fermentative metabolism (glycolysis) that consumes glucose without oxygen. Aerobic glycolysis of the cancer cells releases lactose, which contributes to the acidification of the tumor microenvironment [59]. It has been shown that surrounding fibroblasts and endothelial cells cope with this harmful environment by increasing the rate of lactate metabolism to lower the pH of the environment [60].

Figure 12. Cell–cell interactions. No tumor cell is acting alone. Strong interactions among different cell types (tumor cells, fibroblasts, endothelial cells) often give rise to an increased adaptability and more complex behaviors.
Download figure:
Standard image High-resolution image
Cancer tissues are thus a sophisticated collection of specialized cells that co-evolve with tumor cells to sustain the high metabolic needs of the tumor cells. This adaptation leads to levels of specialization by different cell types that go beyond the naive view that cancer tissues are highly disorganized. Although some levels of disorder are present within cancer tissues, the levels of specialization of the epithelial/stromal cell collective is in some ways very similar to the spatial variation and adaptation observed in biofilm communities. A better understanding of the complex symbiotic interplay between different cells within a bacterial biofilm may facilitate the study of analogous development within cancer tissues.
Acknowledgments
This work was performed in part at the Cornell NanoScale Facility, a member of the National Nanotechnology Infrastructure Network, which is supported by the National Science Foundation (grant no. ECS 03-35765). The research described was supported by an award (U54CA143803) from the US National Cancer Institute and in part by the National Science Foundation under grant no. PHYS-1066293, and the hospitality of the Aspen Center for Physics. DB thanks the NSF for NSF PHY-0940991. The content is solely the responsibility of the authors and does not necessarily represent the official views of the National Cancer Institute, the National Institutes of Health or the National Science Foundation.
Footnotes
- 6
Activated charcoal is carbon which has been processed so as to be riddled with small, low-volume pits, increasing the surface area for adsorption or chemical reactions.