

Abstract
A comparative investigation of the thermographic properties of Dy3+ -doped gadolinium aluminum perovskite GdAlO3 (GAP) and gadolinium aluminum garnet Gd3Al5O12 (GAG) was performed with special regard to the suitability of these materials for surface thermometry in harsh measurement environments. The phosphors were synthesized by conventional high-temperature solid-state method using lithium fluoride (LiF) as a flux. The effects of substituting Gd3+ by Lu3+ ions on the stability of the garnet structure and the luminescence properties of the phosphors were investigated. An efficient energy transfer from Gd3+ to Dy3+ resulted in significantly stronger Dy3+ emission obtained through Gd3+ excitation at 275 nm compared to direct excitation of Dy3+ at 352 nm. The luminescence intensity of GAP:Dy3+ with Lu3+ substitution was three times higher at room temperature compared to GAP:Dy3+ . Due to this intensity enhancement, the range of temperature measurements by the intensity ratio and decay time methods was extended from 900 K to 1100 K. The luminescence intensity of (Gd,Lu)AG:Dy3+ was doubled at room temperature compared to (Gd,Lu)AP:Dy3+ and the limit for reliable temperature measurements by the above mentioned methods was increased up to 1600 K.
Export citation and abstract BibTeX RIS

Content from this work may be used under the terms of the Creative Commons Attribution 4.0 licence. Any further distribution of this work must maintain attribution to the author(s) and the title of the work, journal citation and DOI.
1. Introduction
Phosphor thermometry is a laser-based diagnostic technique suitable for remote and non-intrusive temperature measurements on surfaces and in gaseous flows. Ceramic materials such as rare-earth aluminate perovskite and garnets with a general formula of LnAlO3 and Ln3Al5O12 (Ln: lanthanide and Y) can be utilized as thermographic phosphors and have been extensively studied for surface temperature measurements in gas turbines [1] and engines [2, 3] as well as for temperature analysis in gaseous flows [4, 5]. The best-known garnet compound is YAG, owing to its excellent chemical stability, optical isotropy, and particularly its ability to accept substantial amounts of trivalent Ln3+ ions for diverse optical functionalities. YAG doped with Dy3+ shows emission for temperatures up to 1800 K [1], while neither pressure nor oxygen concentration influence the luminescence emission characteristics [6]. However, the measurement capabilities at high temperatures are limited due to thermal quenching and the relatively low quantum efficiency of YAG:Dy3+ . Efforts have been made in the literature to improve the temperature-dependent luminescence characteristics of Ln3Al5O12 doped phosphor materials. Approaches such as slightly changing the host compound of YAG, e.g. by substituting the tetrahedral site Al3+ -O2− in YAG:Dy with B3+ -N3 [7, 8], or by adding a sensitizer such as Er3+ or Pr3+ [9, 10], were able to improve the luminescence properties. Further research concentrated on developing new phosphor materials based on Ln3Al5O12 garnet hosts [11, 12] or LnAlO3 perovskite hosts [13].
Gd3Al5O12 (GAG) has been much less explored than YAG, mainly due to its structural metastability. Generally the thermodynamic stability of the garnet structure strongly depends on the ionic radius of the incorporated Ln3+ [14], and it is only stable for rare-earth ions smaller than Gd3+ . Pure GAG is metastable and thermal decomposition to GdAlO3 perovskite (GAP) and Al2O3 occurs in a temperature range of 1300 °C–1500 °C, which makes sintering very difficult [14]. Compared to YAG, however, GAG may hold a number of advantages for optical applications such as the intrinsic 8S7/2  6IJ transition of Gd3+ (usually centered at 275 nm), which can be utilized as a new excitation source for some types of rare-earth activators. Thus, enhanced luminescence may be attained via an efficient energy transfer from Gd3+ to the activator [15–18]. Since the GAG lattice is more covalent than YAG due to the lower electronegativity of Gd3+ (
 ) compared to that of Y3+ (
 ), new emission features may appear, resulting in improved emission intensity. So far it has been difficult to synthesize single phase of GAP and GAG materials due to difficulties in controlling stoichiometric composition. Different solutions were proposed to stabilize the structures by changing the synthesis [19, 20] or by replacing the Gd3+ site in GAG with small Ln3+ ions to form (Gd1−xLnx)AG solid solution [14, 21]. Li et al [14] extensively studied the effects of Lu3+ content on phase evolution and properties of the resultant (Gd1−xLux)AG. Li et al [22] demonstrated that (Gd1−xLux)AG was significantly superior to YAG as a host for Dy3+ emission. With the more covalent lattice and particularly via an efficient Gd3+
  Dy3+ energy transfer, greatly enhanced blue and yellow emissions were simultaneously attained. A good summary of the recent achievements in stabilization of the metastable lattice of gadolinium aluminate garnet can be found in [23].
Gadolinium aluminum perovskite (GAP) doped with Eu3+ has been used as a luminescence thermometer [19, 24] and 2D temperature mapping by Cr-doped GAP has been successfully demonstrated [13]. The temperature-dependent characteristics of Gd3Ga3Al2O12 (GGAG) doped with various rare earth [25, 26] or Cr [27] have been studied recently, underlining the promising characteristics of both GAP and GGAG as a host material.
To our knowledge, the temperature-dependent characteristics of (Gd,Lu)3Al5O12 (GAG) and (Gd,Lu)AlO3 (GAP) phosphors doped by Dy3+ have not been studied in the literature. Thus, in this work we systematically investigate the applicability of these phosphor materials for surface temperature measurements in harsh environments. Comparative studies were also made with GdAlO3:Dy3+ and (Gd,La)AlO3:Dy3+ phosphor systems to evaluate the influence of Lu3+ substitution on the overall temperature performance.
2. Materials and methods
2.1. Sample preparation and characterization
The phosphor powders used in the present study were prepared by the conventional high temperature solid-state method such that they had the following overall compositions: (Gd0.8Lu0.2)2.97Dy0.03Al5O12, (Gd0.8Lu0.2)2.94Dy0.06Al5O12, (Gd0.8Lu0.2)2.91Dy0.09Al5O12, Gd0.98Dy0.02AlO3, (Gd0.78La0.2)Dy0.02AlO3 and (Gd0.78Lu0.2)Dy0.02AlO3. The amount of Lutetium (Lu3+) was chosen based on the study of Li et al [22], who observed decreasing intensities of both the Gadolinium (Gd3+) and Dysprosium (Dy3+) excitation bands for amounts of Lu3+ higher than 20%, due to the higher electronegativity of Lu3+ ( ) than Gd3+ (
 ). For comparability, a Lanthanum (La3+) stabilized host was synthesized using the same amount of La3+ as Lu3+ . The main starting materials for the solid-state synthesis were Gd2O3, Lu2O3, La2O3, Al2O3 (all 99.99%, Alfa Aesar) and Dy2O3 (99.9%, Reacton), which were mixed according to the stoichiometric ratio. Lithium fluoride (LiF) was selected as flux material in order to decrease the sintering temperature and to improve the phosphor efficiency. The atomic radius of Dy3+ (105.2 pm) is slightly lower than that of the Gd3+ (107.8 pm) atom, which can cause lattice site defects. The incorporation of smaller ions such as Li+ and F− can work as a compensator in the crystal lattice. The addition of 10 wt.% of LiF to the stoichiometric compositions supports the homogeneous distribution of Dy3+ ions in the lattice and promotes both a higher crystallization degree and reduced surface defects. Generally, the synthesis was done for 1 g of the final product and all starting materials were mixed and ground thoroughly in an agate mortar. After grinding, powders were heated in an alumina crucible in air for four hours at a heating temperature of 1473 K. Subsequently, the samples were cooled to room temperature and ground again to fine powder. In contrast to the GAP samples, the fabrication of GAG phosphors is not trivial due to its structural metastability, and special care must be taken during synthesis. The crystalline structure of the samples was characterized by x-ray diffractometry (Panalytical EMPYREAN XRD Powder/SAXS Diffractometer) with a Cu-K
 radiation source (
 ) at room temperature. The morphology and the size of the phosphor powders was imaged with a scanning electron microscope (SEM, JEOL JSM-7610F) equipped with a field emission gun operated at 5 kV. The optical properties of the powders at room temperature were measured using a spectrofluorometer (Jasco FP-8500) equipped with a Xe arc lamp as the excitation source. Photoluminescence excitation and emission spectra were recorded under identical conditions for all samples with a spectral resolution of 5 nm on both, excitation and emission side. The luminescence emission spectra were measured for excitation wavelengths of 275 nm and 352 nm, respectively.
2.2. Experimental set-up for high temperature measurements
To determine the temperature-dependent luminescence characteristics, the phosphor samples were heated from room temperature up to 1600 K. Each phosphor sample was placed into a corundum ceramic sample carrier and was reproducibly positioned inside a high temperature oven (Supertherm HT 18/10) with a reproducible regulating inaccuracy of 5 K. The bulk density was kept nearly constant for all samples, analysing the same mass of powder in a container with constant volume. A type B thermocouple (shielded to avoid radiation effects, 0.75% inaccuracy) was used to monitor the temperature in the proximity of the phosphor sample. The third harmonic of a pulsed Nd:YAG laser (Quantel Q-smart 450, pulse duration: 6 ns, repetition rate: 10 Hz) with a laser fluence of 0.03 J cm−2 per pulse was used for excitation. The chosen laser fluence allowed to obtain sufficient signal at high temperatures but it was low enough to minimize heating effects in the sample. Excitation and detection were carried out along the optical access of the furnace, using a 355 nm dichroic mirror. The subsequently emitted luminescence was imaged onto the detector by two spherical lenses positioned just outside of the furnace, which collimated and focused the luminescence signal. A 355 nm longpass edge filter blocked the backscattered laser light ahead of the detector. The luminescence lifetime was recorded with a high-speed photo diode (Thorlabs, DET210) in combination with an oscilloscope (PicoScope 6, real-time sampling rate of 200  s div−1) and averaged over 51 shots. A bandpass filter (494
  10 nm) was placed in front of the photo diode to measure the specific lifetime of the 4F9/2
  6H15/2 transition of Dy3+ . An Ocean Optics Flame-S spectrometer covering a wavelength range of 400 nm to 700 nm was employed for spectral emission analysis. The spectrometer was equipped with a 16 bit 2048 Pixel CCD detector, a slit width of 25
  m and a grating of 1200 lines mm−1. To avoid strong interference of black-body radiation, an integration duration of 2 ms was chosen. All spectra were corrected for instrumental response, and each measurement is an average of 300 single shots. The spectral and lifetime measurements were done separately, and all optical measurements were conducted under identical conditions for all samples, thus minimizing the influence of the measurement equipment.
3. Results and discussion
3.1. Phase identification and morphology
X-ray diffration was performed to verify the successful synthesis of (Gd,Lu)AG:Dy3+ , GAP:Dy3+ , (Gd,La)AP:Dy3+ and (Gd,Lu)AP:Dy3+ phosphors in the form of pure garnet and orthorhombic phase, respectively, without appreciable changes due to the Dy3+ doping. The observed diffraction patterns are shown in figure 1 for (Gd0.8Lu0.2)3Al5O12 and (Gd0.8Lu0.2)AlO3 doped with 2 mol% of Dy3+ . It has been shown before that both the (Gd,Lu)AP and the (Gd,Lu)AG sample have marginally smaller lattice constants than the non-stabilized GdAlO3 (space group: Pbnm [20]) and Gd3Al5O12 (space group: Ia3d [22]). This can be explained by the smaller ionic radius of Lu3+ than Gd3+ . No additional or missing reflections were observed which could imply the presence of unknown byproducts.

Figure 1. XRD patterns of the (Gd,Lu)AP:Dy3+ and (Gd,Lu)AG:Dy3+ phosphor synthesized by solid state synthesis. The standard reference XRD patterns of GAG (98-002-3849) and GAP (98-005-9848) provided by the International Centre for Diffraction Data (ICDD) are given for comparison.
Download figure:
Standard image High-resolution imageExamples of the surface morphology and the crystallite sizes of the phosphor powders are shown for (Gd0.8Lu0.2)3Al5O12 and (Gd0.8Lu0.2)AlO3 doped by 2 mol% of Dy3+ in figure 2. The SEM images show that the overall morphology is comparable for all garnet samples. The phosphor particles form irregularly shaped agglomerates due to the flux used during the sintering process, and the size of the crystallites is in the range of about two to seven micrometers. The GAP phosphors have a higher degree of agglomeration, and the addition of Lu3+ or La3+ to the perovskite compound does not change the particle shape.

Figure 2. Particle morphology of the (Gd,Lu)AP:Dy3+ and (Gd,Lu)AG:Dy3+ phosphor synthesized by solid-state synthesis.
Download figure:
Standard image High-resolution image3.2. Luminescence properties at room temperature
Figure 3 shows the room temperature photoluminescence excitation (PLE) spectra of the different GAP and GAG phosphors, monitored at emission wavelengths of 583 nm and 584 nm, respectively. The monitored wavelength was chosen based on the maximum emission peak, which differed marginally between the perovskite and garnet hosts. Four major bands arise in the longer wavelength region centered at ∼325 nm, ∼352 nm, ∼366 nm and ∼386 nm, which are assigned to the f–f transitions of the Dy3+ ion from the 6H15/2 ground state (GS) to higher levels 4M17/2, 4M15/2, 6P7/2, 4I11/2, 6P5/2 4I13/2, and 4F7/2, respectively. As marked in the figure, other weaker bands were also observed, which slightly differ for the perovskite and the garnet host. Besides, the PLE spectra of all samples exhibit a strong excitation band at ∼275 nm corresponding to the 8S7/2  6IJ transition and a weaker line at ∼312 nm for the 8S7/2
  6PJ intra-f–f transition of Gd3+ . The presence of these Gd3+ -lines in the excitation spectrum of Dy3+ examined at 584 nm provides reliable evidence of an efficient energy transfer from the Gd3+ to the Dy3+ activators.

Figure 3. Room temperature excitation spectra of (a) GAP:Dy3+ and (b) GAG:Dy3+ phosphors. The ground state of Dy3+ is denoted by GS. The 583 nm and 584 nm lines were monitored for generation of excitation spectra of GAP and GAG, respectively.
Download figure:
Standard image High-resolution imageThe luminescence emission spectra of GAP phosphors obtained at UV excitation at 275 nm and 352 nm are shown in figure 4. The spectra of GAP: Dy3+ , (Gd,Lu)AP: Dy3+ and (Gd,La)AP: Dy3+ have similar shapes for 352 nm excitation. Two dominant emission peaks appear at 480 nm (blue) and 580 nm (yellow) belonging to the 4F9/2  6H15/2 and the 4F9/2
  6H13/2 transition of Dy3+ , respectively. Weaker emission bands are observed at 670 nm and 760 nm due to the 4F9/2
  6H11/2 and 4F9/2
  6H9/2 transitions. The integrated yellow emission is more intense than the blue one in all cases. For the excitation at 275 nm an additional unidentified broad emission band appears between 650 nm to 800 nm. This effect might be due to an unknown interaction between the host and the Dy3+ ions, or the appearance of some defect-induced host emission. The luminescence intensity at room temperature of GAP:Dy3+ with Lu3+ substitution is doubled for an excitation wavelength at 275 nm compared to GAP:Dy3+ and the intensity is more than three times higher for excitation wavelengths above 310 nm. The introduction of La3+ into the host further increases the luminescence intensity. Generally, for all samples the luminescence intensity is the highest for excitation at 275 nm.
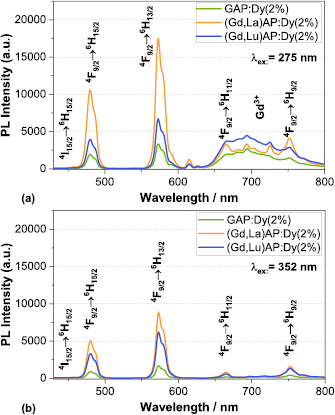
Figure 4. Room temperature emission spectrum of GAP: Dy3+ , (Gd,Lu)AP: Dy3+ and (Gd,La)AP: Dy3+ excited at (a) 275 nm and (b) 352 nm.
Download figure:
Standard image High-resolution imageFigure 5 compares the emission spectra of (Gd,Lu)AG: Dy3+ prepared at various concentrations of Dy3+ (1–3 mol%) for excitation at 275 nm and 352 nm. Similar to the perovskite phosphors, the strongest emission bands occur at 480 nm and 580 nm with lower emission at 670 nm and 760 nm, attributed to the transition from the excited 4F9/2 state to the 6H15/2, 6H13/2, 6H11/2 and 6H9/2 states, respectively. Comparable to the GAP host, an excitation at 275 nm produces a broad emission band starting from 730 nm, which can likewise be associated with the influence of the (Gd,Lu)AG host. Depending on the excitation wavelength, maximum intensity values occurred for Dy3+ concentrations of 1% ( ex = 275 nm) or 2% (
 ex = 352 nm), an aspect that also manifests itself in the excitation spectrum. This suggests that concentration quenching is more significant in the case of energy transfer from Gd3+ to Dy3+ . The luminescence intensity of the garnet (Gd,Lu)AG:Dy(2%) as can be seen from figure 5 is almost doubled at room temperature compared to (Gd,Lu)AP:Dy(2%) perovskite. No garnet samples were synthesized with La3+ substitution, since La3+ ions are bigger than Gd3+ ions, and thus a stabilization of the GAG garnet matrix is not possible.

Figure 5. Room temperature emission spectrum of (Gd,Lu)AG: Dy3+ prepared at various concentrations of Dy3+ (1–3 mol%) excited at (a) 275 nm and (b) 352 nm.
Download figure:
Standard image High-resolution image3.3. Luminescence properties at high temperatures
The temperature-dependent luminescence properties of phosphors are the central parameter to determine the application field of the material for phosphor thermometry. The spectral emission behaviour of (Gd,Lu)AP: Dy3+ for temperatures from 300 K to 1100 K is shown in figure 6, all spectra being normalized to the peak at 480 nm. At room temperature, two emission bands at 480 nm and 580 nm are prominent, which can be attributed to the transition from the 4F9/2 excited state to the 6H15/2 and 6H13/2 state of Dy3+ , respectively. A strongly temperature-dependent peak appears at 458 nm due to the 4I15/2  6H15/2 transition. The 4F9/2 and 4I15/2 energy levels of Dy3+ are separated only by about 1000 cm−1 and at low temperatures the upper level remains nearly unpopulated. With rising temperatures the population of the 4I15/2 state gradually increases according to the thermal equilibrium process, which consequently leads to significantly increased emission intensities around 458 nm. However, for temperatures above 1100 K luminescence signal intensities of GAP:Dy3+ dropped to levels that were too low for reliable signal detection. The integral luminescence emission in the yellow (580 nm) is higher by a factor of five than the emission in the blue (480 nm), and the ratio between the two emission bands increases with temperature. No significant change in the shape and position of the emission bands occurs for the substitution of Gd3+ by La3+ or Lu3+.
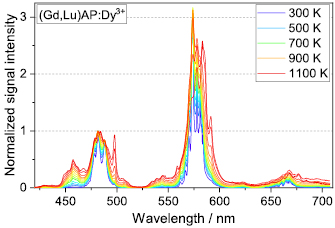
Figure 6. Luminescence spectral intensities for (Gd,Lu)AP: Dy3+ from 300 K to 1100 K. Measurements were taken every 50 K and five spectra for representative temperatures are listed in the legend. All spectra are normalized to the peak at 480 nm.
Download figure:
Standard image High-resolution imageFigure 7 shows the luminescence emission spectrum of (Gd,Lu)AG:Dy(2%) from 300 K to 1600 K, normalized to the peak at 497 nm. Similar peaks appear for the garnet phosphors as compared to the perovskite (Gd,Lu)AP. In contrast to the perovskite materials, (Gd,Lu)AG:Dy(2%) has slightly sharper and more defined peaks, especially in the range from 475–500 nm, which can be an indicator for a lower number of defects in the garnet hosts or stronger electron-phonon coupling. Lattice vibration leads to a broadening of the peaks for increasing temperature, but no shift in the peak position is observed. The yellow-to-blue ratio of (Gd,Lu)AG:Dy(2%) is lowered by a factor of two as compared to (Gd,Lu)AP:Dy(2%). The increased emission in the blue part of the spectrum is an advantage of the garnet materials with regard to thermometry applications, since the influence of black-body radiation is lower in the blue part of the wavelength spectrum.
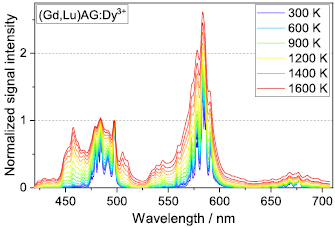
Figure 7. Luminescence spectral intensities for the (Gd,Lu)AG: Dy(2%) from 300 K to 1600 K. Measurements were taken every 50 K and six spectra for representative temperatures are listed in the legend. All spectra are normalized to the peak at 497 nm.
Download figure:
Standard image High-resolution imageThe luminescence intensity ratio between the temperature dependent band around 458 nm corresponding to the 4I15/2  6H15/2 transition and the temperature-independent emission centered at 480 nm due to the 4F9/2
 6H15/2 transition is given in figure 8. In the present study, the intensity ratio is calculated based on the integrated intensity of two wavelength bands, one from 445 nm to 465 nm and the other from 480 nm to 497 nm. This approach corresponds to the method actually applied in thermometry applications. The emitted intensities of these two levels Ii are proportional to the population of each energy level and the intensity ratio R from two thermally coupled energy levels, denoted by 1 and 2, is given by [28, 29]
where the parameters gi, Ai and  describe the degeneracy of the thermalized level, the total spontaneous radiative emission rate, and the average phonon energy of each transition, respectively; ci is a pre-exponential factor accounting for the response of the detection system and considered equal to unity since the emission spectra have been corrected for the instrumental response.
  is the energy gap between the two levels, k is Boltzmann's constant, and T the temperature.
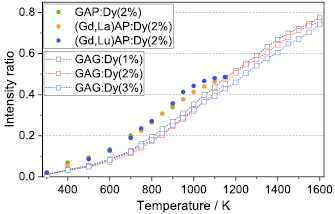
Figure 8. Temperature calibration curve of the studied phosphor materials calculated based on the ratio between the 4I15/2  6H15/2 (
 458 nm) and 4F9/2
  6H15/2 (
 480 nm) transition.
Download figure:
Standard image High-resolution imageThe three curves for GAP:Dy3+ , (Gd,Lu)AP:Dy3+ and (Gd,La)AP:Dy3+ show a similar trend with similar temperature sensitivity. The luminescence signal intensity for GAP:Dy3+ was high enough up to 900 K to calculate the intensity ratio. The Lu3+ and La3+ substitution increased the absolute luminescence intensity, thereby extending the measurement range up to 1150 K and 1100 K, respectively.
For the GAG samples, a variation of the dopant concentration from 1 to 3 mol% of Dy3+ does only marginally influence the trend of the intensity ratio curve and the temperature sensitivity. All three garnet phosphors offered measurement capabilities up to temperatures of 1600 K, because of a great enhancement of the luminescence intensity of (Gd,Lu)AG:Dy3+ . Note that the maximum temperatures were limited by the heating capabilities of the oven.
The temperature dependence of the absolute luminescence intensities of the phosphor samples are shown in figure 9 for the perovskite hosts and in figure 10 for the garnet samples. The absolute luminescence values are determined based on the integrated intensities in the wavelength region from 440 nm to 520 nm. Signal levels for GAP:Dy3+ are strongly inferior compared to the samples with Lu3+ and La3+ substitution over the whole temperature range. For the (Gd,Lu)AP:Dy3+ and (Gd,La)AP:Dy3+ phosphors, intensities start dropping strongly above 800 K, and no acceptable signal can be detected above 1100 K. The intensities of the (Gd,Lu)AG:Dy3+ at various dopant concentrations differ by a factor of almost 2 at room temperature compared to (Gd,Lu)AP:Dy3+ , and they are about two orders of magnitude higher at 1000 K. A remarkable increase in signal intensities with temperature for all three (Gd,Lu)AG:Dy3+ samples is observed. For the thermographic phosphor YAG:Dy3+ this distinct increase in signal intensity was not visible [30].
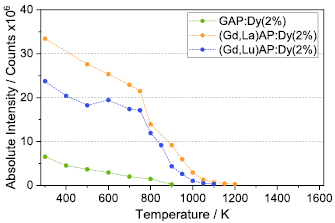
Figure 9. Absolute luminescence intensities of GAP: Dy3+ , (Gd,Lu)AP: Dy3+ and (Gd,La)AP: Dy3+ excited at 355 nm over the measured temperature range and integrated over the wavelength region from 440 nm to 520 nm.
Download figure:
Standard image High-resolution image
Figure 10. Absolute luminescence intensities of the (Gd,Lu)AG:Dy3+ samples excited at 355 nm over the measured temperature range and integrated over the wavelength region from 440 nm to 520 nm.
Download figure:
Standard image High-resolution imageThe luminescence emission lifetimes of the 4F9/2  6H15/2 transition are shown in figure 11 for all studied phosphor samples. The lifetime
  of the emission is determined by the rates of the radiative and non-radiative transition probability from the excited state. While the probability of the radiative process is usually temperature-independent, non-radiative processes such as vibrational relaxation, internal conversions and thermal quenching become more likely with increasing temperature. Assuming a single-exponential decay time, the decay of the population of the excited state is directly proportional to the measurable decrease of the phosphorescence intensity
where I0 is the initial signal intensity.

Figure 11. Temperature-dependent decay time characteristics for the 4F9/2  6H15/2 transition of the different host material samples.
Download figure:
Standard image High-resolution image
Comparing the temperature-dependent lifetime characteristics of the garnet phosphors with different concentrations of Dy3+ , all samples show a similar trend. The lifetime remains nearly constant up to a quenching temperature of nearly 1200 K, above which the lifetime continuously decreases. This temperature region from 1200 K up to 1600 K can be used for phosphor thermometry based on the lifetime method. However, even though general trends are similar, the absolute lifetime strongly varies with dopant concentrations. At room temperature, it decreases from 750  s for the lowest Dy3+ concentration of 1 mol% over 600
  s for GAG:Dy(2%) and down to 450
  s for the sample with 3 mol% Dy3+ . The decreasing lifetime values can be explained by stronger concentration quenching for higher amounts of activator ions, although this increased non-radiative transition rate is compensated by a higher luminescence signal from a larger quantity of optically active ions. The lifetime of GAG:Dy(2%) at room temperature is close to that (606
  s) reported for YAG(BN):Dy(2%), but is significantly lower than observed for YAG:Dy(2%) (800
  s) [30].
The decay time and maximum temperature of the phosphors GAP:Dy3+ , (Gd,La)AP:Dy3+ and (Gd,Lu)AP:Dy3+ are significantly lower compared to those of (Gd,Lu)AG:Dy3+ . These perovskite materials have the same quenching point at 650 K, and the decay time is about 400  s at room temperature. The signal of GAP:Dy3+ is almost completely quenched above 900 K. Since the hosts with either Lu3+ or La3+ substitution have higher luminescence intensity, the measurement range based on the lifetime approach can be extended by 100 K or 50 K, respectively. Compared to YAP:Dy3+ perovskite with a lifetime of about 600
  s and a quenching temperature of 1400 K [30], the high temperature measurement capabilities of GAP:Dy3+ and its variations are significantly limited.
4. Conclusion
In this study we characterized the luminescence properties of two classes of phosphors materials based on GAP:Dy3+ and GAG:Dy3+ for their application in high temperature phosphor thermometry on surfaces. The XRD results of samples prepared by solid state synthesis demonstrate well crystallized pure garnet and orthorhombic phases, and SEM shows that the samples are in a range of 2–7  m in size. The lifetime of GAG:Dy3+ shows a temperature sensitivity between 1200 K and 1600 K, which could be used for thermometry. The samples based on GAP:Dy3+ have a shorter lifetime, however the temperature sensitive region is limited to the temperature region from 700 K to 1000 K. The luminescence intensity of GAP doped by Dy3+ with Lu3+ substitution is three times higher at room temperature compared to that of GAP:Dy3+ . Due to this luminescence intensity enhancement, the range of temperature measurements by the intensity ratio method was extended from 900 K to 1100 K. The luminescence intensity of (Gd,Lu)AG:Dy3+ was more than doubled at room temperature compared to that of (Gd,Lu)AP:Dy3+ . The enhanced luminescence intensity and the higher quenching temperature of (Gd,Lu)AG:Dy3+ increased the limit for reliable phosphor thermometry by the above mentioned methods up to 1600 K. The luminescence properties of (Gd,Lu)AG:Dy3+ are superior to those of the well-known garnet YAG:Dy3+ , which makes it a promising candidate for high temperature thermometry application. Further improvement of the quenching temperature and the absolute intensity might be possible by an excitation at 275 nm and will be tested in the future. Based on these results, it can be stated that (Gd,Lu)AG:Dy3+ is a promising phosphor for high temperature measurement with improved characteristics compared to YAG:Dy3+.
Acknowledgments
The authors gratefully acknowledge financial support of the Deutsche Forschungsgemeinschaft (DFG-Zi 1384/1) for research work on high-temperature luminescence characteristics. Parts of this research (phosphor synthesis and materials investigation at room temperature) were performed in the framework of the Energie Campus Nürnberg and were supported by funding through the Bavaria on the Move Initiative of the State of Bavaria. Liudmyla Chepyga would also like to thank the Bayerische Forschungsstiftung (Project DOK-170-14) for their financial support. Appreciation is also extended to Dr Sytnyk for SEM measurements.