
Abstract
We have studied the reaction of phenylacetylene (PA) with chloro-, bromo-, and iodobenzene on the Au(1 1 1) surface as a model system for the gold-catalysed Sonogashira cross-coupling. Both ultrahigh vacuum-based and ambient pressure x-ray photoelectron spectroscopy show that iodo- and chlorobenzene (IB and CB) undergo the cross-coupling reaction towards diphenylacetylene. Bromobenzene (BB), in contrast, does not react in the UHV experiments. Further, at ambient pressure signs are found for poisoning of the Au(1 1 1) surface by a carbon species formed in the reaction. The understanding obtained in the reaction experiments are based on a thorough investigation of the adsorption of PA, IB, CB, and BB on the Au(1 1 1) surface by soft x-ray absorption spectroscopy and temperature-dependent x-ray photoelectron spectroscopy. In particular, the experiments provide the orientation of the intact adsorbates with respect to the surfaces at liquid nitrogen temperature. Dissociation in the temperature regime between −80 and −15 °C is observed for iodo- and chlorobenzene, but not for BB, in agreement with that only IB and CB, but not BB, react with PA to form diphenylacetylene. The difference is tentatively attributed to a difference in surface orientation of the different halobenzenes.
Export citation and abstract BibTeX RIS

Original content from this work may be used under the terms of the Creative Commons Attribution 3.0 licence. Any further distribution of this work must maintain attribution to the author(s) and the title of the work, journal citation and DOI.
1. Introduction
Metal-catalysed cross-coupling reactions to form C–C bonds are of paramount importance in organic synthesis with a range of application in the production of fine chemicals and pharmaceuticals [1–3]. Most often molecular species or metal nanoparticles based on palladium or nickel have been used as catalysts [4]. Among cross-coupling reactions, the Sonogashira cross-coupling, see scheme 1, is unique in that it uses unfunctionalized acetylenes as a coupling partner, thus forming a product with one sp-hybridized carbon atom [5]. It is also unique in that gold is active in the Sonogashira cross-coupling, primarily in the form of gold nanoparticles [6–12]. Also extended gold surfaces [Au(1 1 1)] have been shown to mediate the cross-coupling between iodobenzene (IB) and phenylacetylene (PA) [13, 14]. The latter finding unambiguously shows that cross-coupling also can take place under heterogeneous conditions, and a mechanism for the heterogeneous coupling was also proposed which involves C–I bond cleavage on the gold surface [15]. This is in agreement with previous studies on the adsorption and dissociation of IB on Au(1 1 1), where it was found that IB dissociates on the Au(1 1 1) surface at 175 K, producing, among other things, biphenyl and I2 [16]. It has also been shown that the Au(1 1 1) facets of Au nanorods are more effective in mediating the Sonogashira coupling reaction compared to their Au(1 0 0) facets [17]. While basic knowledge on the Sonogashira coupling over gold thus is readily available, the details of the reaction mechanism remain not fully clarified [18], and investigations which address these details are needed to further the field.

Scheme 1. Coupling reactions that are reported to occur on the extended Au(1 1 1) surface.
Download figure:
Standard image High-resolution imageA general trend in cross-coupling reactions is the development of catalysts that allow the use of less reactive, but cheaper and more available bromo- and particularly chlorobenzenes (CBs) [19]. For the gold-catalysed Sonogashira reaction this concept has, however, hardly been explored at all. All examples include IBs, while, to our knowledge, to-date only two studies exist which address the Sonogashira coupling of bromobenzene (BB) and CB. Boronat et al [20] investigated the dissociation of IB, BB, and CB over extended Au(1 1 1) surfaces and Au nanoparticles using density functional theory (DFT), and it was found that all three compounds adhere to similar dissociation mechanism on the Au(1 1 1) surface, with IB having the lowest activation energy and CB the highest. Oliver-Meseguer et al investigated the Sonogashira cross-coupling over Au nanoparticles and -clusters for a variety of iodo-, bromo-, and chlorobenzene derivatives with aliphatic and aromatic alkynes [10]. Their findings agree with Boronat et al insofar as CB derivatives resulted in lower yields. Experimental data on unfunctionalized BB and CB are not available so far, however.
Here we present an analogous experimental study using x-ray photoelectron spectroscopy (XPS) and ambient pressure XPS (APXPS) to investigate the interaction of IB, BB, and CB with PA. From our spectroscopy data we conclude that the Au(1 1 1) surface mediates the Sonogashira cross-coupling between PA and both IB and CB in ultrahigh vacuum (UHV) and at ambient pressure, while no cross-coupling is found for BB. This is partly attributed to the dissociation of the C–I bond of IB and the low bond angle between CB and the substrate. We find also, however, that at elevated temperature in ambient pressure the Au(1 1 1) surface is inactivated rapidly by formation of a carbon species. This surface poison is not seen in the UHV measurements, which illustrates the importance of approaching real pressure and temperature conditions in surface studies on catalysis.
2. Experimental
The temperature-dependent x-ray photoelectron spectroscopy (TDXPS) and temperature-dependent reaction XPS (TDRXPS) experiments were performed at beamline D1011 [21] and the APXPS experiments at the SPECIES beamline [22] on the MAX-II electron storage ring of the National Swedish Synchrotron Radiation Facility MAX IV Laboratory in Lund. The D1011 experimental system consists of a preparation chamber separated by a gate valve from an analysis chamber, both with a base pressure in the 10−10 mbar range. The preparation chamber hosts standard surface science equipment for sample preparation and characterization. The analysis chamber is equipped with a Scienta SES-200 electron energy analyser and a partial electron yield detector. The APXPS end station [23, 24] at the SPECIES beamline consists of a preparation chamber and an analysis chamber separated by a gate valve, both with a base pressure in the low 10−10 mbar range. The preparation chamber houses standard surface science equipment for cleaning and sample characterization. The analysis chamber houses a reaction cell inside the main vacuum system that, after docking to the SPECS Phoibos 150 NAP electron energy analyser, enables acquisition of x-ray photoelectron (XP) spectra at pressures up to 25 mbar. This scheme allows for quick switching (~10 min) between UHV and ambient pressure investigations effectively bridging the pressure gap and linking previous UHV results to ambient pressure data.
For the TDXPS and TDRXPS measurements the Au(1 1 1) crystal was mounted on the sample manipulator in a tungsten wire, while for the APXPS measurements the crystal was mounted on a transferrable stainless steel sample plate. In both cases, the sample temperature was measured by a type K thermocouple, mounted in a hole in the side of the Au(1 1 1) crystal. The sample was cleaned by Ar+-sputtering using an acceleration voltage of 1 kV, followed by thermal annealing at 550 °C. During the TDXPS and TDRXPS experiments, the Au(1 1 1) support was cooled using liquid nitrogen as specified below. CB (C6H5Cl), BB (C6H5Br), IB (C6H5I), and PA (C6H5CCH) were provided through a leak valve from a UHV-tight glass test tube. The reagents were degassed prior to dosing by several freeze-pump-thaw cycles. For the TDXPS and TDRXPS measurements, they were then dosed onto the liquid nitrogen-cooled Au(1 1 1) support at a temperature of −160 °C. Doses are given in quantities of L (1 L = 1 Langmuir = 1.33 × 10⁻⁶ mbar × s), while for the APXPS measurements the compounds were dosed onto the Au(1 1 1) crystal at a pressure of about (0.2 ± 0.05) mbar. Coverages were estimated from the attenuation of the Au 4f7/2 line, assuming the same electron attenuation properties as benzene for all chemicals, with an electron inelastic mean free path (IMFP) of 11.7 Å [25]. Monolayer (ML) reference spectra were obtained from the temperature-dependent x-ray photoelectron (TDXP) spectra by identifying the point of multilayer desorption. Here, a ML is defined in terms of surface saturation, i.e. the coverage when no further molecule can be accommodated in the first adsorbate layer on the Au(1 1 1) surface anymore, but instead growth of a second layer would start. For the XAS and XPS measurements the compounds were dosed onto the Au(1 1 1) surface at pressures in the 10−9 mbar range, and coverages of 0.75 ML (1.1 L dose), 0.6 ML (1.1 L), 0.3 ML (0.2 L), and 0.3 ML (0.1 L) of PA, CB, BB, and IB were achieved. In the TDXPS experiments, initial multilayers were prepared on the Au(1 1 1) surface by dosing the pure compounds at pressures in the 10−8 mbar range. These multilayers correspond to coverages of 3.1 ML (PA), 5.4 ML (CB), 1.9 ML (BB), and 5 ML (IB), respectively. For the TDRXPS measurements 0.4 ML (0.5 L) of PA were dosed onto the Au(1 1 1) surface pre-covered by 0.7 ML CB, 0.15 ML BB, and 0.4 ML IB, respectively. All TDXP and TDRXP spectra were measured in sets of C 1s, Au 4f, and halogen core level spectra (Cl 2p/Br 3d/I 4d for CB/BB/IB) during the heating run. For the TDXPS measurements, approximate heating rates of 3.2 °C min−1, 5.3 °C min−1, 4.2 °C min−1, and 4 °C min−1 were used for the PA, CB, BB, and IB preparations. In the TDRXPS measurements the heating rates were about 4.1 °C min−1, 4.4 °C min−1, and 5.3 °C min−1 for the preparations of PA on CB, BB, and IB, respectively.
All XP spectra were collected in normal emission geometry with the light incident at a 45° angle relative to the surface. All XP, TDXP, TDRXP, and ambient pressure x-ray photoelectron (APXP) spectra were calibrated to the Au 4f7/2 component of a Au 4f spectrum. The Au 4f spectrum itself was calibrated to a Fermi energy-calibrated Au 4f7/2 line acquired on the clean Au(1 1 1) surface. All XP spectra were acquired with an analyser pass energy of 50 eV. The C 1s, Cl 2p, and all TDXP spectra were measured with a photon energy of 380 eV at an overall experimental resolution of 215 meV. The Br 3d spectrum of the monolayer was collected using photons of an energy of 180 eV with an overall resolution of 185 meV, while the I 3d spectrum was measured using photons of an energy of 725 eV at an overall resolution of 350 meV. A Shirley-type background was removed from all Au 4f spectra, while a polynomial background was used in the case of C 1s and halogen core level lines. For all C 1s TDXP spectra the binding energy is given in terms of the feature's peak maximum position. All analysis was performed within the programming environment Igor Pro, using the built-in minimization algorithm and Voigt functions [26, 27] for fitting. Potential beam damage was evaluated by measuring subsequent fast C 1s XP spectra in the same spot, and it was found not to be an issue.
The XAS data were acquired using a multichannel plate-based partial electron yield detector mounted under the sample at a 90° angle to the incoming photon beam. All x-ray absorption (XA) spectra were acquired using a retardation voltage of 150 V. The energy scale of the XA spectra was calibrated from a measurement of Au 4f XP spectra excited by first- and second-order light transmitted by the beamline's monochromator. The uncertainty of the calibration is less than 50 meV. A linear background was fitted to the pre-edge of the XAS data and then removed from the spectrum. To normalize the data with respect to beamline flux, the spectra were divided by the time-dependent storage ring beam current in each point and a beamline transmission spectrum measured with a photodiode mounted just before the end station. To normalize the sample response the XA spectra were also divided by an identically treated XA spectrum measured on a clean Au(1 1 1) substrate. Finally, each spectrum was normalized to the intensity at the highest-energy point of the spectrum in order to normalize to the continuum of states. XA spectra were recorded as a function of x-ray incidence angle θ, which is given with respect to the surface. The uncertainties of the measured intensities are estimated from the deviation depending on reference point for continuum of states normalization and precision in resonance energy.
3. Results and discussion
3.1. Halobenzene adsorption on Au(1 1 1)
We start by considering the adsorption of the halobenzenes on the Au(1 1 1) surface. We will analyze the orientation of the adsorbed compounds with respect to the Au(1 1 1) surface using XAS as well as the nature of the surface chemical species as a function of sample temperature. Particular focus will be on the question whether the halobenzenes dissociate on the surface or not.
3.1.1. XAS results.
In figure 1 angle-resolved C K-edge XA spectra of submonolayers of the halogenated benzenes and PA on Au(1 1 1) are shown (for details on the coverage see Experimental section). All spectra were acquired at a temperature of −160 °C. Also shown in the figure are the intensities of the C 1s → π*(LUMOphenyl) transition as a function of incidence angle for all compounds. A summary of the XAS assignments is shown in table 1. We will now discuss these data separately for each adsorbate.
Table 1. Energies of the XAS resonances and angles between the Au(1 1 1) substrate and phenyl ring of the compounds.
| Transition | hν (eV) | α (°) | |
|---|---|---|---|
| PA | C 1s → π*(Phenyl) | 285.1 | 15 ± 4 |
| C 1s → π*(Alkyl) | 285.9 | ||
| C 1s → σ*(C–H) | 287.4 | ||
| C 1s → π* | 288.0 | ||
| C 1s → π* + σ*(C–H) | 289.5 | ||
| C 1s → σ*(C–C) | 294 | ||
| CB | C 1s → π*(a2) | 285.2 | 5 ± 4 |
| C 1s → π(b1) | 286.7 | ||
| C 1s → σ*(Cl–C) | 285.2 | ||
| C 1s → π* | 286.7 | ||
| C 1s → σ*(C–H) | 285.2 | ||
| C 1s → σ*(C–C) | 286.7 | ||
| BB | C 1s → π*(a2) | 285.2 | 12 ± 4 |
| C 1s → σ*(Br–C) | 286.5 | ||
| C 1s → σ*(C–H) | 287.0 | ||
| C 1s → π(b1) | 288.0 | ||
| C 1s → π* + σ*(C–H) | 289.5 | ||
| C 1s → σ*(C–C) | 293.7 | ||
| IB | C 1s → π*(a2) | 285.1 | 10 ± 4 |
| C 1s → π* + σ* | 285.9 | ||
| C 1s → π* | 286.5 | ||
| C 1s → π* | 288.9 | ||
| C 1s → σ*(C–H) | 289.7 | ||
| C 1s → σ*(C–C) | 293.7 | ||

Figure 1. C 1s XAS data for submonolayer preparations of PA, CB, BB, and IB on a Au(1 1 1) surface. (a), (c), (e), and (g) show the angle-resolved XA spectra of PA, CB, BB, and IB. The incidence angle is given with respect to the surface. (b), (d), (f), and (h) show the corresponding intensities of the C 1s → LUMO transitions.
Download figure:
Standard image High-resolution imageFigure 1(a) contains the data for PA on Au(1 1 1). Resonances are found at 285.1 eV, 285.9 eV, 287.4 eV, 288.0 eV, 289.5 eV, and 294.0 eV photon energy. The energy of the resonance at 285.1 eV is similar to that of the C 1s → π*(1e2u) transition of benzene, which has been observed at 285 eV [28]. The line is therefore assigned to the C 1s → π*(LUMOphenyl) transition, while the resonance at 285.9 eV is assigned to the C 1s → π*(LUMOacetylene) transition in accordance with measurements on acetylene [29]. In principle, the LUMOphenyl resonance should contain fine structure due to the six chemically inequivalent C atoms in PA [30], but this structure is not resolved in our measurements. In accordance with XAS data obtained on a multilayer of PA on Cu(1 1 1) [31], Rh(1 0 0) [32], and Pt(1 1 1) [33] the resonance at 287.4 eV is assigned to a PA C 1s → σ*(C–H) transition. These studies attributed additional resonances at ~288.7 eV and 289.4 eV photon energy to a mixed high-energy C 1s → π*/ C 1s → σ*(C–H) resonance and a further high-energy C 1s → π* resonance. In contrast, no resonance is found at 288.7 eV in the present data, but the resonance at 288.0 eV has the distinct angular dependence of a C 1s → π* transition. In agreement with the finding reported in literature, the resonance at 289.5 eV is assigned to a C 1s → π* transition, but with a contribution of the C 1s → σ*(C–H) transition, as seen from the angular dependence. Finally, the resonance at 294.0 eV is assigned to a C 1s → σ*(C–C) transition in view of its energy which is similar to that found for the corresponding resonance of benzene [34].
Figure 1(b) shows the height of the C 1s → π*(LUMOphenyl) transition for the different light incidence angles. Since the height of the resonance is easier to determine than its intensity, which would require a deconvolution of the peak, it is here taken as a good approximation to the latter. Assuming a sixfold symmetry of the Au(1 1 1) surface, which implies the existence of three physically identical rotational domains, and assuming that all phenyl groups have the same angle to the surface, one can fit the data as outlined in [35]. In the present case the curve fit yields an angle of (15 ± 4)° between the plane of the phenyl group and the Au(1 1 1) surface.
Figure 1(c) contains the angle-resolved XA spectra for a submonolayer of CB/Au(1 1 1). Clearly identifiable resonances are found at 285.2 eV, 286.7 eV, 287.8 eV, 289.0 eV, 290.3 eV, and 294.1 eV photon energy. The appearance of the low-energy part of the spectrum in the 285–287 eV photon energy range is related to the presence of the Cl heteroatom, the introduction of which reduces the molecular symmetry from D6h to C2v. The change of symmetry will splits the doubly degenerate π*(e2u) orbital of benzene into a2 and b1 components [14, 36, 37], where the a2 orbital is spread over the five non-Cl-bonded carbon atoms—i.e. it does not have any weight on the Cl-bonded carbon atom—and the b1 orbital with much weight on the Cl-neighbouring C atom. The energy of the C 1s level of this C atom can be expected to be chemically shifted towards higher binding energy due to the high electronegativity of Cl, which should also increase the XAS transition energy. Therefore, the resonance at 286.7 eV is assigned to the C 1s → π*(b1) transition, while the low-energy peak at 285.2 eV is due to the C 1s → π*(a2) transition. At 287.8 eV photon energy a resonance is identifiable in the spectra measured at incidence angles of θ = 90° and 70°. The angular dependence of this resonance corresponds to that of a σ* orbital. In an XAS study of CB adsorbed on the Cu(1 1 1) surface, Yang et al [36] found a resonance in this energy regime and attributed it to a transition into an antibonding σ*(C–Cl) orbital, an assignment which we follow here, based on the observed angle dependence. The line at 289 eV is assigned to a higher-lying C 1s → π* resonance, while the resonances at 290.3 eV and 294.1 eV are assigned to C 1s → σ*(C–H) and σ*(C–C) transitions.
As for PA, we have plotted the intensity for the lowest π* resonance—the π*(a2) resonance—in figure 1(d) to allow an identification of the angle of the molecule with respect to the surface. A curve fit based on the same assumptions as before indicates a low tilt angle of (5 ± 4)° of the phenyl group with respect to the surface. Thus, the CB molecules lie very flat on the Au(1 1 1) surface in comparison to PA.
Figure 1(e) shows the angle-resolved C K-edge XA spectra of BB/Au(1 1 1). Resonances are found at 285.2 eV, 286.5 eV, 287.0 eV, 288.0 eV, 289.5 eV, and 293.7 eV photon energy. In accordance with data on multilayers of BB on Pt(1 1 1) [37] the resonances can be assigned as follows: As for CB, the benzene C 1s → π*(e2u) resonance is split into the C 1s → π*(a2) and C 1s → π*(b1) components at 285.2 eV and 288.0 eV photon energy, respectively. Hence, the dependence of the π*(b1) energy on the electronegativity of the heteroatom is further confirmed. Also in agreement with the assignments for CB, the line at 286.5 eV photon energy is assigned to a C 1s → σ*(C–Br) transition [37], while the resonance at 287.0 eV photon energy is due to a C 1s → σ*(C–H) transition. The line at 289.5 eV is partly assigned to a higher-lying C 1s → π* transition due to its characteristic angle behaviour. However, at the same energy also a C 1s → σ* resonance is found as is obvious from the intensity in the spectra obtained at θ = 90°. This line is assigned to a C 1s → σ*(C–H) transition in accordance with what is discussed above. The last resonance at 293.7 eV photon energy is assigned to the C 1s → σ*(C–C) transition. Figure 1(f) shows the intensity of the π*(a2) resonance for the different acquisition angles. The fit reveals that the angle between the surface and the benzene ring is (12 ± 4)°.
Finally, figure 1(g) shows the angle-resolved XAS data of IB/Au(1 1 1). Resonances are observed at 285.1 eV, 285.9 eV, 286.5 eV, 288.9 eV, 289.7 eV, and 293.7 eV photon energy. Again, the lowest-energy resonances at 285.1 eV and 285.9 eV photon energy are assigned to the C 1s → π*(a2) and C 1s → π*(b1) transitions, which together form the C 1s →π*(LUMOphenyl) peak. The assignment is in agreement with an earlier study of IB/Cu(1 1 1) [36]. The difference in energy between the π*(a2) and π*(b1) components is considerably smaller in comparison to the shift introduced by Cl and Br (0.75 eV as compared to 1.5 eV/1.3 eV). The decrease in splitting is easily explained from the lower C 1s binding energy of the C atom neighbouring the heteroatom, which is due to the smaller electronegativity of iodine compared to that of chlorine. An additional broad resonance is found at 285.9 eV photon energy, especially visible in the θ = 90° spectrum. Due to its width and angle dependence this resonance is assigned to a C 1s → σ*(I–C) transition similar to that of CB [36] and BB. The resonance at 286.5 eV photon energy is attributed to a C 1s → π* transition due to the apparent angle dependency. This resonance is not reported in previous studies of IB/Au(1 1 1), although it is present in the XA spectrum of a multilayer of IB adsorbed on the Au(1 1 1) surface (see figure S1 in the supplementary information (stacks.iop.org/JPhysCM/29/444005/mmedia)). Hence, it is considered to be an intrinsic π* resonance of IB. The resonance at 288.9 eV photon energy is assigned to the C 1s → π*(b1) transition in accordance with previous studies [14]. The resonances at 289.7 eV and 293.7 eV are assigned to C 1s → σ*(C–H) and σ*(C–C) transitions, respectively. As for the other halogenated benzenes, figure 1(h) shows the intensity of the C 1s → π*(a2) intensity as a function of x-ray incidence angle. Making the same assumptions as above, a phenyl tilt angle of (10 ± 4)° is found for IB/Au(1 1 1).
XA spectra on multilayers of all molecules were also measured (not shown). In these spectra no angle dependence of the XAS signal is seen. Hence, the molecules in the multilayers do not bind in a preferred direction and are randomly ordered with respect to the Au(1 1 1) support. The loss of order is attributed to weak intermolecular interactions.
3.1.2. XPS results.
Figure 2 shows the XP spectra of the submonolayer preparations of PA, CB, IB, and BB on Au(1 1 1). All spectra were acquired at a temperature of −160 °C, and a summary of the assigned binding energies is shown in table 2.
Table 2. Summary of the XPS, TDXPS, and TDRXPS results.
| XPS | TDXPS | TDRXPS | |||||||
|---|---|---|---|---|---|---|---|---|---|
| C 1s (eV) | X (eV) | T (°C) | Main C 1s (eV) | X (eV) | T (°C) | C 1s (eV) | X (eV) | ||
| PA | Multilayer | 283.9 | < −122 | 284.4 | — | ||||
| Monolayer | −122 to −15 | 284.0 | — | ||||||
| Submonolayer | > −15 | 284.0 | — | ||||||
| CB, X = Cl 2p3/2 | Multilayer | 284.0 | 199.7 | < −120 | 284.4 | 200.4 | |||
| Monolayer | −120 to −34 | 284.1 | 199.8 | < −60 | 284.2 | 199.9 | |||
| Submonolayer | > −43 | 283.9 | — | > −60 | 283.8, 283.9 | ||||
| BB, X = Br 3d5/2 | Multilayer | 284.0 | 70.6 | < −103 | 284.5 | 70.2 | < −20 | 284.0 | 69.8 |
| Monolayer | −103 to −30 | 284.1 | 69.7 | ||||||
| Submonolayer | > −30 | — | — | ||||||
| IB, X = I 4d5/2 | Multilayer | 284.1 | < −96 | 284.6 | 50.8 | ||||
| Monolayer | −96 to −15 | 284.1 | 50.3 | < −5 | 284.2 | 50.4 | |||
| Submonolayer | > −15 | 283.9 | 48.9 | > −5 | 283.8, 284.0 | ||||
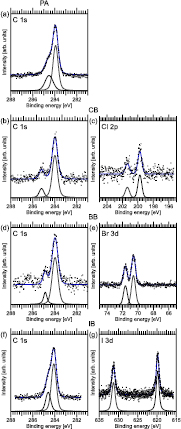
Figure 2. XP spectra of the submonolayer preparations. (a) C 1s spectrum of PA, (b) C 1s and (c) Cl 2p spectra of CB, (d) C 1s and (e) Br 3d spectra of BB, and (f) C 1s and (g) I 3d spectra of IB.
Download figure:
Standard image High-resolution imageStarting with the C 1s XP spectrum of PA in figure 2(a), a single peak with a clearly discernible shoulder on the high-binding energy side is observed. From peak deconvolution by least-square curve fitting, the main component is found to have a binding energy of 283.9 eV, which corresponds to the expected C 1s energy of the sp2-hybridized C atoms in PA. The shoulder component at 284.5 eV is due to the sp-hybridized carbon atoms in the acetylene moiety. The intensity of the high binding energy component is one third of the total C 1s signal, which is the ratio expected from the molecular stoichiometry.
Figures 2(b), (d) and (f) show the C 1s spectra of the CB, BB, and IB submonolayers adsorbed on the Au(1 1 1) surface. In all three cases two components are observed: the main component at around 284.0 eV is due to the five out of six sp2-hybridized carbons in the phenyl moieties which are bonded to other C and H atoms, while the high-binding energy peak at 285.2/284.9/284.6 eV (CB/BB/IB) is attributed to the carbon atom bonded to the chlorine/bromine/iodine heteroatom. The intensity ratio between the two components is 1:6/1:5/1:4 (CB/BB/IB), in relatively good, but not perfect agreement with the stoichiometry.
Figures 2(c), (e) and (g) show the corresponding Cl 2p/Br 3d/I 3d spectra. In all three cases a single doublet is sufficient to explain the lineshapes. The binding energies of the doublet components are 199.7 eV and 201.4 eV for the Cl 2p3/2 and Cl 2p1/2 lines in CB, 70.6 eV and 71.6 eV for the Br 3d5/2 and Br 3d3/2 lines in BB, and 619.8 eV and 631.3 eV for the I 3d5/2 and I 3d3/2 lines in IB, respectively.
The Cl 2p3/2 binding energy reported for atomic Cl/Au(1 1 1) is ~197.4 eV [38, 39], quite much lower than what is found here. Hence, it is concluded that CB adsorbs non-dissociatively at the liquid nitrogen temperature employed here. The conclusion is also supported by the shape of the C 1s spectrum in figure 2(b) as two distinct C 1s species are found.
The situation is the same for the adsorption of BB on the Au(1 1 1) surface at liquid nitrogen temperature: at 70.6 eV this Br 3d binding energy is higher than what has been reported previously for Br involved in C–Br bonds (69.7 eV [40]), but also significantly distinct from the energy found for Br–Au (67.8 eV) [40]. Therefore, these components are assigned to the Br–C species of BB, which thus adsorbs intact on the Au(1 1 1) surface at −160 °C.
Likewise, the I 3d binding energy for IB is higher than what would be expected for the adsorption of atomic I on Au(1 1 1). Even though the values found here are in slight disagreement with [14] with respect to absolute energy and separation of the components, we nevertheless conclude on a non-dissociative bonding of IB to the Au(1 1 1) surface at liquid nitrogen temperature; the disagreement is instead attributed to experimental uncertainties.
Thus, all halogenated benzenes tested here adsorb non-dissociatively on the Au(1 1 1) surface at liquid nitrogen temperature. The C 1s binding energy correlates well with the electronegativity of the heteroatom (3.0, 2.8, and 2.5 for Cl, Br, and I, respectively), and the chemical shifts in the C 1s spectra can thus be explained in the standard initial state picture.
3.2. TDXPS results
Figures 3 and 4 show the C 1s and halogen (Cl 2p/Br 3d/I 4d) TDXP spectra obtained on pure PA, CB, BB, and IB multilayers adsorbed on the Au(1 1 1) support (for coverages and heating rates, see the Experimental section). A summary of the results is found in table 2. We will start our discussion with the C 1s spectra.
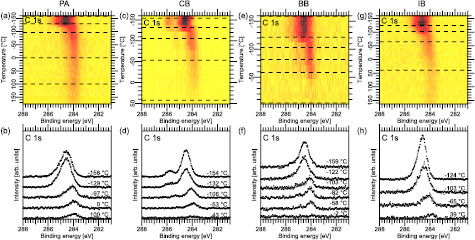
Figure 3. C 1s TDXP spectra. (a), (c), (e), and (g) C 1s image plots obtained on multilayer preparations of PA, CB, BB and IB on Au(1 1 1). (b), (d), (f), and (h) show selected C 1s spectra marked by the dashed lines in the corresponding surface plot.
Download figure:
Standard image High-resolution image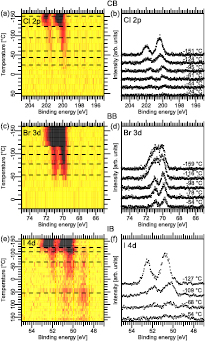
Figure 4. Panels (a), (c), and (e) show image plots of the Cl 2p, Br 3d, and I 4d TDXP spectra. Panels (b), (d), and (f) show selected spectra as marked by the dashed lines in (a), (c), and (e).
Download figure:
Standard image High-resolution imageFigures 3(a), (c), (e) and (g) show image plots of all C 1s TDXP spectra. In these plots three general trends can be identified: (i) a region with a multilayer that desorbs rapidly, as marked by a rapid, large drop in intensity, and a downshift in binding energy at −122 °C, −120 °C, −103 °C, and −96 °C for PA, CB, BB, and IB (figures 3(a)/(c)/(e)/(g)), respectively. (ii) After the multilayer is desorbed, a monolayer coverage remains where a slight continuous downshift in binding energy is seen in the C 1s spectra until about −15 °C for PA and IB, −34 °C for CB, and −30 °C for BB. At these temperatures the samples enter the (iii) dissociation/desorption region, where the C 1s intensity decreases slowly. At the end of the temperature run a C 1s signal remains for PA, IB, and CB, but only a minute amount is left for BB. This is an indication that BB mostly desorbs in intact form.
In more detail, figure 3(b) shows selected XP spectra of PA/Au(1 1 1) from the TDXPS series in figure 3(a). The spectrum acquired at −158 °C shows a slightly asymmetric peak with a maximum at 284.5 eV binding energy. This peak can be deconvoluted by fitting with two sets of two peaks each (see figure S2 in the supplementary information) corresponding to photoemission from the monolayer and multilayer (see table 2). Upon heating there is an initial increase in intensity in the spectrum recorded at −129 °C. This increase is assigned to thermal drift during heating. Apart from that, the spectral shape remains the same until −97 °C, at which temperature only the monolayer component remains. At higher temperature an asymmetric peak remains at 283.9 eV binding energy, assigned to a persisting submonolayer of PA. Clearly, this species is adsorbed more strongly compared to the majority of the PA adsorbates. Hence, the persisting submonolayer is assigned to PA bound to a minority adsorption site, e.g. defects, terrace steps, or elbows of the herringbone reconstruction on the Au(1 1 1) surface. Determination of the exact adsorption site would require further experiments, e.g. by means of scanning tunnelling microscopy.
Selected XP spectra from the CB, BB and IB TDXPS series are shown in figures 3(d), (f) and (h). For all compounds the main C 1s component is found at 284.5–284.6 eV binding energy with the addition of a shoulder component at the high binding energy side, which is not resolved in the IB case. After entering the dissociation/desorption temperature regime, the main C 1s components are found at about 284 eV binding energy in agreement with the corresponding submonolayer spectra in figure 2. At higher temperature the shoulder component vanishes for CB (see the spectrum at −53 °C in figure 3(d)), and in the IB case the main C 1s component asymmetry is reduced and the peak shifts downward in binding energy. This is in contrast to the behaviour of the C 1s line of BB, which only is reduced in intensity, but does not shift anymore in binding energy. For both CB and IB the C 1s component of the final product is found at 283.9 eV binding energy, i.e. at an energy where the signal of sp2-hybridized carbon is expected. Since the C–Cl shoulder is not present in the final spectrum of the CB series, and since the asymmetry of the final IB C 1s peak has largely disappeared, the spectrum at highest temperature is assigned to biphenyl (BP) for both CB and IB. BP is a result of the homocoupling reaction between the phenyl radicals which remain after C-halogen bond dissociation [16]. This signal is not found in the BB case, and thus we conclude that BB does not dissociate on the Au(1 1 1) surface.
Figure 4 shows the Cl 2p, Br 3d, and I 4d TDXP spectra acquired simultaneously as the corresponding C 1s TDXP spectra in figure 3. Figures 4(a), (c), and (e) contain image plots with all Cl 2p, Br 3d, and I 4d spectra measured during the heating run, while figures 4(b), (d) and (f) show selected spectra marked by the dashed lines in the image plots.
The image plots in figures 4(a), (c), and (e) exhibit the same trends as observed in the C 1s spectra, see figures 3(c), (e), and (g). At low temperature a well-resolved doublet is seen in the Cl 2p and I 4d spectra, whereas for Br 3d a single, broad component is observed. At about −120 °C there is a downshift in binding energy and loss in intensity in the I 4d, Cl 2p, and Br 3d core level spectra, which is consistent with desorption of the halobenzene multilayers. Additionally, a new component appears in the I 4d image plot on the low-binding energy side at an energy typical of an atomic I–Au species. In the Br 3d spectrum a doublet is clearly resolved in the temperature regime above −120 °C. Hence, in accordance with what is seen in the C 1s spectra, the transition from the multilayer to monolayer signal is obvious for all three halobenzenes. After reaching −24 °C (−30 °C) the doublet vanishes in the Cl 2p and Br 3d spectra. In contrast, only the monolayer I 4d doublets vanishes at −15 °C, while the low-energy doublet persists up to the highest temperature.
Using the above assignments all halogen spectra are fitted using doublets for the multilayer, monolayer and, in the case of IB, atomic I–Au(1 1 1) species. The integrated area of these doublets is plotted in figures 5(a), (b) and (c) as a function of temperature. Clearly, the atomic I–Au(1 1 1) species (figure 5(c)) remain on the surface until the end of the heating run. This is clear proof of IB dissociation on the Au(1 1 1) surface, as already indicated by the evolution of the C 1s spectra. In contrast, the halogen core level signals of CB and BB vanish at 0 °C (CB) and −25 °C (BB). The Br 3d signal disappears at the same temperature as the C 1s signal vanishes, which implies that BB desorbs in intact form from the Au(1 1 1) substrate, as was already concluded above. The Cl 2p signal vanishes at about −40 °C, but a C 1s signal remains. Therefore, CB dissociates on the Au(1 1 1) surface during the temperature run. In line with this, upon dissociation the formation of an atomic Cl–Au(1 1 1) species would be expected, visible in the Cl 2p spectra. The absence of a Cl 2p signal is unexpected, especially since Cl2 adsorbs dissociatively on Au(1 1 1) [20] and desorbs first at 370 °C as Cl2 and as atomic Cl at 520 °C [38]. The absence cannot be explained by a low signal either, since the subshell Cl 2p photoionization cross section at the employed photon energy is considerably higher than that of C 1s. Even though there are six times as many C atoms as Cl on the surface, the signal should not be negligible, and, moreover, summation of the last four spectra do not show any Cl 2p signal (not shown). It has been shown that H reacts with Cl adsorbed on the Au(1 1 1) surface via the Langmuir–Hinshelwood mechanism [41] after which HCl desorbs from the surface at sufficiently high temperature. The desorption temperature of HCl can be estimated by a Redhead analysis using a pre-factor of 1013 and a barrier towards desorption of 0.22 eV [42]. The thus estimated approximate desorption temperature is −185 °C, which would agree with the above data. It is, however, unlikely that any H originates from C–H bond breaking, since this reaction is not catalysed by the Au(1 1 1) surface [43]. Cl could potentially react with H dissolved in the Au(1 1 1) single crystal, but we do not consider this possibility particularly likely.

Figure 5. Integrated areas of the monolayer and multilayer components obtained from the TDXPS data for (a) CB, (b) BB, (c) and IB. (c) also shows the evolution of the atomic I–Au(1 1 1) species. The graphs are normalized to unity at −160 °C. Panels (d)–(g) show TPD-like spectra for PA, CB, BB, and IB obtained from the integrated intensities of the C 1s (black) and halogen (blue) core level lines.
Download figure:
Standard image High-resolution imageInstead, we consider the influence of adsorption geometry on the surface reaction. From the XAS measurements it is clear that CB adsorbs in a very flat geometry, induced by the interaction between the phenyl moiety and Au surface. Thus, two CB molecules could interact through the Cl heteroatoms, which subsequently forms Cl2 and two Ph–Au species which react to BP, while the Cl2 is released directly into vacuum. While we cannot confirm this hypothesis at present, this is the most likely explanation at hand. The hypothesis would have to be confirmed in future experiments using e.g. mass spectrometry.
Figures 5(d)–(g) show TPD-like spectra created from the TDXPS data. The spectra are the negative of the derivative with respect to temperature of the integrated surface signal of the C 1s and halogen spectra. Figure 5(d) shows the desorption peak of PA, while figures 5(e)–(g) show the desorption features as found from the C 1s (black) and halogen core levels (blue) (Cl 2p, Br 3d, and I 4d) for CB, BB, and IB, respectively. Starting the discussion with PA, the main desorption peak is found at −120 °C in agreement with previous studies [13]. The desorption temperature points to the formation of diphenyl diacetylene (DPDA) [14] as a result of PA homocoupling. While DPDA thus should be present on the sample at temperatures lower than −120 °C, its spectral fingerprint in the C 1s core level line is virtually impossible to differentiate from that of PA. We thus cannot provide a final confirmation of DPDA formation, but consider the temperature-based evidence strong.
Turning now to the halogenated benzenes, the main desorption features of CB and BB are found at −125 °C, and −116 °C, respectively. The Cl 2p and Br 3d-derived desorption rates are in close agreement with the C 1s-derived ones, in particular for BB. This indicates multilayer desorption, in good agreement with the C 1s TDXPS assignment. In addition, a small, wide feature is seen in both BB spectra in figure 5(f). This feature is located at a temperature of −46 °C, which agrees with BB monolayer desorption. In contrast, the IB desorption peaks exhibit a different behaviour. Here, in the C 1s desorption rate two distinct peaks are found at −116 °C and −95 °C. In the corresponding I 4d spectrum only one major desorption peak is found at −127 °C. Clearly, the desorption mechanism of IB from Au(1 1 1) contains multiple channels, and we assign the difference in desorption rates derived from the C 1s and I 4d XP spectra to C–I bond dissociation: the first C 1s TPD peak and the I 4d TPD peak are assigned to multilayer desorption, while the peak at −95 °C is assigned to a C species desorbing from the Au(1 1 1) surface subsequent to C–I bond dissociation. Here, no peak is seen in the I 4d derived spectrum as the atomic I–Au(1 1 1) species do not desorb at these temperatures.
The desorption energies can be approximated to a 30% accuracy using a Redhead analysis assuming an exponential pre-factor of 1013, first order desorption kinetics, and using the temperatures obtained from a Gaussian fitted to the main C 1s derived desorption peaks. This yields desorption energies for multilayer desorption energies of 44 kJ mol−1 (PA), 40 kJ mol−1 (CB), 45 kJ mol−1 (BB), and 49 kJ mol−1 (IB), and 63 kJ mol−1 for the BB monolayer desorption.
From the above results we conclude that the C–I bond in IB dissociates and there are strong indications even for dissociation of the C–Cl bond in CB. In contrast, there is no sign of C–Br bond dissociation in BB. The bond dissociation energies are high for all three compounds [44] and cannot explain the observed differences, especially since the dissociation energy trend is C–Cl > C–Br > C–I. As was determined above (table 1), what differs between the three compounds is their orientation with respect to the surface. At 5° CB has a very small tilt angle, which seems to favour dissociation, likely due to a weakened chlorine-phenyl bond due to the stronger interaction of the phenyl moiety with the surface. BB exhibits a comparatively large tilt, 15°, which disfavours dissociation. With a 10° tilt angle IB is an intermediate case, but the tilt angle seems to allow a sufficiently strong interaction between the surface and the phenyl moiety to promote dissociation; the C–I bond is also the weakest. A striking difference between CB and IB is that the split-off iodine atoms remain at the surface, while the chlorine atoms do not. Obviously the mechanisms of dissociation on the Au(1 1 1) surface are different for the two compounds.
3.3. TDRXPS results
Figure 6 presents the C 1s spectra acquired during the TDRXPS measurements. In these experiments PA was dosed onto the Au(1 1 1) surface pre-dosed with halobenzenes, and then the sample was heated and XP spectra were acquired (for heating rates and coverages, see the Experimental section). A summary of the TDRXPS results is presented in table 2.
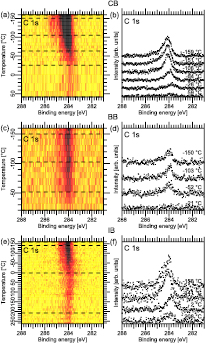
Figure 6. C 1s TDRXPS spectra for PA dosed on (a) CB, (c) BB, and (e) IB. Panels (b), (d), and (f) show selected spectra from (a), (c), and (e) as marked by the dashed lines.
Download figure:
Standard image High-resolution imageFigures 6(a), (c), and (e) show image plots of all C 1s spectra acquired during the TDRXPS measurements for PA on CB/Au(1 1 1), BB/Au(1 1 1), and IB/Au(1 1 1), respectively. Apart from a loss of intensity with increasing temperature, two trends can be identified: (i) in the CB and IB case there is a downshift of the photoemission lines in binding energy until roughly −26 °C for CB and room temperature for IB, after which the spectral features shift slightly upwards in binding energy; (ii) in the BB case there is no change in binding energy at all until the C 1s line vanishes at about −20 °C. Considering the selected spectra in figures 6(b), (d), and (f) for PA on CB, BB, and IB, it is clear that the energy separation of the main C 1s component from that of the C atom bound to the halogen heteroatom is less pronounced compared to what is seen for the halobenzene-only preparation in the spectra in figure 3; moreover, the separation is more clearly seen in the CB and BB spectra than for IB. In all three preparations multiple C species are present, and we can conclude that PA is co-adsorbed with all halogenated benzenes. For both CB and IB, the lowest-energy line is located at 283.8 eV binding energy. This component was not seen in the spectra of the halobenzene-only preparations and is thus assigned to the interaction between CB/IB and PA. Upon further heating, the main C 1s component shifts to 284 eV binding energy for both CB and IB, while for BB no C 1s signal is found.
In order to assign the nature of the low-binding energy species, the most common reaction products between CB and IB with PA need to be considered. For IB + PA over Au(1 1 1) three main products have previously been reported: BP, DPDA, and diphenylacetylene (DPA) [14]. From TDXPS BP was above found to have a photoemission line with a binding energy of 283.9 eV, which is not observed here. DPDA desorbs from the surface at −120 °C (see figure 5), and no photoemission line at 283.8 eV was found in those measurements. Hence, both BP and DPDA are excluded as the species that gives rise to the low-binding energy component. Instead we assign the component at 283.8 eV binding energy in the IB and CB TDRXPS spectra to DPA. This leads us to conclude that both IB and CB are active for the Sonogashira cross-coupling reaction over Au(1 1 1), whereas BB is not since no DPA feature is seen in the BB C 1s spectra.
Continuing with the halogen core levels, figure 7 shows the Cl 2p, Br 3d, and I 4d spectra acquired during the TDRXPS measurements as image plots in panels (a), (c), and (e) and selected spectra in (b), (d) and (f). In all three cases a single doublet is seen at the submonolayer binding energies of 199.9 eV (Cl 2p3/2)/69.8 eV (Br 3d5/2)/50.4 eV (I4d5/2) up to temperatures of −66 °C (CB), −30 °C (BB), and −5 °C (IB) in agreement with the monolayer desorption temperatures, see table 2. While no shift in binding energy is seen prior to desorption for IB and BB, for CB there is a slight downshift of the Cl 2p signal, which is assigned to the strong coverage dependence of the CB lines seen in the TDXPS measurements. The presence of the submonolayer halobenzene features is a clear proof of halobenzene coadsorption with PA.
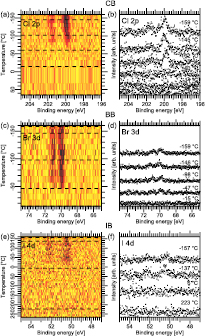
Figure 7. TDRXPS spectra. (a) Cl 2p, (c) Br 3d, and (e) I 4d data as image plots. (b), (d), and (f) shows selected spectra marked by the dashed lines.
Download figure:
Standard image High-resolution imageThe PA + BB measurements warrant further discussion. As can be seen from the spectra in figures 6 and 7, both the C 1s and Br 3d signal disappear at about −40 °C. Thus, no adsorbates remain on the Au(1 1 1) surface. As seen from the TDXPS measurements in figures 3 and 5, PA alone forms DPDA and, moreover, a submonolayer of PA persists on the surface up to at least 150 °C. In this submonolayer PA is bound more strongly to the surface at minority adsorption sites. A plausible explanation for the absence of PA on the surface at temperature above −40 °C when PA + BB are co-dosed would be that the prime adsorption site of BB is the minority adsorption site of PA (i.e. defects, terrace steps, or herringbone elbows). The pre-adsorbed BB (0.4 ML) would block the sites and the less strongly bound PA would desorb intact. Alternatively, we cannot exclude the homocoupling reaction towards DPDA, which would desorb already at −120 °C [13]. In either case, since no temperature-dependent changes are observed in neither the Br 3d nor C 1s spectra, BB does not participate in the reaction.
With respect to the TDRXPS reaction of IB with PA, we find that no atomic I–Au(1 1 1) species is present on the surface. Since Au(1 1 1) greatly facilitates C–I bond cleaving (see the TDXPS measurements in figure 4) this absence is unexpected. The Sonogashira cross-coupling reaction mechanism provides, however, an explanation: in order for cross-coupling between IB and PA to take place, the C–H bond on the acetylene moiety must be cleaved, a reaction which is generally not catalysed by Au(1 1 1). The presence of atomic I–Au(1 1 1) might facilitate the cleaving and lead to the formation of HI, which would desorb from the Au(1 1 1) surface. The remaining phenyl- and phenylacetylenyl groups would form DPA. This scheme is also valid for the CB case. Therefore, the absence of atomic halogen species on the Au(1 1 1) surfaces is an indication of the occurrence of a Au(1 1 1)-catalysed Sonogashira cross-coupling reaction between PA and CB/IB.
From the results of the above TDRXPS experiments we can conclude that both CB and IB undergo a Sonogashira cross-coupling reaction with PA to DPA with a characteristic C 1s photoemission peak at 283.8 eV binding energy. The reaction proceeds via C–Cl/C–I bond cleavage followed by HCl/HI formation. In contrast, a Au(1 1 1)-catalysed Sonogashira cross-coupling reaction between BB and PA does not take place, which is paralleled by a lack of BB dissociation on the Au(1 1 1) surface.
3.4. Halobenzene and PA adsorption and reaction at ambient pressure
3.4.1. APXPS results: individual compounds.
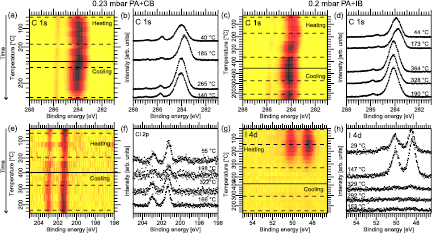
APXPS was used to study the reaction of PA with CB and IB under in situ conditions, i.e. at relevant pressure and temperature. Since in particular the C 1s APXP spectra represent a rather complex convolution of lines from PA on the one hand and CB/IB on the other, we start by discussing the temperature-dependent APXP spectra of the individual compounds recorded at a pressure of 0.2 mbar. The heating rates are summarized in the experimental section, and the resulting spectra are plotted in figure 8. All plots are divided into two sections: (i) the top part was acquired during heating of the Au(1 1 1) crystal, while (ii) the bottom part was measured as the sample cooled in the vapour.

Figure 8. APXP spectra of the individual compounds. Panels (a), (c) and (e) show image plots of the C 1s spectra acquired for PA, IB and CB. (b), (d), and (f) show selected C 1s spectra as marked by the dashed lines in the image plots. (g) and (i) show image plots of the I 4d and Cl 2p spectra of IB and CB. (h) and (j) show the corresponding selected spectra.
Download figure:
Standard image High-resolution imageWe start our discussion with the C 1s image plots and selected spectra in figures 8(a) and (b) for PA, (c) and (d) for CB, and (e) and (f) for IB. For PA and CB the image plots show two distinct peaks, while only a single peak is seen for IB. At room temperature the PA, CB, and IB main peaks are located at 283.9 eV, 284.0 eV, and 284.2 eV binding energy, in agreement with monolayer or submonolayer coverages of PA, CB, and IB (see figure 2 and table 2). The main peak in the PA spectrum is asymmetric due to the presence of the acetylene component at 284.5 eV. In the CB spectrum the C–Cl component is seen as a low-energy shoulder of the peak at ~285.6 eV (see below), while the C–I component is found at 284.7 eV in the IB spectrum. Hence, we observe adsorption of not more than a single adsorbate layer, when the Au(1 1 1) surface is exposed to 0.2 mbar of PA, CB, or IB at room temperature.
The PA and CB spectra exhibit high binding energy peaks at 285.6 eV binding energy for PA and 285.7 eV for CB. These lines are assigned to the PA and CB vapour signals. In contrast, at room temperature no gas phase peak is seen for IB. This initial absence of the IB gas phase is attributed to thermal drift during the heating, which reduces the distance between sample and entrance aperture of the electrostatic lens system of the electron energy analyser [45], leading to a reduced pressure over the surface.
With increasing temperature the PA C 1s surface peaks shifts to slightly higher binding energy. Also the CB C 1s surface lines shift towards higher energy, albeit first after an initial downshift of the main component to 283.9 eV, which is accompanied by a reduction in intensity of the C–Cl component. These observations are in line with the formation of BP at around 150 °C. Returning to the subsequent upshift of the C 1s lines of both PA and CB, they come along with an increase in asymmetry and width and a simultaneous upshift of the gas phase C 1s lines. The gas phase component shift shows that the surface work function changes as a result of the formation of a carbon structure at the surface of unclear exact nature. In contrast, due to desorption, the C 1s signal of IB greatly diminishes at temperatures higher than room temperature, and only a minute signal persists. At about 340 °C the IB C 1s signal, however, increases again and a component is seen at 284.5 eV binding energy, an energy which is higher than that of the room temperature species. Instead, it is near the binding energy assigned to the IB multilayer (see table 2). Multilayer condensation at elevated temperature seems highly unlikely, though (see also below). Hence, we conclude that also IB reacts to an unknown carbon surface structure at elevated temperature. During the cooling cycle no major shifts in binding energy are seen; a slight increase in asymmetry of the main C 1s component, indicative of further reaction of the carbon surface structure, and the appearance of a component at 286.3 eV binding energy are, however, apparent in the IB spectra. The binding energy shift between this new component and the main C 1s line is similar to that between the surface species of CB and PA on the one hand and their gas phase components on the other. Hence, the signal is assigned to IB in the gas phase.
From the discussion of the C 1s spectra obtained during exposure of the Au(1 1 1) surface to 0.2 mbar of PA, CB, and IB we can conclude that all three compounds adsorb non-dissociatively on the Au(1 1 1) surface at room temperature; for IB this picture will, however, be modified slightly below. Upon heating CB reacts to BP at moderate temperature, while IB desorbs. In all cases unknown carbon surface structures are formed at higher temperature.
Further understanding is achieved from consideration of the halogen (Cl 2p and I 4d) core levels. Figures 8(g) and (i) show image plots of the halogen lines, while (h) and (j) show the corresponding selected spectra. At room temperature two overlapping doublets are seen in both cases, corresponding to a majority and a minority species. The Cl 2p3/2 and I 4d5/2 components of the majority species are observed at 199.7 eV and 49.2 eV binding energy, respectively. The former is assigned to the monolayer or submonolayer signal of CB consistent with the assignment based on the C 1s spectra, while the latter is due to an atomic I–Au(1 1 1) species, in accordance with our TDXPS data. The Cl 2p3/2 and I 4d5/2 components of the minority species are hidden by the signals of the more intense majority signal; their positions can be identified reliably from curve fitting, and their locations are 201.2 eV and 50.3 eV binding energy. In accordance with its binding energy (see TDXPS results above) the I 4d minority species is assigned to a (sub-)monolayer of IB. Both the CB and IB (sub-)monolayer features disappear upon heating to elevated temperature.
The Cl minority species at 201.2 eV does not have a binding energy which has been identified previously. The signal persists throughout the entire heating and cooling cycle, but shifts towards higher binding energy in the cooling half-cycle. This behaviour, its persistence throughout the entire heating/cooling cycle and its shift, as well as its relative high binding energy let us assign the doublet to the CB gas phase signal; the shift during the cooling cycle is given rise to by the surface modification in the form of a carbon-containing overlayer as reported above and a concomitant work function shift.
Just above 340 °C the atomic I–Au(1 1 1) species desorbs and the corresponding doublet disappears from the spectra. This is clear evidence of that the C 1s signal at this temperature does not originate from an IB multilayer. As the cooling cycle starts two additional I 4d doublets are seen. The first doublet has its I 4d7/2 component located at 51 eV binding energy, which correspond to an IB multilayer. Thus, IB is seen to re-condense on the surface as the temperature is lowered. The high-energy component, located at 52.5 eV binding energy, is assigned to gas phase IB, based on the observed core level shift. Its appearance is simultaneous with the appearance of the IB vapour line in the C 1s spectra and can be attributed to an enlarged distance between sample and analyser aperture. This observation further reinforces the assignment.
From the APXPS measurements it is concluded that there is a large degree of C–I bond cleavage up to a temperature of 340 °C. In fact, the surface is nearly completely covered by atomic I as seen from the lack of C 1s signal. It seems likely that the phenyl radicals form BP, which desorbs from the surface. As I desorbs from the surface, an unknown carbon structure is formed, and IB condensates on top of this structure when the temperature is lowered below 250 °C. However, the atomic I–Au(1 1 1) species is not found and thus the Au(1 1 1) surface has become inactive for C–I bond scission.
Both PA and CB produce a carbon surface structure at higher temperature, and no atomic Cl–Au(1 1 1) species is seen, in agreement with the TDXPS measurements. However, the large C signal is indicative of C–Cl bond scission. Interestingly, CB does not re-condensate on top of this structure, as seen from the absence of a CB multilayer signal during the cooling half-cycle. Possibly, we did not measure at sufficiently low temperature; alternatively, the C structure inhibits CB adsorption.
3.4.2. APXPS results: Sonogashira coupling conditions.
Using the above discussion as a basis, we continue with the APXPS data obtained at reaction conditions. A mixture of PA with either CB or IB was dosed onto the Au(1 1 1) surface at a pressure of about 0.2 mbar. During exposure the crystal underwent a heating and cooling cycle (see experimental section), and APXP spectra were recorded at the same time. The acquired C 1s, Cl 2p, and I 4d spectra are shown in figure 9.
Figure 9. APXPS characterization during Sonogashira coupling reaction conditions. (a) and (c): C 1s image plots taken during exposure of the Au(1 1 1) surface to (a) PA + IB and (c) PA + CB. (b) and (d) Show the corresponding selected spectra marked by the dashed lines. (e) and (g): I 4d and Cl 2p image plots. (f) and (h): Corresponding selected I 4d and Cl 2p spectra.
Download figure:
Standard image High-resolution image
The C 1s data will be addressed first. Figures 9(a) and (c) show image plots of all C 1s spectra acquired during reaction conditions, while figures 9(b) and (d) show the selected spectra for PA + CB and PA + IB, respectively. The surface species are found at about 284 eV binding energy with the gas phase components at about 285.5 eV with an additional component at about 287 eV, which is assigned to a gas phase species from a gas phase spectrum of the PA + CB mixture (see figure S3). For CB, this agrees well with what was found for the single compound at ambient pressure. The exact composition of the adsorbate overlayer is difficult to assign as PA and CB monolayers have near-identical binding energies; we therefore limit ourselves to assigning the surface peak to a combination of CB and PA (sub-)monolayers. In contrast, in the PA + IB case, in comparison to pure IB, the surface species is located at a considerably lower binding energy (−0.3 eV). This energy agrees with that observed for the pure PA system, and thus, this component is assigned to (sub-)monolayer-coverage PA on the Au(1 1 1) surface, although a contribution of a (sub-)monolayer IB species cannot be excluded, either. During the temperature ramp the surface species signal for both gas mixtures shifts to lower binding energy, namely 283.8 eV, at 185 °C for CB and 170 °C for IB. This species is assigned to DPA on the basis of TDXPS results discussed above. Upon further heating, the lines of the surface species in both systems shift to 284.1 eV, where they remain during the entire cooling half cycle. This is a similar binding energy as that found for the unknown carbon surface structure formed upon dosing either pure PA or CB at ambient pressure. It is distinct from what was found for pure IB.
The influence of PA is clear in the PA + IB case since the signal of a surface C species is seen throughout the entire heating/cooling cycle. The observation agrees with the presence of a (sub-)monolayer of PA on the Au(1 1 1) surface. In the CB + PA case, the binding energy of the surface species agrees with that of a monolayer of CB, but at the same time it is difficult to differentiate between PA and CB, since their surface species have near-identical binding energies. In both vapour mixtures the surface species shifts to the binding energy assigned to DPA at moderate temperature, indicative of the Sonogashira cross-coupling reaction. The surface is, however, passivated by a unknown carbon species when heating above 340 °C.
Turning to the halogen core levels measured at reaction conditions, we consider the image plots of the Cl 2p and I 4d core levels in figures 9(e) and (g) and selected spectra in figures 9(f) and (h). At room temperature two doublets are seen in the Cl 2p spectra with Cl 2p3/2 components at 201.2 eV and 199.8 eV binding energy. The peaks are assigned to gas phase CB and (sub-)monolayer CB, respectively, in agreement with the TDXPS finding reported above. Thus, as stipulated based on the shape of the C 1s spectra non-dissociatively adsorbed CB is present on the surface. Similarly, two doublets are seen in the room temperature I 4d spectra assigned to atomic I–Au(1 1 1) (I 4d7/2 peak at 48.4 eV) and submonolayer IB (I 4d7/2 peak at 49.6 eV). The latter has an energy which is lower than expected for a monolayer (50.3 eV), but distinctly higher than the energy of an atomic I–Au(1 1 1) species. Hence, PA does not inhibit C–I bond cleavage on the Au(1 1 1) surface, and, in fact, submonolayers of PA and IB are found to be present at the surface. So is the atomic I–Au(1 1 1) species, which also implies the presence of phenyl radicals. Just above room temperature the submonolayer components vanish, and at 300 °C the intensity related to the atomic I–Au(1 1 1) species greatly diminishes. Only the gas phase CB species is present in the Cl 2p spectra during cooling while a minute I–Au(1 1 1) signal is seen in the I 4d spectra.
From the in situ APXP spectra we conclude on the observation of the Sonogashira cross-coupling reaction over the Au(1 1 1) surface at the conditions employed here (0.2 mbar, 185 °C (CB)/170 °C (IB)). For IB we initially, i.e. at room temperature, find the coexistence of an IB/PA (sub-)monolayer with the atomic I–Au(1 1 1) species, although we did not see this atomic species in the UHV TDRXPS experiments. Hence, C–I bond scission is faster than formation of the iodine compounds that desorb from the surface, tentatively HI. At reaction temperature, we instead observe the signal of the atomic species simultaneously with the C 1s line assigned to DPA in the TDRXPS experiments. This DPA component was not observed in the case of the pure compounds, and thus it results from the interaction of PA with CB and IB. In contrast and in line with the CB/PA UHV TDRXPS measurements, neither an atomic Cl–Au(1 1 1) nor a CB mono/multilayer species is seen during the Sonogashira cross-coupling reaction, although the DPA reaction product is visible. Hence, the residence time of CB, and subsequently Cl, on the Au(1 1 1) surface is so short that we are unable to see it with XPS at reaction temperature. This behaviour contrasts with the observations for the CB/PA reaction mixture.
For both gas mixtures the surface is inactivated at temperatures above 300 °C by the formation of an unknown carbon structure, which is similar in binding energy to the structure formed by adsorption of PA alone, but distinct from that observed for pure IB. Hence, PA plays a major role in the deactivation of the Au(1 1 1) surface. This is clearly demonstrated in the I 4d spectra: The atomic I–Au(1 1 1) species coexists with the C structure during the cooling half cycle, albeit at a greatly diminished signal strength. Thus, the C species covers the surface, including overgrowing the I–Au(1 1 1) species. Additionally, no re-condensation of IB or CB is found, which entails that the surface has become completely passivated towards CB and IB adsorption. Hence, no further Sonogashira cross-coupling reaction is possible.
4. Conclusions
In this study we have compared the adsorption of the I, Cl, and Br halobenzenes on a Au(1 1 1) single crystal surface and we have studied the temperature-dependent reaction behaviour of these compounds with PA and the interaction of CB and IB with PA at ambient pressure. The bond angles between the compounds and surface have been determined using XAS, and all XPS and XAS lines have been assigned. At monolayer coverage the molecules are near-flat lying, while at coverages higher than one monolayer there is no directional dependence. It is shown that IB dissociates on the Au(1 1 1) support, while there is some indication of possible dissociation for CB. There is no sign of BB dissociation at the employed conditions. This is in disagreement with the DFT study by Boronat et al [20], in which it is suggested that IB and BB would dissociate prior to CB. This discrepancy is attributed to the low bond angle of CB which allows for a greater Au–Ph interaction, which, in turn, enables C–Cl bond scission. After bond dissociation a single C species is left on the surface for IB and CB, but not for BB. The species is assigned to biphenyl formed in a Ullmann homocoupling reaction of the phenyl radicals. Interestingly, the atomic I–Au(1 1 1) species is found after bond scission, but no atomic Cl–Au(1 1 1) is observed. This discrepancy suggests different bond dissociation mechanisms.
In the reaction measurements, achieved by co-dosing the halobenzenes and PA, there is indication of formation of diphenylacetylene in both the IB and CB cases, but not for BB. This disagrees with the findings of Olivier-Meseguer et al [10] who found CB-derivatives to be the least reactive. Unfunctionalized BB and CB were not addressed, however. Further, we find that PA, CB, and IB adsorb on the Au(1 1 1) surface at ambient conditions (BB was not investigated). IB undergoes C–I bond cleavage as seen by a I–Au(1 1 1)-dominated surface, while a unknown carbon surface structure forms in the PA and CB vapours. Here, future mass spectrometry as well as ex situ and in situ infrared spectroscopy investigations that assign both the adsorbed and desorbed molecular species before, during, and after the reaction may play a vital role to fully understand the difference in the reaction mechanisms between chloro- and IB.
At ambient reaction conditions both CB and IB undergo the Sonogashira cross-coupling reaction at slightly elevated temperature when mixed with PA. The Au(1 1 1) surface becomes inactivated by further heating as a passivating C structure forms. In both the UHV and APXPS measurements, no Cl surface species is seen during reaction measurement, while for IB the atomic I–Au(1 1 1) species is seen in the reaction at ambient pressure, but not in the UHV reaction. Additionally, the temperatures at which DPA is found are higher at ambient conditions, which we conclude is due to the different surface structures. Hence, it is demonstrated that investigations at ambient conditions are vital in order to deduce the adsorbate structures and mechanisms of real catalysts.
Acknowledgements
We gratefully acknowledge the assistance of the staff at the MAX IV Laboratory. The Faculty of Science at Lund University is gratefully acknowledged for financial support.