Abstract
SampLe Interval Modulation-magnetic resonance elastography (SLIM-MRE) is introduced for simultaneously encoding all three displacement projections of a monofrequency vibration into the MR signal phase. In SLIM-MRE, the individual displacement components are observed using different sample intervals. In doing so, the components are modulated with different apparent frequencies in the MR signal phase expressed as a harmonic function of the start time of the motion encoding gradients and can thus be decomposed by applying a Fourier transform to the sampled multidirectional MR phases. In this work, the theoretical foundations of SLIM-MRE are presented and the new idea is implemented using a high field (11.7 T) vertical bore magnetic resonance imaging system on an inhomogeneous agarose gel phantom sample. The local frequency estimation-derived stiffness values were the same within the error margins for both the new SLIM-MRE method and for conventional MRE, while the number of temporally-resolved MRE experiments needed for each study was reduced from three to one. In this work, we present for the first time, monofrequency displacement data along three sensitization directions that were acquired simultaneously and stored in the same k-space.
Export citation and abstract BibTeX RIS

Content from this work may be used under the terms of the Creative Commons Attribution 3.0 licence. Any further distribution of this work must maintain attribution to the author(s) and the title of the work, journal citation and DOI.
Introduction
Manual palpation of the body for assessing pathologies represents one of the most effective traditional diagnostic methods. The sensitivity of manual palpation is rooted in the correlation of pathological changes with the mechanical behavior of biological tissue (Fung 1993, Yeh et al 2002). Inside the body, the mechanical properties can be determined using the emerging technique of magnetic resonance elastography (MRE) (Muthupillai et al 1995). MRE can therefore be described as a remote palpation technique and, to date, MRE represents the only non-invasive method capable of measuring the mechanical parameters of brain in its in vivo environment without surgical intervention. MRE has emerged as an accurate diagnostic method for grading the stage of hepatic fibrosis (Asbach et al 2010, Huwart et al 2007, Yin et al 2007), and it has revealed correlations between cerebral mechanical properties and diverse neuropathologies such as Alzheimer's disease, multiple sclerosis and normal pressure hydrocephalus (Freimann et al 2012, Murphy et al 2011, Schregel et al 2012, Würfel et al 2010).
In MRE, external vibrations are introduced into the tissue under examination. Standard magnetic resonance imaging (MRI) sequences, upgraded with motion encoding gradients (MEG), are applied that encode tissue vibrations into the phase of the MR signal. From the observed wave motion the tissue mechanical parameters can be calculated using a variety of reconstruction techniques (Manduca et al 2001, Van Houten et al 2011, McGarry et al 2012, Papazoglou et al 2012).
Since its inception in 1995 (Muthupillai et al 1995, Lewa and De Certaines 1996, Plewes et al 1995), MRE has been constantly refined. Early in the development, scalar wave fields in two dimensions were acquired for a determination of the shear stiffness at one specific mechanical excitation frequency (Yin et al 2007, Klatt et al 2006). Soon it was recognized that, since stiffness is a frequency-dependent quantity, additional information at multiple frequencies would be needed to establish tissue material parameters (e.g., by fitting rheological models to the measured, frequency-dependent wave quantities) (Clayton et al 2011, Klatt et al 2007). In addition, (Sinkus et al 2005) pointed out that, since a compressional wave is always present in an MRE experiment, it will introduce biases, when inverting the scalar wave images to determine tissue stiffness. To overcome this problem, the curl operator needs to be applied to the data, and this requires the acquisition of tissue vibrations along all three spatial directions inside a volume. A recent study demonstrated that the acquisition of all displacement components of a multifrequency vibration is very useful for increasing the spatial resolution and the quality of MRE-derived elastograms by applying a new least square error-based reconstruction method to 3D MRE data (Hirsch et al 2013a). There have been other developments in both multifrequency and monofrequency MRE that propose the acquisition of three components of the displacement vector (Murphy et al 2011, Hirsch et al 2013b, Johnson et al 2013, Pattison et al 2010, Qin et al 2013, Hirsch et al 2013, Romano et al 2012, Yasar et al 2013a).
A single MRE image corresponds to a snapshot of the mechanical wave motion in tissue. A sequence of such snapshots is needed at different time steps to calculate the vibration harmonics of complex wave images. The array of images is then further processed to create elastograms. When performing MRE, depending on the specific approach, an acquisition block of four (Murphy et al 2011, Yin et al 2007) to eight (Pattison et al 2010, Yasar et al 2013b, Zhang et al 2011) individual phase-difference images is acquired in order to determine the complex wave image for one sensitization direction. For recording all components of the displacement vector, this acquisition block is typically repeated twice with MEGs applied along the remaining two coordinate axes—resulting in a total of 12–24 phase-difference images.
The presented work introduces a new motion encoding concept for the displacement vector in monofrequency MRE. Our approach, which we name SampLe Interval Modulation (SLIM)-MRE, is capable of acquiring all components of the displacement vector from only eight phase-difference images. In SLIM-MRE, the monofrequency vibration is encoded with different apparent frequencies for the three spatial directions by intentionally mismatching the sampling intervals with respect to the three spatial directions. In doing so, multidirectional data is encoded simultaneously and stored into the same k-space, which was considered to be unfeasible since the inception of MRE nearly 20 yr ago. Due to the modulation of the sampling intervals, the individual displacement components can be decomposed by applying a Fourier transform. In the following, we first describe the theoretical groundwork of our new approach and then demonstrate its feasibility using a high field (11.7 T) MRI system.
Theory
The basic equation of MRE is represented by an integral over time (Muthupillai et al 1995), which describes the accumulation of the MR phase ϕ as a result of a harmonic tissue vibration u exposed to a magnetic field gradient G:

Herein the gyromagnetic ratio and the duration of the MEG are denoted by γ and τ, respectively and for simplicity we write gradient and vibration as functions of the variable of integration t only, although G and u also exhibit a dependency on frequency and initial phase. For the purpose of introducing SLIM-MRE, it is useful to reformulate equation (1) with the start time s of the MEG relative to a fixed origin of the time axis:

The harmonic vibration is expressed with amplitude u0, initial phase θ and frequency f, while in the following, we also assume sinusoidal MEG of frequency f with amplitude G0 and initial phase θM. The vibration and gradient directions are defined by the unit vectors eu and eM, respectively:


Typically in MRE, magnetic field gradients with zero moment are used as the MEGs in order to eliminate phase portions due to stationary spatial offsets. Therefore the MEG duration τ must correspond to an integer multiple of the MEG period 1/f:

In the special case of sinusoidal MEGs with zero phase at the start t = s of the MEG, we have

A solution of the integral equation (2) is obtained using equations (3)–(5),

while consideration of the special case (equation (6)) yields

Equation (7b) essentially establishes that the MR phase ϕ, expressed as a trigonometric function of the MEG start time s, corresponds to a harmonic oscillation with the same frequency as the applied acoustic vibration. Therefore, the initial phase θ and the amplitude u0 of the vibration can be calculated by resolving ϕ with respect to s. In the general case (equation (7a)) θ and u0 can be determined by varying the phase difference between θ and θM. Of note, these conclusions also hold, when other balanced (zero moment) gradients are used, e.g., MEGs with a cosine or trapezoidal shape, and even when the MEGs oscillate with a frequency different from the vibration frequency. In these cases only the encoding efficiency ξ = ϕ0/u0 needs to be adjusted and the corresponding phase shift established as in equations (7a) and (7b).
The MR phase ϕ has to be read in N discrete steps Δt for temporal resolution. This enables one to determine the Fourier transform U(f) of the real-valued displacement u(t) at the discrete frequencies (Oppenheim and Schafer 1989)

In conventional MRE, the MEG is shifted over the period 1/f of the vibration frequency using a sampling interval Δt = 1/(Nf). Consequently, the crucial spectral value of U(nΔf) is stored into the first frequency component (n = 1). While an MRE approach based on multifrequency fractional motion encoding (Klatt et al 2007) makes use of the spectral values at n > 1, these higher order frequency components have so far been discarded in conventional monofrequency MRE. For the acquisition of all components of the displacement vector, the above procedure is typically repeated three times, while applying the MEG in mutually orthogonal directions in the consecutive steps (Glaser et al 2012).
In the following, we show that the amplitudes and the initial phases of the displacement projections, which are different for the three spatial directions and are therefore denoted with u0,j and θj in the following, can be calculated from the discrete MR phase in only one temporally-resolved MRE experiment by using the concept of SLIM. In this approach, the MEGs corresponding to the three spatial directions are applied simultaneous, however, their sampling intervals are different. For setting the theoretical basis of SLIM-MRE, we extend the MR phase equation (2) as a function of three variables (s1, s2, s3) representing the start times of the x-, y- and z-MEG:

The x-, y- and z-directions correspond to j = 1, 2, 3. Of special note, in the presented implementation of SLIM-MRE using MEGs with zero phase at their onset, the duration τ is equal for all MEGs, while the MEG start times vary. We can directly adopt the solution from equation (7b), while taking into account the direction-specific MEG amplitude G0,j:
The concept of SLIM-MRE implies the modulation of the sampling intervals Δtj with respect to the x-, y- and z- directions, resulting in direction-specific, discrete start times sjn, when only MEGs with zero phase at their onset are considered,
Equation (11) essentially reveals that the x-, y- and z-MEGs are shifted over one, two and three times the vibration period, respectively. However, this order can also be permuted. An example of the MEG arrangement is illustrated in figure 1 with one MEG cycle per direction and time step. The discretization of ϕ can be obtained by inserting equation (11) into equation (10):
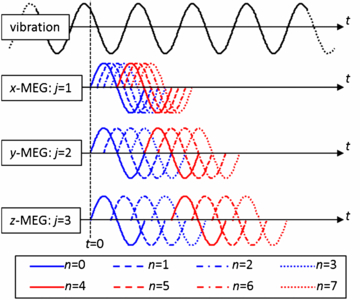
Figure 1. Arrangement of the MEGs relative to the vibration for eight time steps n according to equation (11). For clearness of the illustration, only one cycle of the MEG is shown per direction and time step, and periodicity is not accounted for in the figure.
Download figure:
Standard image High-resolution imageEquation (12) corresponds to the first three summands of a discrete Fourier series in amplitude-phase notation (Oppenheim and Schafer 1989). It is directly perceptible from equation (12) that the modulation of the sample interval, as described by equation (11), encodes the amplitude ϕ0,j and the initial phase θj of the x-, y- and z-projection of the displacement with different 'apparent' frequencies into the discrete MR phase ϕn, specifically with the 1st, 2nd and 3rd harmonic, respectively. The described relationship is depicted in figures 2(a) and (b). Because of equation (8), the acquisition of eight samples (N = 8) is sufficient to decompose the three projections by applying a discrete Fourier transform to ϕn.
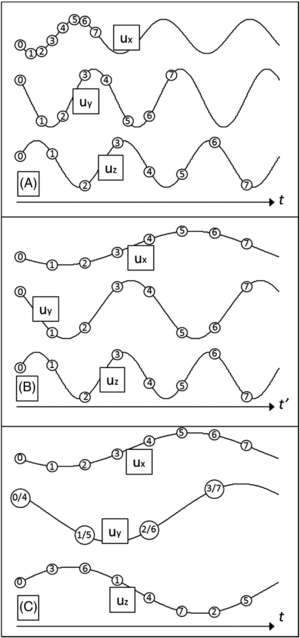
Figure 2. The relation between the displacement projections ux, uy and uz (solid lines) and the onset of the respective MEG (circles). The numbers within the circles correspond to the discrete time step n as defined in equation (11). (A): Situation in real time t without accounting for periodicity. (B): The accumulated MR phase portions of the projections sum up at each sample (see equation (12)). Therefore in the discretized time domain t' of synchronous sampling instances, the three projections exhibit distinct different frequencies. Consequently, amplitude and phase of each projection can be obtained from the Fourier transform of the discrete MR phase. (C): Situation in real time t, now accounting for periodicity, as described by equation (13).
Download figure:
Standard image High-resolution imageA periodicity relation can be read from equation (12), as the replacement of the factor jn/N with the modulo value of jn/N yields the same result for ϕn. Consequently, the start of the MEGs as described in equation (11) can be conducted earlier due to periodicity,

Equation (13) represents a useful property for minimizing the increase in echo time TE due to the delays in the application of the MEGs, which becomes obvious by means of the MEG start times, while accounting for their overall periodicity (see figure 2(c)).
Methods
In this study the SLIM-MRE method was demonstrated at 5 kHz using a vertical bore µMRE/MRI system described in (Yasar et al 2013b), but, the technique is independent of the specific mechanical frequency; thus, it can be implemented on any MRI system configured to collect MRE phase images.
Experimental setup
Experiments were performed in an 11.7 Tesla vertical bore Bruker (ID = 56 mm) MRI system. A saddle RF coil (ID = 10 mm) was used with micro imaging gradient coils (ID 19 mm) and 300 Gauss cm−1 maximum gradient field per direction. Samples were placed in a plastic test tube, which was attached to a piezoelectric actuator (6.5 mm × 6.5 mm × 18 mm, Thor Labs Inc.). On the other end of the piezoelectric actuator a counter mass was placed to provide an inertial ground (figure 3).
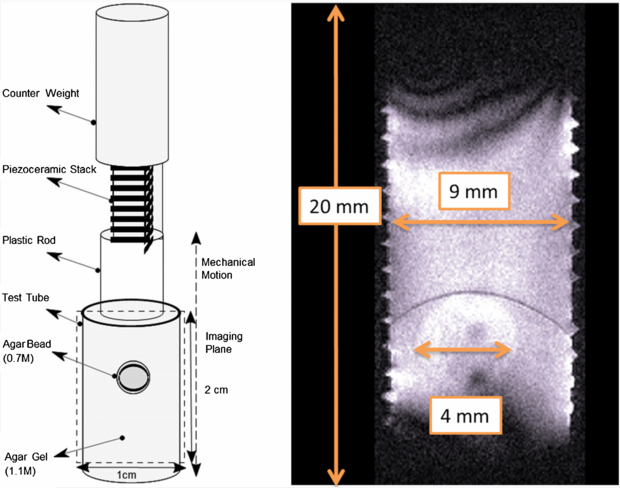
Figure 3. On the left-hand side, the mechanical actuation setup inside the vertical 11.7 T MRI system is depicted. On the right-hand side, a magnitude image of the sample from a conventional MRE acquisition is shown. The inner wall of the test tube was threaded to provide better traction between the agarose gel and the test tube. The dark arc in the magnitude image close to the bead results from the sample preparation process, since the gel was cured in two steps; first, the upper part was poured (while the tube was upside down) and cured to prevent the agarose bead to sink. Then in the second step, the bottom part was poured in. The dark arc corresponds to the contact surface of the two layers.
Download figure:
Standard image High-resolution imageA harmonic mechanical vibration of 5 kHz frequency was introduced into the sample by driving the piezoelectric actuator with a power amplifier. The amplifier signal was biased by a dc supply to prevent a negative voltage, which is harmful to the integrity of the piezoelectric actuator. The axisymmetric experimental configuration of the actuator causes geometric focusing of the induced mechanical waves within the sample. This superposition and convergence of wave fronts thus compensates for the strong damping of shear waves at 5 kHz in soft biological tissues and in tissue-like phantoms (Yasar et al 2013b, Royston et al 2011). We used an inhomogeneous sample composed of an agarose bead embedded in agarose gel formed from a different concentration in all experiments. Thus, for this experimental arrangement, we were able to generate displacements in all three spatial dimensions within the image slice due to the reflection and refraction of the mechanical energy at the spherical bead surface.
Sample preparation
A cylindrical plastic container (height = 20 mm; ID = 9 mm) was used as a test tube. The sample was composed of an agarose bead (0.7% by water) with diameter 4 mm submerged in agarose gel (1.1% by water). The sample was freshly prepared one day before the experiment and stored overnight in the MRI room at 20 °C.
Image acquisition
A fast spin echo-based pulse sequence was used for data acquisition. Sixteen sagittal slices were obtained with the following imaging parameters: repetition time TR = 1500 ms; effective echo time TE = 23 ms, echo number 4; field of view, FOV = 20 mm × 10 mm; slice thickness = 0.5 mm; matrix size = 256 × 128; MEGs with 20% of full power were placed in read, phase and slice directions. While eight time steps were used in all three directions, the sampling interval was different for each direction according to the SLIM-concept and periodicity was accounted for with respect to the start of the MEG relative to the vibration (see equation (13)). The MEG onsets in the present study are listed in table 1 (iii). At each time step, two acquisitions were conducted with inverse MEGs to calculate phase-difference images for clearing biases originating from static magnetic field inhomogeneity. The duration of SLIM-MRE acquisition was ∼12.8 min. For comparison, conventional MRE experiments were performed, in which the three components of the displacement vector were acquired in three individual experiments consecutively, resulting in a total measurement time of ∼38.4 min. In both conventional and SLIM-MRE, 2D local frequency estimation (LFE) was applied to the images (Knutsson et al 1994) for determination of the wave length λ. Elastograms representing the stiffness µ were calculated using µ = ρ (λ f)2, while assuming a density of ρ = 1000 kg m−3. Finally, the stiffness was averaged over the ROI, which corresponded to the bead within the image slice and the error was determined by means of the standard deviation (SD).
Table 1. Starting time sjn of the x-, y- and z-MEG expressed in three ways for eight time steps. The analytic expression is listed without (i), equation (11) and with (ii), equation (13), accounting for periodicity. The start times of the MEGs in the presented study are given in µs (iii) and were calculated from equation (13) using N = 8 and f = 5 kHz.
| n | s1 (i) | s1 (ii) | s1 (iii) | s2 (i) | s2 (ii) | s2 (iii) | s3 (i) | s3 (ii) | s3 (iii) |
|---|---|---|---|---|---|---|---|---|---|
| 0 | 0 | 0 | 0 | 0 | 0 | 0 | 0 | 0 | 0 |
| 1 |  |
 |
25 |  |
 |
50 |  |
 |
75 |
| 2 |  |
 |
50 |  |
 |
100 |  |
 |
150 |
| 3 |  |
 |
75 |  |
 |
150 |  |
 |
25 |
| 4 |  |
 |
100 |  |
0 | 0 |  |
 |
100 |
| 5 |  |
 |
125 |  |
 |
50 |  |
 |
175 |
| 6 |  |
 |
150 |  |
 |
100 |  |
 |
50 |
| 7 |  |
 |
175 |  |
 |
150 |  |
 |
125 |
Results
SLIM-MRE was successfully implemented and applied to the phantom. In figure 4 the complex wave images of the three displacement components are illustrated in an image slice, which intersects the bead and is parallel to the MRI axis. Images obtained using conventional MRE in consecutive acquisition blocks (top row) are compared to the results of SLIM-MRE (bottom row).
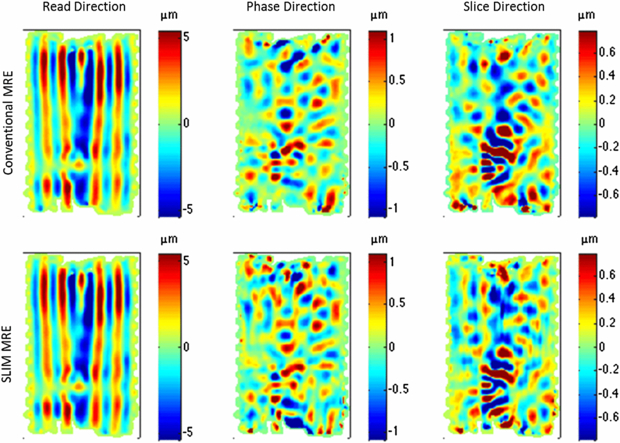
Figure 4. Complex wave images (real part) in an inhomogeneous gel phantom at 5 kHz acquired consecutively using conventional MRE and acquired simultaneously using SLIM-MRE. One displacement component is shown per column as indicated in the heading.
Download figure:
Standard image High-resolution imageIn both image sets, the wave amplitude was seen to vary for each of the different encoding directions. Even though the wave amplitudes are the highest in z-direction (read direction), as the piezoelectric actuator introduced motion along the longer axis of the imaging slice, x and y-displacements are also clearly visible within the bead. These components resulted from refraction and reflection of wave energy at the spherical bead boundaries. By visually comparing SLIM-MRE and conventional MRE, wave images corresponding to the same encoding direction exhibit similar wave structures (figure 4).
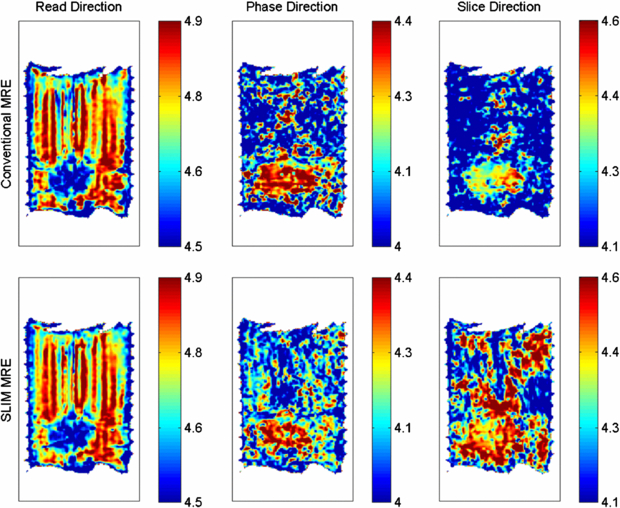
In the LFE-derived elastograms in figure 5, the position of the bead is indicated, while the best delineation of the bead from the surrounding is visible in the read direction. Using SLIM-MRE (conventional MRE) the stiffness values averaged over the bead were 33.5 ± 9.3 (33.0 ± 9.7) kPa, 22.0 ± 6.3 (23.1 ± 5.0) kPa and 23.3 ± 8.2 (24.1 ± 4.9) kPa for the read-, phase- and slice-component, respectively.
Figure 5. Elastograms calculated from the wave images in figure 4, which were acquired consecutively using conventional MRE (top row) and simultaneously using SLIM-MRE (bottom row). Note, that the colorbars represent logarithmic scales, e.g. 4.5 corresponds to 104.5Pa = 31.6 kPa. Elastograms with respect to one displacement component are shown per column as indicated in the heading. Using SLIM-MRE (conventional MRE) the stiffness values averaged over the bead were 33.5 ± 9.3 (33.0 ± 9.7) kPa, 22.0 ± 6.3 (23.1 ± 5.0) kPa and 23.3 ± 8.2 (24.1 ± 4.9) kPa for the read-, phase- and slice-component, respectively.
Download figure:
Standard image High-resolution image
Discussion
We introduce the concept of SLIM to MRE for acquiring all three motion components of a single frequency vibration simultaneously. We have shown that the use of eight samples for temporal resolution is sufficient to decompose the three displacement components, which were encoded with different discrete frequencies in the MR signal phase. Therefore, SLIM-MRE is faster than conventional motion encoding techniques, where four to eight samples are acquired for each component. Since SLIM-MRE is capable of acquiring all components of the 3D displacement vector simultaneously, the technique is also potentially more accurate than conventional motion encoding approaches, where the three projections of the displacement are acquired consecutively in individual experiments. Therefore, image misregistration artifacts generated over time due to biological motions or different physiological states are reduced in SLIM-MRE.
We have shown in this proof-of-concept study using an inhomogeneous agarose phantom that SLIM-MRE yields similar wave images and the same LFE-derived stiffness values within the error margins as conventional MRE. The delineation of the bead from the surrounding gel is most distinct for the read direction, which represents the principle direction of vibration in our setup. While the refraction of shear waves resulted in vibration also along the phase and slice direction within the bead, there was no significant motion visible for these components in the surrounding gel except within the vicinity of the bead. It is inherent to the LFE-technique that the wave motion outside the bead also contributes to the estimated wavelength within the bead. Hence, the SD of the stiffness within the bead is the highest for the read direction.
In our study, there was no consistent trend in stiffness and SD differences for the individual motion encoding directions between conventional MRE and SLIM-MRE. While the LFE-derived stiffness values were the same within the error margins using both approaches, we can only speculate about the underlying reason for the measured differences. In these considerations concomitant field terms potentially play a role, which are always present with nonlinear spatial dependence, when a linear gradient is activated (Bernstein et al 1998). In conventional MRE, these terms are imaged on the dc component for a static voxel and on the second harmonic for a vibrating voxel and are thus not interfering with the complex wave image of interest. In SLIM-MRE the second harmonic frequency bin is used for the encoding of one vibration direction and the concomitant field terms could potentially interfere. However, using the first order approximation of the concomitant field given in Bernstein et al (1998), we can assess for our setup that the ratio of the concomitant field over the field induced by the gradients is only on the order of 0.8%. Therefore the expected error should be below the noise level. Also, the concomitant field effects in MRE are removed in phase-difference images calculated from acquisitions with inverse MEG polarities, as was done in the presented study. Further research has to be performed to examine whether the mechanical parameters determined using SLIM-MRE and conventional MRE are also in good agreement in other experimental setups, such as in vivo MRE and MRE using large scale, low field scanners.
We used a fast spin-echo MR sequence upgraded with MEG according to the SLIM-concept. Eight time steps were acquired and the displacement projections were determined for three mutually orthogonal directions that are defined by the gradient coils. As a general concept for the MEG arrangement, however, the SLIM technique is extendable to more than three directions given a sufficient number of time steps and SLIM is also applicable to any combination of directions. Further, SLIM-MRE is not bound to a specific sequence type, but is applicable to all standard sequences commonly used in MRE, such as spin-echo, gradient-echo and EPI.
In standard MRE approaches, the start of the vibration is typically shifted relative to the RF pulse, which leaves the MEGs unchanged in individual time steps with respect to the sequence timing. This is different in the presented work, where the need for direction-dependent MEG start times increases the minimum echo time. We did not change the timing of the vibration relative to the RF pulse, but achieved temporal resolution solely by adjusting the MEG timing. Using this approach, the TE has to be increased by 87.5% of the MEG period. This is due to the fact that 7/(8f) corresponds to the latest MEG start time when accounting for periodicity (see table 1). Of note, the TE-prolongation can be further reduced. For this purpose, as a first step, the interval between the RF pulse and the earliest start time at each n needs to be constant and consequently the vibration has to be shifted with respect to the earliest start time. The TE-increase then accounts for only 62.5% of the MEG period, since the maximum difference between the start times of different MEGs at the same n is equal to 5/(8f), as can be seen in table 1 for the case of periodicity. Then as a second step, a symmetry of the phase integral equation (2) can be exploited. Its solution equation (7b) remains unchanged, when the MEG is inverted and its onset is brought forward by half a vibration period. Thus the TE increase can further be reduced to 25%. However, a TE-prolongation is inevitable using MEGs with zero phase onset.
The increase of the minimum echo time represents a drawback of SLIM-MRE compared to conventional MRE. This effect is less relevant in high field, small scale scanners, where multiple MEG cycles are typically applied. In these cases, the SLIM-related prolongation of TE accounts for only a fraction of the total MEG duration, which was 17.5% in the presented study (because of the use of five MEG cycles per direction and sample). In human studies, however, various MRE protocols use only one MEG cycle resulting in an inevitable TE-increase of 25% of the MEG duration (not just 25% of the MEG period), when using MEGs with zero phase onset in SLIM-MRE. The effect of decreased signal to noise ratio due to prolonged TE may be compensated for by the use of simultaneous, rapid acquisition in SLIM-MRE, but this needs to be evaluated in future human studies.
Using the SLIM-concept, multidirectional data can even be acquired without increasing the minimum TE compared to conventional MRE. In this case the simultaneous acquisition of all components of the displacement vector requires the sampled MEG start phase to be direction-dependent. This approach would account for temporal resolution by varying the phase θM of the MEG at its start time (equation (7a)) and not by shifting the vibration relative to the start s of the MEG (equation (7b)). As a downside, the applied MEGs would possess different gradient moment nulling characteristics at the temporally-resolved images. More precisely, the displacement projection at one sample might be flow-compensated using a cosine-shaped MEG, flow-uncompensated using a sinus-shaped MEG or a mixture of both, when the MEG start phase is neither zero, nor a multiple of π/2.
Conclusion
Besides our own work (Klatt et al 2013), this is the first time that multidirectional magnetic resonance elastography (MRE) data of a monofrequency vibration is acquired simultaneously, which was considered to be unfeasible since the inception of MRE nearly 20 yr ago. A comparison of SampLe Interval Modulation-MRE and conventional MRE on an inhomogeneous gel sample using a high field vertical magnetic resonance imaging system gave the same local frequency estimation derived stiffness values within the error margins, while reducing the necessary number of temporally-resolved MRE experiments from three to one.
Acknowledgment
Grant support: NIH Grant Nos. EB012142 and EB007537.