


ABSTRACT
Compelled to observe a young, intermediate mass (IM) protostar candidate, we image velocity structure in a variety of molecular lines toward a strong millimeter continuum peak, MMS 13, in the young stellar object cluster R Corona Australis. We report the detection of N2H+ (1–0) and C34S (2–1) corresponding to a filamentary IM core coincident with a site of turbulent flow convergence and Spitzer infrared emission minimum. Several emission features including a central decay of turbulence, kinematic signatures of bulk infall, and strong winds support mass and age estimates in indicating the presence of a proto-Herbig Ae system in the region. Channeling of center velocity flow with turbulence amplification along the rotation axis drives wind generation in the system candidate.
Export citation and abstract BibTeX RIS
1. INTRODUCTION
The CrA molecular cloud boasts an unusually high fraction of intermediate luminosity (∼100  ) young stellar objects (YSOs; Wilking et al. 1992) and a star formation efficiency (SFE) of ∼40% (Harju et al. 1993), which at b = −18° and ∼130 pc (Marraco & Rydgren 1981; Neuhäuser & Forbrich 2008) provide ideal, unobstructed conditions for study of early, intermediate mass (IM; 2–8
  ) star formation. Since the 1970s, observations of linear polarization (Vrba et al. 1976) have shown magnetic field correlation with overall structure in Cloud A (Rossano 1978; Loren 1979), which coincides with the dense, western cloud core R CrA, site of the present study. R CrA harbors the highly variable, young Herbig Be (HBe) star R CrA (Joy 1945; Herbig 1960; Gray et al. 2006), which is surrounded by a rapidly varying reflection nebula (Hubble 1921; Graham & Phillips 1987). Millimeter continuum observations suggest MMS 13, by far the brightest of ∼25 peaks in R CrA, harbors a proto-HAe/Be star (Saraceno et al. 1996; Chini et al. 2003).
MMS 13 does not correspond to the brightest infrared (Wilking et al. 1992, 1997) or Very Large Array (VLA; Brown 1987; Liu et al. 2014) sources in the region, and may be a composite source of ∼4–7  with an extended peak to the south (Nutter et al. 2005). Anderson et al. (1997) identified a rotating molecular disk around the binary protostar IRS 7 (Taylor & Storey 1984; Sicilia-Aguilar et al. 2013), which harbors an extremely embedded source XW (Hamaguchi et al. 2005), concluding the disk is associated with a quiescent core in the vicinity of clump A2 (Harju et al. 1993) and that two different generations of outflows exist in the neighborhood of IRS 7. Submillimeter Array (SMA) imaging in HCO+ (3–2) does not show particular association with continuum emission in the region (Groppi et al. 2007) suggesting the presence of extensive warm gas for which low-mass YSOs alone cannot account, in agreement with recent high resolution molecular line and continuum observations (Lindberg & Jørgensen 2012; Lindberg et al. 2014). Near-infrared H2 emission suggests outflow stunting due to the presence of dense (>104 cm−3) core material (Kumar et al. 2011), a scenario again supported by the observations presented here.
Observations of nascent HAe/Be stars are rare in part due to extreme youth, deeply embedded sources, and a short contraction timescale (e.g., Palla & Stahler 1993; Perez & Grady 1997). The origin of outflow and X-ray emission associated with this young transitional class, in HAe stars mediated by shock interaction between accretion driven winds and ambient clumps, is poorly understood (e.g., Waters & Waelkens 1998; Günther & Schmitt 2009; Suh 2011). One of the youngest documented proto-HAe stars to date is a member of the tight binary system, EC 95 (Preibisch 1999; Dzib et al. 2010), which exhibits non-thermal emission, a mass of ∼4  , and is located in an infrared cluster with high SFE (Eiroa & Casali 1992), characteristics shared by the filamentary core presented here and its environment.
1.1. Molecules
Let us observe a variety of lines, and as emission signatures from specific physical conditions within the star-forming region vary with transition in addition to the amount of self-absorption, scattering (Fuller 1989), and saturation (Phillips et al. 1979), mean gradients in line width and velocity dispersion may represent systemic shifts in turbulence. The C2H radical has a  electronic ground-state configuration; fine and hyperfine structure result from spin–orbit and electron–nucleus interactions, respectively (Müller et al. 2000). C2H can probe ultraviolet (UV) irradiated (Fuente et al. 1993) and cold gas (Nakajima et al. 2011). Decreasing optical depth with time suggests use of this species as a "chemical clock" for molecular clouds (Li et al. 2012).
c-C3H2 has two equivalent H nuclei whose coupling results in ortho and para spin states. In the hydrocarbon family, sensitivity to UV radiation and turbulent mixing increases significantly from C2H to C3H2 and from C3H2 to larger hydrocarbons (Qi et al. 2013). c-C3H2 can probe HAe disks (Qi et al. 2013) as well as photodissociation regions (Pety et al. 2005) and planetary nebulae (Tenenbaum et al. 2009), tracing dense and UV-illuminated regions.
Observations and theory suggest a profusion of C5H and C34S in early stages of dark cloud evolution, where these molecules' ground-state emission originates primarily from a region sheltered from infrared radiation (Leung et al. 1984; Herbst & Leung 1989; Takakuwa et al. 2000; Sakai et al. 2008).
CH3OH is a principal constituent of grain mantles (Tielens & Allamandola 1987; Allamandola et al. 1992), where it can be produced by hydrogenation reactions of CO (Caselli et al. 1994); energetic processing through UV irradiation may lead to rapid production (Chiar et al. 1996). Methanol abundance is thought to peak early, having formed from C and C+ via CH3+, and to decrease significantly later in molecular cloud evolution (Herbst & Leung 1989; Shalabiea & Greenberg 1995; Pratap et al. 1997). CH3OH has been observed in dense IM cores, IM and massive hot cores (Benedettini et al. 2004; Sánchez-Monge et al. 2010; Fuente et al. 2014), hot core precursor candidates (van der Tak et al. 2000), as well as outflow associated with protobinaries (Parise et al. 2006) and IM protostars (Beltrán et al. 2002).
HC3N can trace early dark cloud evolution (<105 year) when cores efficiently produce C-chain molecules (Jørgensen et al. 2004; Suzuki et al. 2014), dense cold and warm gas (Meier et al. 2011), filamentary cores (Li & Goldsmith 2012), as well as disks (Chapillon et al. 2012). Higher fractional abundances have been observed in low-mass rather than high-mass cores, indicating destruction by UV radiation (Chung et al. 1991).
High HCN abundances are associated with shock chemistry (Tafalla et al. 2010) and high kinetic temperatures (Harada et al. 2010). The luminosity as traced in HCN, LHCN, exhibits linear correlations with that in the far-infrared, LFIR, and SFE (Gao 2009).
H13CO+ column densities are well correlated with those of DCO+, which may originate in denser regions than those probed in traditional dense core tracers such as NH3 (Butner et al. 1995). H13CO+ emission is associated with dense outflows as well (Sugitani et al. 2002).
HNC may be destroyed by shocks and at high temperatures through neutral–neutral reactions (Schilke 1992; Schilke et al. 1992), enhancements tracing cold gas. Close correlation is observed between abundances in HNC and HC3N in low-mass protostellar envelopes (Jørgensen et al. 2004).
N2H+ plays a critical role as it is not readily depleted due to the low binding energy of N2 to grains (Aikawa et al. 2003). This molecule is a reliable tracer of cold dark cloud cores with densities up to ∼106 cm−3 (Daniel et al. 2007), massive dense cores (Pirogov et al. 2003), as well as low-mass (Chen et al. 2007) and IM Class 0 cores (Alonso-Albi et al. 2010).
SO has two unpaired electrons and is excited by near-infrared radiation to the more reactive singlet state. This molecule is found in high velocity outflows (Chernin et al. 1994). Increasing gas-phase abundance with time suggests the use of SO as a "chemical clock" for molecular clouds (Bergin & Langer 1997).
Transitions observed here in C2H and N2H+, which exhibit a significant non-thermal velocity dispersion (Table 1), have the most similar morphologies and closest peaks of observed species in support of turbulent mixing in the region as these molecules tend to probe UV-enhanced (Fuente et al. 1993; Kastner et al. 2015) and dense environments (Daniel et al. 2005, 2007), respectively (Figure 2). We start by describing the observations and distributions then move to consideration of the proto-HAe system candidate (Figure 1) and wind generation.

Figure 1. From Chini et al. (2003). 1.2 mm continuum observed with SEST around MMS 13 (SMM 1A in Nutter et al. 2005). Triangles denote positions of the HAe/Be stars R CrA and T CrA. Squares denote near-infrared sources IRS 5 (Taylor & Storey 1984), HH 100 (Elias 1980), and WMB 55 (nomenclature taken from Gezari et al. 1999; data by Wilking et al. 1997). Stars denote VLA sources 9 (SMA 2 in Groppi et al. 2007), 10 A, 10 B (Brown 1987), and the 10 μm source labeled TIMMI, also known as IRS 7, 10 W, and XW. The circle denotes the proto-HAe system candidate to the SW of peak MMS 13. Contours are 415 to 580 in steps of 55, 690 to 1450 in steps of 190, and 1720 to 2800 in steps of 270 with units in mJy beam-1. Data are smoothed to 28 arcsec and the beam size is shown at the top right.
Download figure:
Standard image High-resolution imageTable 1. MMS 13 in R CrA: Observations of a Proto-HAe System Candidate
| Line |

|
La |

|
 b
b
|
Nc |
 d
d
|
M |
|---|---|---|---|---|---|---|---|
| (MHz) | (10−2 pc) | ( km s−1) | ( km s−1) | (1013 cm−2) | (  ) ) |
( ) ) |
|
| C2H 1–0 | 87316.925 | 7.1 | 0.77 | 0.25 | 0.3 | 4.7 | 0.4 |
| C34S 2–1 | 96412.961 | 4.8 | 0.31 | 0.24 | 0.2 | 0.5 | 1.7 |
C5H  − −  f f |
93094.900 | 4.0 | 0.30 | 0.15 | ⋯ | 0.4 | ⋯ |
| c-C3H2 2–1 | 85338.906 | 4.3 | 0.39 | 0.19 | 0.4 | 0.7 | 0.07 |
| CH3OH 2–1 | 96741.377 | 9.3 | 0.52 | 0.33 | 2.0 | 2.6 | 3.1 |
| CS 2–1 | 97980.953 | 11.8 | 1.23 | 0.56 | 0.2 | 18.6 | 2.7 |
| H13CO+ 1–0 | 86754.330 | 8.6 | 0.93 | 0.28 | 0.4 | 7.9 | 5.5 |
| HC3N 10–9 | 90978.989 | 6.9 | 1.00 | 0.36 | 0.4 | 7.2 | 1.7 |
| HCN 1–0 | 88631.847 | 9.7 | 1.74 | 0.58 | 6.0 | 25.9 | 1.7 |
| HCO+ 1–0 | 89188.526 | 12.5 | 1.43 | 0.85 | 19.4 | 26.8 | 2.9 |
| HNC 1–0 | 90663.572 | 10.0 | 1.47 | 0.60 | 1.0 | 22.7 | 3.7 |
| N2H+ 1–0 | 93173.480 | 7.1 | 0.66 | 0.67 | 1.0 | 3.2 | 3.2 |
| SO 2–1 | 86093.983 | 4.1 | 0.44 | 0.20 | 0.3 | 0.8 | 0.04 |
| SO 3–2 | 99299.905 | 5.9 | 0.61 | 0.25 | 0.4 | 2.4 | 0.1 |
Notes. Species, rest frequency, emission diameter, FWHM line width, velocity dispersion, column density, and virial and abundance-derived mass are listed for each transition.
aWithin half-peak integrated intensity. bAverage second moment values within half-peak contour. cSee Section
 with
with  in km s−1 and R =
  in pc; a, b values are listed in Table 2.
Download table as: ASCIITypeset image
2. OBSERVATIONS
Three-millimeter band (∼76–117 GHz) observations were conducted in optimum spring conditions at the 22 m Mopra1 antenna near Coonabarabaran, Australia. At 100 GHz, the beam FWHM is ∼35 arcsec. The front end is an MMIC 3 mm receiver operated in single sideband mode, measuring two orthogonal polarizations. A typical above-atmosphere Tsys was 180 K.
Total bandwidth is split into four overlapping 2.2 GHz IFs and down-converted to base band. The spectrometer produces four "zoomed" sub-bands for each IF, enabling simultaneous observation of 16 spectral windows per configuration. Three different zoom configurations were used from ∼85 to 100 GHz so that a total of 48 zoom-bands were used in mapping the source; each was arranged so that the lines presented here be given band center priority.
Each zoom-band has a bandwidth of 137.5 MHz and 4096 channels; the spectral resolution is ∼35 kHz, giving a velocity resolution of ∼0.1 km s−1 at these frequencies. Chopper wheel calibrations were performed between schedules as were observations of SiO masers, with a pointing accuracy typically less than 5 arcsec rms.
Observations were made in "on-the-fly" mode enabling  regions mapped in ∼60 minutes. The telescope scans at 3.5 arcsec s−1, averaging data over a 2 s cycle interval, giving an optimum collection rate while not smearing output.
Each map comprises at least 40 pixel rows and columns, totaling over 1600 spectra per field with 9 arcsec row spacings. Spectra were reduced with the Livedata and Gridzilla packages,2
subtracting a linear baseline fit from emission free channels then gridding into  cubes. The cubes are Tsys weighted and smoothed with a 0
 55 Gaussian kernel. The final map has a ∼0.1 K rms sensitivity.
3. ANALYSIS AND DISCUSSION
3.1. Distributions
Maps of integrated intensity are shown in Figures 2 and 3. CS (2–1), HCN (1–0), and HCO+ (1–0) exhibit ∼EW extending morphologies with peaks close to IRS 7 as well as MMS 13. H13CO+ (1–0) and HNC (1–0) are similarly extended yet present more elongated (∼3:1 aspect ratio) 90% distributions, the former peaking ∼0.03 pc SW (at a distance of 130 pc) of IRS 7 within pointing accuracy of the peaks in N2H+ (1–0), C34S (2–1), and C2H (1–0), the latter peaking ∼0.01 pc further NW toward the "quiescent core" identified by Anderson et al. (1997). Optically thin emission ( ) in H13CO+ (1–0), C2H (1–0), c-C3H2, C5H, CH3OH (2–1), C34S (2–1), and SO (3–2), (2–1) has a center, systemic VLSR of ∼5.8 km s−1 (e.g., Figure 4), which is also the average velocity of the R CrA core (Harju et al. 1993). The 95% distribution in C34S (2–1) describes a ∼NS filament extending south to the CH3OH (2–1) peak around which a ring structure in c-C3H2 (2–1) and C5H is observed. N2H+ (1–0) and C2H (1–0) present similar, NWW-SEE elongated overall morphologies that are more compact in the vicinity of MMS 13 than those in H13CO+ (1–0) and HNC (1–0), exhibiting a ∼50% more abrupt drop in intensity outside of the ∼80% distribution. HC3N (10–9) has a distribution intermediate to that in HCO+ (1–0) and H13CO+ (1–0) with maximum brightness at the midpoint between IRS 7 and the N2H+ (1–0) peak within pointing accuracy of MMS 13.

Figure 2. Integrated intensities with gray scale in K km s−1 . Contours in steps of σ starting at  . The cross denotes an HH object; star: R CrA; open circle E to W: IRS 7, YSO J190152.63-365700.2; closed circle E to W: MMS 13, X-ray J190152.20-365809.0, IR 185828.5-370240 (hereafter IR 1858-37), MMS 12; EW ellipse: N2H+ (1–0) peak integrated intensity; NS ellipse N to S: SO (3–2) N, CH3OH (2–1), SO (3–2) S peak integrated intensities; the circle denotes the proto-HAe candidate. CS (2–1), HCN (1–0), and HCO+ (1–0) trace IRS 7, MMS 13, and R CrA. 95% distributions in H13CO+ (1–0) and HNC (1–0) are coincident with peaks in N2H+ (1–0) and C2H (1–0) (Figure 3), tracing the proto-HAe system candidate. There are no documented objects within peak contours in N2H+ (1–0), H13CO+ (1–0), and C34S (2–1) emission (Figure 3) which coincide with a Spitzer infrared extinction region (Figure 7).
Download figure:
Standard image High-resolution image
Figure 3. Integrated intensities with gray scale in K km s−1 . Contours in steps of σ starting at  . Annotations as in Figure 2. The 95% distribution in C34S (2–1) extends ∼0.04 pc with a 3:1 aspect ratio, coinciding with peaks in N2H+ (1–0), C2H (1–0), H13CO+ (1–0), HNC (1–0), and CH3OH (2–1), tracing the proto-HAe system candidate (e.g., Figure 6, bottom left).
Download figure:
Standard image High-resolution image
Figure 4. Top left, right: HNC (1–0), HCO+ (1–0) spectra to the NE (top row), SW (bottom row) of peak N2H+ (1–0). Top middle: N2H+ (1–0) velocity dispersion color scale on 80% integrated intensity contours with N2H+ (1–0) white, HCN (1–0) green, H13CO+ (1–0) blue, and HNC (1–0) gray; H13CO+ (1–0) velocity dispersion color scale with yellow, violet scales starting at ∼0.2, 0.4 km s−1 on 80% integrated intensity contours with N2H+ (1–0) white, H13CO+ (1–0) blue, C34S (2–1) turquoise, and CH3OH (2–1) green. Dispersion values within 90% intensity are ∼20% less than those at the half-maximum, indicating a decay of central turbulence in N2H+ (1–0) and H13CO+ (1–0) at the flow convergence site (e.g., Figure 7 and see lV diagram enhancements in HNC (1–0) below), around which peak reversal profiles characteristic of bulk infall are observed. Bottom: spectra, lV diagrams taken across the emission center directed with a  position angle (P.A.).
  yellow, blue scales start at 1.0 K, 2.0 K for HNC (1–0) and N2H+ (1–0); 0.75 K, 1.5 K for H13CO+ (1–0); and 0.5 K, 1.0 K for CH3OH (2–1). Red wings in line profiles signal outflowing motions.
Download figure:
Standard image High-resolution imageCH3OH (2–1) distributions corresponding to wing emission (Figure 4) are observed around the N2H+ (1–0) peak aligned with previously described outflow lobes (Figure 5 of Groppi et al. 2007), IR 1858-37, and several HH objects (Figure 5). SO (3–2) emission lies along a NW–SE ridge with a deficit at IR 1858-37; velocity-extended emission (Figure 5) is aligned ∼EW with previously observed IRS 7 outflow (Figure 5 of Groppi et al. 2007) around an antisymmetry center in HNC (1–0) (Figure 6). SO (2–1) exhibits a peak close to the northern peak in SO (3–2) corresponding to the redshifted lobe (Figure 5). In CH3OH (2–1), which may probe interaction with outflow in SO (3–2) (Figure 5), northern emission coincides with the compact N2H+ (1–0) and C2H (1–0) distributions. Emission in elongated (∼3:1 aspect ratio) distributions in C34S (2–1) and CH3OH (2–1) coincides, tracing gas ∼0.05 pc south of MMS 13 (e.g., Figure 6, bottom left).

Figure 5. Top: binned channel maps in N2H+ (1–0) from 4.3–6.8 km s−1.  gray scale in K. The filled circle denotes IRS 7; star: R CrA; open circle: IR 1858-37; cross: the HH object. Bottom left, lV diagram in HCO+ (1–0) taken across the emission center with a 45° P.A.
  yellow, blue scales start at 1.5, 4.5 K. Right: integrated intensity with gray scale in K km s−1 ; annotations are as at the top and the proto-HAe system candidate is in white. Contours in steps of σ at
  . Top, bottom: HNC (1–0), N2H+ (1–0) on SO (3–2), CH3OH (2–1) contours, respectively: emission blueshifted in the NE and that redshifted in the SW is ∼centered in position and velocity (5.8 km s−1) on the system candidate.
Download figure:
Standard image High-resolution image
Figure 6. Top: spectra, half-emission width binned channel maps from 4.6–7.0 km s−1, peak integrated intensities from 5.0–6.6 km s−1 with color scale in K km s−1 . Bottom left: integrated intensities, (N2H+ (1–0) + C34S (2–1) + CH3OH (2–1))/3 on (≥6σ) contours with 75% C34S (2–1) green, 80% CH3OH (2–1) turquoise, H13CO+ (1–0) blue, HNC (1–0) gray, and 90% N2H+ (1–0) white. The circle denotes the proto-HAe system candidate, traced by turbulent gas in N2H+ (1–0), HNC (1–0) and quiescent gas in C34S (2–1), H13CO+ (1–0), and CH3OH (2–1). Right: peak velocity of HNC (1–0) as a function of offset from emission center. The antisymmetry center is located at the origin of a rotating disk "z-signature" corresponding to an error ellipse distribution and three-point quadratic peak intensity fit per channel.
Download figure:
Standard image High-resolution imageOutflow in HCO+ (1–0) around IRS 7 is aligned with that in SO (3–2) (Figure 5). The velocity flow at center velocity (hereafter center velocity flow) in H13CO+ (1–0) and HNC (1–0), whose  is twice supersonic at 20 K, is channeled ∼90° in the vicinity of the peak in N2H+ (1–0) (Figure 7), whose
  is similarly turbulent (Table 1), to align with velocity-extended emission (Figure 5); in HCN (1–0), system velocity flow is redirected similarly at the antisymmetry center. N2H+ (1–0) and H13CO+ (1–0) exhibit a central decay of turbulence (Figure 4) in the region coincident with the flow convergence site and C34S (2–1) filament (Figure 7); toward and around their peaks, which models mark as central to the proto-HAe system candidate (Figure 8, Section 3.2), characteristic infall profiles are observed (Figures 4, 9). Model Gaussian fits to integrated intensities are given in Table 2.

Figure 7. Top: N2H+ (1–0) integrated intensity with gray scale in K km s−1 on contours: left, 24 μm Spitzer MIPSGAL (irsa.ipac.caltech.edu/data/SPITZER/docs/spitzerdataarchives) (Fazio & Megeath 2004) in red, integrated intensities in HCN (1–0) in green, and N2H+ (1–0) in blue; right, 70 μm Spitzer MIPSGAL (Fazio & Megeath 2004) in red, integrated intensities in CS (2–1) in green, and N2H+ (1–0) in blue. Peak emission in N2H+ (1–0) lies at the midpoint between infrared maxima. Bottom left: CS (2–1) velocity dispersion on contours: HNC (1–0) velocity field (black) in steps of ∼0.1 km s−1, 95% integrated intensities in N2H+ (1–0) (white), H13CO+ (1–0) (blue), and 97% C34S (2–1) (green). N and S circles denote IRS 7 and IR 1858-37. Bottom right: H13CO+ (1–0) velocity field on the same intensity contours. As seen in the two bottom panels, wind generation in the proto-HAe system candidate is indicated by channeling of the center velocity flow (the 5.8 km s−1 contour in HNC (1–0) and in H13CO+ (1–0) having similarly diverged  in the vicinity of the N2H+ (1–0) peak from the large-scale flow) toward IRS 7 and regions of high velocity dispersion; channeling is aligned with outflowing motions (Figure 5), indicative of turbulence amplification along the proto-HAe system rotation axis. Gas in the region corresponding to the ∼5:1 aspect ratio C34S (2–1) filament (green) is undergoing infall (e.g., Figures 4, 9); shifts in turbulence (changing
  and
and  ) from gas in the filament to IRS 7 are similar to those within the proto-HAe system candidate envelope (e.g., Figures 4, 8 and Section 3.3).
Download figure:
Standard image High-resolution image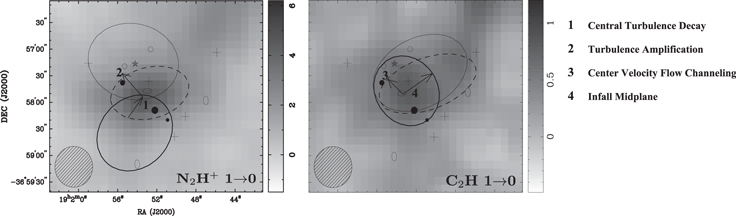
Figure 8. Model Gaussian fits. Fit parameters are given in Table 2. Arrows denote physical processes discussed in text in their corresponding regions. Annotations are as in Figure 2 and the EW ellipse on the left is the C2H (1–0) peak-integrated intensity; that on the right is the N2H+ (1–0) peak-integrated intensity. Left, right: N2H+ (1–0), C2H (1–0) integrated intensity with gray scale in K km s−1 on model contours. Left panel: CH3OH (2–1) (thick), CS (2–1) (thin), N2H+ (1–0) (dashed). Right panel: C2H (1–0) (thick), HNC (1–0) (thin), H13CO+ (1–0) (dashed). Models in N2H+ (1–0) and C2H (1–0) lie central to turbulent ((CS (2–1), HCO+ (1–0)) and quiescent ((CH3OH (2–1), SO (3–2)) regimes whose models converge within pointing accuracy of N2H+ (1–0), C2H (1–0), C34S (2–1), and H13CO+ (1–0) peaks at the proto-HAe system candidate. Similarly, models representing quiescent gas in the proto-HAe system candidate (in H13CO+ (1–0), C34S (2–1), and CH3OH (2–1)) converge with those corresponding to turbulent gas in MMS 13 (in HC3N (10–9), HCO+ (1–0), and CS (2–1)) at the central turbulence decay in N2H+ (1–0) and H13CO+ (1–0), consistent with prestellar core interaction as discussed in text. P.A.s in N2H+ (1–0) and HC3N (10–9), whose model is similar to that in N2H+ (1–0) just shifted ∼20 arcsec north, are within  ; the P.A. in model N2H+ (1–0) also closely matches that derived from the SMM 1A submillimeter continuum (Figure 2 of Nutter et al. 2005) as might be expected given such interaction. Channeling of the center velocity flow (out of large-scale flow that is aligned with N2H+ (1–0) and H13CO+ (1–0) models (Figure 7)) toward IRS 7 follows the general NE–SW concentration of objects in the field along which turbulence amplification occurs toward IRS 7 and turbulent gas in CS (2–1) (Figures 4, 7) and is aligned closely with the C2H (1–0) model. The turbulence shift between gas in the vicinity of IRS 7 and the central turbulence decay in N2H+ (1–0) and H13CO+ (1–0) in the region corresponding to the central C34S (2–1) filament which is experiencing infall (e.g., Figures 4, 7) is similar to that within the extended system envelope (e.g., in CH3OH (2–1) and HNC (1–0), in agreement with their similar model P.A.s). The infall midplane is perpendicular to extended velocity emission in CH3OH (2–1) (which is aligned with outflow lobes in Groppi et al. 2007) and the axis of wind generation.
Download figure:
Standard image High-resolution image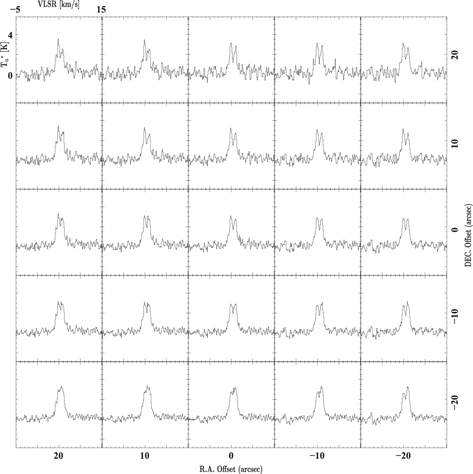
Figure 9. HCO+ (1–0) mosaic spectra toward the N2H+ (1–0) peak. Similar infall characteristic profile peak reversals are seen toward the N2H+ (1–0) peak in HNC (1–0) spectra.
Download figure:
Standard image High-resolution imageTable 2. Model Gaussian Fits with IMFIT (Sault et al. 1995)
| Line | aa | bb |
 c
c
|
 d
d
|
|---|---|---|---|---|
| ('') | ('') | (°) | ( K km s−1 ) | |
| C2H (1–0) | 138 | 92 | 41.1 | 0.05 |
| C3H2 (2–1) | 75 | 63 | −79.9 | 0.02 |
C5H ( ) ) |
82 | 46 | 67.2 | 0.02 |
| CS (2–1) | 184 | 161 | 77.2 | 0.15 |
| C34S (2–1) | 55 | 106 | −10.0 | 0.02 |
| CH3OH (2–1) | 166 | 133 | −41.2 | 0.08 |
| HC3N (10–9) | 172 | 70 | −79.5 | 0.08 |
| HCN (1–0) | 184 | 122 | 89.8 | 0.15 |
| HCO+ (1–0) | 253 | 156 | −77.1 | 0.27 |
| H13CO+ (1–0) | 184 | 101 | −69.4 | 0.09 |
| HNC (1–0) | 230 | 110 | −60.9 | 0.15 |
| N2H+ (1–0) | 135 | 94 | −77.8 | 0.15 |
| SO (3–2) N | 97 | 89 | 75.7 | 0.12 |
| SO (2–1) N | 80 | 49 | 78.3 | 0.02 |
Notes.
aDeconvolved FWHM major axis. bDeconvolved FWHM minor axis. cDeconvolved P.A. dResidual rms.Download table as: ASCIITypeset image
3.2. Proto-HAe System
Abundance-derived mass estimates for a cyclindrical distribution, M ∼  , are listed in Table 1. Abundance- and virial-derived values are closest of the observed species in N2H+ (1–0), CH3OH (2–1), H13CO+ (1–0), and C34S (2–1), whose mean MN is within 10% of that of HNC (1–0), 3.7
  . The former three species' average, 4.1
  , is within 5% of the value derived for MMS 13 from millimeter and submillimeter continuua (Chini et al. 2003; Nutter et al. 2005) at 130 pc and a dust temperature of 15 K.
Mass values together with emission in several lines offset from the continuum peak in Figure 1 are consistent with these observations' tracing of depletion and prestellar gas in central MMS 13 (e.g., Tafalla et al. 2002; Nutter et al. 2005). Interestingly, distributions in SO (3–2), CH3OH (2–1), C34S (2–1), C2H (1–0), c-C3H2 (2–1), and C5H lie considerably south (∼0.05 pc) of MMS 13, bolstering an additional case together with mass and age estimates for these species' depletion in a core central to the observed peaks in N2H+ (1–0), C2H (1–0), H13CO+ (1–0), C34S (2–1), and HNC (1–0) and the MMS 13 S region (see below) as host of a proto-HAe system (in a contraction phase prior to conclusive inner core collapse), shaped through prestellar core interaction3
as well as infall (e.g., Sadavoy et al. 2012). Such interaction would explain naturally (invoking a less severe depletion scenario than that corresponding to all observed emission tracing central MMS 13) (1) systematic distribution and model coincidence in emission tracing the proto-HAe system candidate (∼from S to N: CH3OH (2–1), C34S (2–1), C2H (1–0), N2H+ (1–0), H13CO+ (1–0), and HNC (1–0)) with that tracing MMS 13 (∼from S to N: HC3N (10–9), HCO+ (1–0), HCN (1–0), and CS (2–1)) in a region corresponding to the central decay of turbulence in N2H+ (1–0) and H13CO+ (1–0) and (2) flow convergence in N2H+ (1–0), H13CO+ (1–0), and HNC (1–0) in a region corresponding to the central C34S (2–1) filament (Sections 3.3, A.2; Figures 6–8). In this case, mean density in the central system candidate,  (in C34S (2–1), N2H+ (1–0), C2H (1–0), and H13CO+ (1–0)) is 4.9 ×
  cm−3, in agreement with (less than 20% above) previously derived values in the region (Loren et al. 1983).4
Mass calculations together with several kinematic features discussed in Section 3.3 also support this scenario. MN and Mvir values in CH3OH (2–1) (which traces dense IM cores and hot core precursors; Section 1.1) are the second closest of observed species after N2H+ (1–0) (which traces IM class 0 cores; Section 1.1), followed by H13CO+(1–0) as well as C34S (2–1) (which trace dense cores and outflow as well as early-time chemistry, respectively, Section 1.1) whose peaks coincide with that in N2H+ (1–0) (Table 1).
cm−3, in agreement with (less than 20% above) previously derived values in the region (Loren et al. 1983).4
Mass calculations together with several kinematic features discussed in Section 3.3 also support this scenario. MN and Mvir values in CH3OH (2–1) (which traces dense IM cores and hot core precursors; Section 1.1) are the second closest of observed species after N2H+ (1–0) (which traces IM class 0 cores; Section 1.1), followed by H13CO+(1–0) as well as C34S (2–1) (which trace dense cores and outflow as well as early-time chemistry, respectively, Section 1.1) whose peaks coincide with that in N2H+ (1–0) (Table 1).
MMS 13 is also a prominent region as observed at submillimeter wavelengths, with an elongated, possibly binary source to the south apparent in 450 μm emission (Figure 3 of Nutter et al. 2005). The proto-HAe system candidate resides at the SW edge of this elongation at a similar intensity level (in 450 μm continuum) as VLA 10 A and 10 B, while IRS 7 lies in a region ∼5σ lower; in 1.2 mm continuum, these sources lie at the same level as the candidate (Figure 1). Temperatures of 11–15 K derived through spectral energy distribution fitting (ibid), the absence of a centimeter source, and age estimates (Section  in N2H+ (1–0) and turbulent flow convergence with that in HNC (1–0) (Table 1, Figure 7)) and/or early-time chemistry (in accordance with observed distributions in C34S (2–1), C5H, c-C3H2 (2–1), C2H (1–0), and SO (3–2), (2–1) (Figures 2, 3)) in the region (e.g., Dickens et al. 2001).
3.3. Wind Generation
Center velocity flow in HNC (1–0) and H13CO+ (1–0) is channeled (as seen in the 5.8 km s−1 contour being abruptly redirected  , Figure 7) to align with velocity-extended emission in CH3OH (2–1) and SO (3–2) (Figure 5) which is perpendicular to the 90% integrated intensity in N2H+ (1–0) and C34S (2–1) (Figures 2, 3). Along with the fact that this extended emission is observed around the region corresponding to central turbulence decay in N2H+ (1–0) and H13CO+ (1–0) (Figure 4), infalling motions (Figures 4, 9), and differential rotation (Figure 6), this is consistent with magnetohydrodynamic wave fluctuation induced wind generation in the proto-HAe system candidate (e.g., Shu et al. 1987; Corcoran & Ray 1998; Markovskii 2001; Isenberg & Vasquez 2011). That extended emission may correspond in part to outflowing motions is in agreement with a reversal of the velocity field gradient over the 5.8 km s−1 contour in HNC (1–0) perpendicular to the rotation axis (e.g., Saul et al. 2011; see Section
  in species peaking at the proto-HAe system candidate which trace quiescent gas (in C34S (2–1), C2H (1–0), and H13CO+ (1–0)) is a factor of ∼3 less than in those peaking near IRS 7 (in CS (2–1), HCN (1–0), and HCO+ (1–0)); mean line width in species whose emission extends south of the system (in C34S (2–1) and CH3OH (2–1)) is a factor of ∼3 less than in that extending north (in H13CO+ (1–0) and HNC (1–0)), indicative of a similar turbulence shift from quiescent gas in the system to IRS 7 to that within the extended system envelope (e.g., Mannings 1995; Table 1 and see Figures 6, 8). In this scenario, channeling of center velocity flow with turbulence amplification along the proto-HAe system rotation axis shears the velocity field, launching wind (e.g., Parker 1969; Sur et al. 2012; Figures 5, 7).
HNC (1–0) and HCO+ (1–0) spectra around the N2H+ (1–0) peak exhibit bulk infall characteristic peak reversal profiles, the blue- or redshifted peaks corresponding to infalling gas approaching or receding along the line of sight (e.g., Myers et al. 1995; Figure 4). HNC (1–0), together with N2H+ (1–0) showing the greatest  of observed species with the exception of HCO+ (1–0) (which traces IRS 7 as well as MMS 13), exhibits increasingly blue- and red-skewed profiles toward and away from, respectively, the N2H+ (1–0) peak (Table 1). This trend is similar to that observed in H13CO+ (1–0), indicative of an inflow boundary where inward (peak N2H+ (1–0) directed) motions are reversed due to mounting winds from the increasingly turbulent proto-HAe system (e.g., Bally 2002) (Section
Observed intermediate distributions (systematic spatial shift in emission from N to S, in HNC (1–0), H13CO+ (1–0), N2H+ (1–0), C34S (2–1), and CH3OH (2–1)) (Figure 6) and a uniform velocity dispersion gradient from IRS 7 to southern portions of the envelope ( from N to S ∼ 3:2:1, in HCO+ (1–0), HNC (1–0), and CH3OH (2–1)) (Table 1) combined with central emission features (infall, turbulence decay, channeling of center velocity flow; e.g., Figures 4, 7) is consistent with prestellar core interaction (e.g., merging) in addition to self-gravitational infall driving proto-HAe system formation in the region (e.g., Bonnell et al. 1998; Stahler & Palla 2005; Perets & Murray-Clay 2011). Support for interaction in the system candidate includes (1) 90% and 95% integrated intensities in C34S (2–1) and H13CO+ (1–0) coincident with CH3OH (2–1) and HNC (1–0) peaks, respectively (Figures 2, 3, and see Figure 6), (2) a continuous system to global turbulence transition (Section
In conjunction with mass and age estimates, observation of several physical mechanisms in R CrA implies the presence of a proto-HAe system. The existence of centrally peaking (to the system) turbulent cores in N2H+ (1–0) and HNC (1–0), specifically a  in N2H+ (1–0) greater than that in all observed species except for HCO+ (1–0), a
  and
and  in HNC (1–0) greater than that in emission closely tracing highly dispersive gas in the vicinity of IRS 7 (HCO+ (1–0) and HCN (1–0), respectively, whose
  and
and  are the greatest of observed species, respectively (Table 1)), and the absence of central turbulence dissipation in N2H+ (1–0) or HNC (1–0) mean, together with mass values in Section 3.2, it is highly unlikely this source is low-mass, in which case we might expect a decay to near sonic values in central turbulence in N2H+ (1–0) (Nakano 1998) as well as gas in the candidate (e.g., as traced in
  (N2H+) and
  (HNC)) to be less turbulent than that in the active IRS 7, XW region (e.g., as traced in
  (CS) and
  (HCN)). Conversely, the presence of differential rotation (evinced in HNC (1–0), Figure 6) implies the candidate is most likely not greater than 5
  since disks may not exist around HBe stars (Strom et al. 1993; Natta et al. 2000; Cauley & Johns-Krull 2014), whereas often young and massive (Boissier et al. 2011) disks around HAe stars are observed with 75%–100% frequency (Natta et al. 1997). A more massive, i.e., highly turbulent source would not be affected significantly by less dispersive gas near IRS 7 and neither turbulence amplification along the rotation axis nor channeling of center velocity flow toward IRS 7 (Figure 7) could occur. High rates of mass infall and loss are consistent with accretion driven winds in a proto-HAe system (e.g., Corcoran & Ray 1998; Matt & Pudritz 2005; Section
4. CONCLUSION
We have observed a variety of molecular lines toward an active star formation region in Corona Australis, detecting N2H+ (1–0) and C34S (2–1) whose peak emission coincides with a site of turbulent flow convergence and Spitzer infrared emission minimum. Shifting turbulence, strong winds, and signatures of bulk infall are some of the emission features which, together with mass and age estimates, indicate the presence of a proto-HAe system candidate associated with MMS 13 S. Channeling of center velocity flow with turbulence amplification along the rotation axis drives wind generation in the system candidate.
Mopra is operated by the Australian Telescope National Facility. Many thanks to R. Chini and A&A for providing the 1.2 mm continuum map in Figure 1. M.S. thanks J. Storey, D. Morton, and M. Cunningham for stimulating discussions on the R CrA region as well as the referee for comments on this paper.
APPENDIX A:
A.1. Column Density
Opacities are given by transition intensity ratios,

where the abundance ratio,

Similarly, with hyperfine components m, s,
For single transitions,

where F(T) =  , J(T) =
  , and
, and

From the definition of optical depth,

where gi is the upper level degeneracy which in local thermodynamic equilibrium is governed by the Boltzmann distribution characterized by kinetic temperature Tk ∼ Tij, and  is the observed integrated intensity, for a hyperfine component,

N values in Table 1 correspond to Tk ∼ 30 K for HCN (1–0) and CS (2–1), 20 K for HCO+ (1–0), SO (3–2), and HNC (1–0), and 10 K for the rest of the observed species except in the case of 15 K for HC3N (10–9) (supported by a similar elongation to HCO+ (1–0) whose peak Tmb ∼ 15 K), consistent with submillimeter continuum observations and a three-phase density regime with a mean log N(H2) ∼ 22.7 cm−2 (Figure 3 in Nutter et al. 2005 and Figure 2 in Groppi et al. 2007).
A.2. Accretion
An age estimate is given as the length of velocity-extended emission divided by the corresponding deviation  from line center. Assuming constant outflow5
velocity at 130 pc, in CH3OH (2–1) this yields ∼
from line center. Assuming constant outflow5
velocity at 130 pc, in CH3OH (2–1) this yields ∼  km s−1
  year, in SO (3–2) and H13CO+ (1–0),
  year; in HCO+ (1–0) around IRS 7,
  year (e.g., Figures 3, 5). These values and a falling
  profile from the system candidate to IRS 7 (a ∼50% decrease in
  from HNC (1–0)/H13CO+ (1–0) to HCO+ (1–0)/CS (2–1) and order of magnitude drop in
  from N2H+ (1–0) or CH3OH (2–1) to CS (2–1); Saul 2012) in agreement with models finding an order of magnitude decrease in
  from Class 0 to 1 regions (Bontemps et al. 1996; Vorobyov & Basu 2005a) as well as diminishing C34S (1–0)/H13CO+ (1–0) intensity and width ratios to the NE (Pratap et al. 1997) indicate the proto-HAe system candidate as a young, potential Class 0 object (Nutter et al. 2005; Sicilia-Aguilar et al. 2013).
Using abundance derived mass values, the mechanical luminosity, L ∼  , in CH3OH (2–1) ∼
  , while the outflow rate,
  ∼
∼  , in SO (3–2) yields
  yr−1. With cylinder height H = 10R (Figure 7), the accretion rate
  =
=  , where μ is the mean molecular weight and mH is the mass of a hydrogen atom; using L(C34S), n ∼ 5.0 × 105 cm−3 and a Vin given by mean line width
  in species peaking at the flow convergence site at an inclination of 60° yields
  yr−1. Using L(c-C3H2) [
 (C5H)] and
  (HNC) with the same density gives the same rate. The spherical rate
  =
=  , using R = 0.02 pc (∼separation between peaks in N2H+ (1–0) and CH3OH (2–1) which is similar to that between those in N2H+ (1–0) and HC3N (10–9), which is
  (c-C3H2)/2) and Vin =0.20 km s−1 (∼inflow boundary velocity ∼rms turbulence ∼cs in an 11 K molecular gas ∼HNC (1–0) absorption dip deviation from systemic velocity (Figure 4)) yields
  yr−1). The average value,
  yr−1, indicates a considerable mass loss rate up to ∼20% that of accretion. Mean
  in species peaking at the flow convergence site (N2H+ (1–0), C34S (2–1), H13CO+ (1–0), C2H (1–0)) is
  (N2H+), ∼twice that in all observed species except HNC (1–0) and lines tracing IRS 7 (as well as MMS 13), in support of turbulence amplification along the rotation axis driving wind generation within an extended envelope (e.g., Mannings 1995). Turbulent velocity given by composite structure in the Galaxy,
 0.9
0.9 km s−1 (Heyer & Brunt 2004) with L(N2H+) in pc, is ∼that of the inflow boundary, consistent with a continuous system to global turbulence transition and the system as a source of turbulent energy. Sound speed in the infalling gas cs ∼
  (Shu et al. 1987) is
  {with mass and size given by least and most turbulent system components, respectively, in agreement with a quiescent core (e.g.,
  (C34S)
  >
>  ) fueled through turbulent transport (e.g.,
 ∼ 5)}, is
  in CH3OH (2–1) which has a
  similar to that in HC3N (10–9) despite exhibiting only half its
  , consistent with proto-HAe system candidate—central MMS 13 core interaction. A Vin given by σ(N2H+) yields a spherical infall zone radius of ∼0.011 pc, the width of
  indicated channeling in HNC (1–0) (Figure 4). The accretion luminosity, Lacc =
  , in H13CO+ (1–0) gives
  erg s−1.
Footnotes
- 1
- 2
- 3
Separation between the N2H+ (1–0) peak and MMS 13 (∼distance between peaks in N2H+ (1–0) and CH3OH (2–1) ∼ 0.02 pc at
 inclination) is less than the size of the infalling system candidate envelope (∼0.04 pc ∼distance between peaks in CH3OH (2–1) and HNC (1–0), e.g., Figures 6, 8) as well as the typical separation between objects in the region (∼0.08 pc), which is less than the overall core Jeans length at 15 K and 3 × 104 cm−3 (∼0.15 pc); a considerable in N2H+ (1–0) brings the MMS 13 S–MMS 13 prestellar core interaction (represented by the N2H+ (1–0) core–HC3N (1–0) core interaction) timescale (separation/ ∼104 year) significantly less than the lifetime of a typical protostar core (Ward-Thompson et al. 2007; Enoch et al. 2008), again in support of competitive accretion (e.g., Bonnell et al. 2001) in the region (Table 1).
 - 4
This value is less than a factor of two above the mean critical density in turbulent emission tracing the proto-HAe system candidate, N2H+ (1–0), and HNC (1–0), at kinetic temperatures of 10 and 20 K, respectively, and also less than a factor of two below that in emission tracing central MMS 13, HC3N (10–9) at 15 K.
- 5


