


ABSTRACT
Time-series spectra of the near-infrared 1.6 μm region have been obtained for five of the six known D-type symbiotic novae. The spectra map the pulsation kinematics of the Mira component in the Mira–white dwarf binary system and provide the center-of-mass velocity for the Mira. No orbital motion is detected in agreement with previous estimates of orbital periods ≳100 yr and semimajor axes ∼50 AU. The 1–5 μm spectra of the Miras show line weakening during dust obscuration events. This results from scattering and continuum emission by 1000 K dust. In the heavily obscured HM Sge system the 4.6 μm CO spectrum formed in 1000 K gas is seen in emission against an optically thick dust continuum. Spectral features that are typically produced in either the cool molecular region or the expanding circumstellar region of late-type stars cannot be detected in the D-symbiotic novae. This is in accord with the colliding wind model for interaction between the white dwarf and Mira. Arguments are presented that the 1000 K gas and dust are not Mira circumstellar material but are in the wind interaction region of the colliding winds. CO is the first molecule detected in this region. We suggest that dust condensing in the intershock region is the origin of the dust obscuration. This model explains variations in the obscuration. Toward the highly obscured Mira in HM Sge the dust zone is estimated to be ∼0.1 AU thick. The intershock wind interaction zone appears thinnest in the most active systems. Drawing on multiple arguments masses are estimated for the system components. The Miras in most D-symbiotic novae have descended from intermediate mass progenitors. The large amount of mass lost from the Mira combined with the massive white dwarf companion suggests that these systems are supernova candidates. However, timescales and the number of objects make these rare events.
Export citation and abstract BibTeX RIS
1. INTRODUCTION
Symbiotic stars are binary systems containing an evolved star and a degenerate or dwarf companion in an orbit close enough for mass transfer to occur. The spectroscopic signature of these systems is a combination spectrum showing features from a hot star, a cool star, and mass flow in the system. Webster & Allen (1975) distinguished two types of symbiotics, those with infrared excess from dust (D-type) and those with cool stellar continuum (S-type). The D-symbiotics have near-infrared (near-IR) J-, H-, and K-band variations of ∼1 mag that are consistent with the presence of a Mira variable. Infrared excesses are typically associated with large mass-loss rates, which occur during large amplitude Mira pulsation in tip asymptotic giant branch (AGB) evolution. Hence, the D-systems have become synonymous with symbiotic systems that contain a Mira variable. The Belczyński et al. (2000) catalog of symbiotic stars lists a total of 188 symbiotics, 24 of which are confirmed D-types. Lü et al. (2007) proposed a total galactic population of ∼2000 D-symbiotics. The small number of systems does not reflect a rarity of this evolutionary process but rather the brevity of the AGB stage.
A Mira variable has a diameter of several AU and a typical mass of ∼1–3 M☉ (Vassiliadis & Wood 1993). Thus, a D-type system where the Mira fills its Roche lobe would have a period of about five years. However, no systems exhibiting both Mira and contact binary properties are known. Hence, all the known D-symbiotics have orbital periods that are at least decades long. The prototype Mira, o Ceti, is a slightly symbiotic binary (Sokoloski & Bildstein 2010). Mira and its white dwarf companion are spatially resolved, having a separation of 0 578 in 1997. From Hipparcos the distance to o Ceti is 128 pc, so the line-of-sight separation of the components is 74 AU. Observations from 1923 through 1990 show a slow change in the position angle and separation of the binary, implying an orbital period of >400 yr (Prieur et al. 2002). All other known D-type systems have a stronger interaction between the components, so o Ceti may well set a limit on the detectability of D-symbiotics. For D-type systems to show more activity than o Ceti, system parameters that enhance mass exchange must be different. These include the separation between the components and hence the orbital period, the mass outflow from each component, and the masses of the components.
In analogy to the separation into D- and S-type symbiotics by the characteristics of the cool star, the symbiotic stars also can be divided into classes by the activity of the hot star. Typically, symbiotic binaries, class Sy, contain a hot (∼105 K), luminous (∼100–10,000 L☉) white dwarf similar to some central stars of planetary nebulae (PNs). The hot star accretes material from the late-type star. Some of these white dwarfs are burning accreted hydrogen (Mikołajewska 2010) and can have luminosities comparable to that of the Mira variable (Angeloni et al. 2010). A subset of these white dwarfs undergoes nova outbursts. These objects come in two varieties, the slow events with outbursts lasting decades (SyNe) or rapid events that recur on the order of years to decades (SyRNe).
In this paper we discuss four symbiotic novae (SyNe) and one recurrent symbiotic nova (SyRN). In total, among all the known symbiotics there are only nine systems generally classified as SyNe and five generally classified as SyRNe (Mikołajewska 2010). Of the nine SyN systems four are S-type: AG Peg, RT Ser, V1329 Cyg, and PU Vul. Five are D-type: V1016 Cyg, V2110 Oph, RX Pup, HM Sge, and RR Tel. Of the SyRN systems four are S-type: RS Oph, T CrB, V3890 Sgr, and V745 Sco. The one D-type SyRN is V407 Cyg. Among the S-type symbiotics, the SyRNe are known to contain white dwarfs that have masses near the Chandrasekhar limit. Hence these objects are potentially Type Ia supernova (SN Ia) progenitors and have considerable astrophysical importance.
As part of our ongoing series of papers on symbiotic stars, we will report on the first high-resolution, infrared spectroscopy in the 1–5 μm region for more than a dozen D-symbiotics. In the present paper we discuss the results for five of the six known D-type SyN and SyRN objects. Those five systems by definition have undergone nova events that have resulted in changes across essentially the whole spectrum, including the infrared. The program stars are exceptionally well studied, complex objects. In the following sections we provide an overview of our new observations and then a review of the literature for each of the five stars. We then discuss these D-type SyNe from the new perspective of high-resolution, infrared spectroscopy.
2. OBSERVATIONS AND REDUCTIONS
Spectra were taken at three different locations: Kitt Peak National Observatory (KPNO), Mount Stromlo Observatory (MSO), and the Gemini South (GS) Observatory. With the exception of two archival spectra, observations were taken from 1994 through 2012. A variety of spectrographs and detectors were used with telescopes having apertures of 0.9–8 m. In spite of the range of equipment employed, the majority of spectra in this paper sample the H band near 1.6 μm. A few additional spectra were taken in the 1.005, 2.3, and 4.7 μm regions. The observations for the five systems are detailed in Tables 1–5.
Table 1. V407 Cyg Radial Velocities
| Date | HJD | Photometric | Spectroscopic | RV | Wavelengthc | Source |
|---|---|---|---|---|---|---|
| −2,400,000 | Phasea | Phaseb | (km s−1) | (Å) | ||
| 1995 Jun 8 | 49876.99 | 0.070 | 0.191 | −54.6 | 16206 | NICMASS–CF |
| 1995 Jun 9 | 49877.99 | 0.071 | 0.192 | −54.3 | 16388 | NICMASS–CF |
| 1995 Jul 25 | 49923.95 | 0.133 | 0.252 | −52.9 | 16207 | NICMASS–CF |
| 1995 Oct 7 | 49997.82 | 0.232 | 0.348 | −50.1 | 16207 | NICMASS–CF |
| 1996 Mar 20 | 50163.02 | 0.454 | 0.562 | −40.6 | 16209 | NICMASS–CF |
| 1996 Aug 24 | 50319.95 | 0.664 | 0.766 | −31.4 | 16204 | NICMASS–CF |
| 1996 Sep 25 | 50351.82 | 0.707 | 0.808 | −26.2 | 16341 | PHX–2.1m |
| 1996 Oct 23 | 50379.77 | 0.745 | 0.844 | −30.3 | 16376 | PHX–2.1m |
| 1996 Oct 29 | 50385.73 | 0.753 | 0.812 | −31.8 | 16204 | NICMASS–CF |
| 1997 Apr 29 | 50568.01 | 0.997 | 0.088 | −60.6 | 16209 | NICMASS–CF |
| 1997 Jun 28 | 50627.86 | 0.078 | 0.166 | −57.8 | 16205 | NICMASS–CF |
| 1997 Aug 27 | 50687.85 | 0.158 | 0.244 | −56.0 | 16211 | NICMASS–CF |
| 1997 Oct 9 | 50730.78 | 0.216 | 0.300 | −53.6 | 15623 | PHX–2.1m |
| 1997 Oct 29 | 50750.75 | 0.243 | 0.326 | −52.9 | 16214 | NICMASS–CF |
| 1998 Apr 29 | 50932.98 | 0.487 | 0.562 | −43.9 | 16209 | NICMASS–CF |
| 1998 Jun 17 | 50981.92 | 0.553 | 0.626 | −40.3 | 16207 | NICMASS–CF |
| 1998 Aug 27 | 51052.91 | 0.648 | 0.718 | −33.5 | 16207 | NICMASS–CF |
| 1998 Oct 20 | 51106.78 | 0.720 | 0.788 | −35.4 | 16202 | NICMASS–CF |
| 1998 Nov 18 | 51135.73 | 0.759 | 0.826 | −59.5, −32.0 | 15632 | PHX–2.1m |
| 1999 May 3 | 51301.96 | 0.982 | 0.042 | −58.9 | 16204 | NICMASS–CF |
| 1999 Jun 18 | 51347.87 | 0.044 | 0.101 | −57.3 | 16202 | NICMASS–CF |
| 1999 Jul 4 | 51363.86 | 0.066 | 0.122 | −57.1 | 15680 | PHX–4m |
| 1999 Aug 24 | 51414.93 | 0.134 | 0.188 | −56.5 | 16211 | NICMASS–CF |
| 1999 Sep 17 | 51438.88 | 0.166 | 0.219 | −52.0 | 15679 | PHX–2.1m |
| 1999 Oct 26 | 51477.79 | 0.218 | 0.270 | −52.9 | 16203 | NICMASS–CF |
| 2000 Oct 16 | 51833.76 | 0.696 | 0.732 | −36.1 | 16223 | NICMASS–CF |
| 2011 Jun 15 | 55727.98 | 0.923 | 0.790 | −29.8 | 9842 | LB1A–CF |
| 2012 Jun 7 | 56085.92 | 0.404 | 0.254 | −40.4 | 23055 | PHX–2.1m |
| 2012 Jun 9 | 56087.95 | 0.407 | 0.257 | −48.5 | 15588 | PHX–2.1m |
| 2012 Jun 12 | 56090.87 | 0.411 | 0.261 | −49.1 | 23476 | PHX–2.1m |
Notes. aPhased with P = 745.0 days and zero phase = JD 2,429,710. bPhased with P = 770.0 days and zero phase = JD 2,429,710. cAt start of observed interval.
Download table as: ASCIITypeset image
Table 2. V1016 Cyg Radial Velocities
| Date | HJD | Photometric | Spectroscopic | RV | Wavelengthc | Source |
|---|---|---|---|---|---|---|
| −2,400,000 | Phasea | Phaseb | (km s−1) | (Å) | ||
| 1995 Jun 8 | 49876.92 | 0.123 | 0.835 | −74.8 | 16206 | NICMASS–CF |
| 1995 Jul 26 | 49924.77 | 0.223 | 0.932 | −71.6 | 16207 | NICMASS–CF |
| 1995 Oct 7 | 49997.78 | 0.376 | 0.081 | −69.1 | 16207 | NICMASS–CF |
| 1995 Oct 10 | 50000.77 | 0.382 | 0.087 | −67.3 | 16211 | NICMASS–CF |
| 1996 Mar 20 | 50162.98 | 0.722 | 0.417 | −60.5 | 16209 | NICMASS–CF |
| 1996 Aug 24 | 50319.91 | 0.050 | 0.736 | −74.3 | 16204 | NICMASS–CF |
| 1996 Oct 23 | 50379.70 | 0.175 | 0.857 | −73.6 | 16376 | PHX–2.1m |
| 1996 Oct 30 | 50386.68 | 0.190 | 0.871 | −72.0 | 16204 | NICMASS–CF |
| 1997 Apr 30 | 50568.94 | 0.571 | 0.242 | −64.9 | 16209 | NICMASS–CF |
| 1997 Jun 14 | 50613.99 | 0.665 | 0.333 | −69.6 | 23327 | PHX–2.1m |
| 1997 Jun 28 | 50627.91 | 0.694 | 0.362 | −61.1 | 16205 | NICMASS–CF |
| 1997 Aug 28 | 50688.88 | 0.822 | 0.486 | −82.3 | 16212 | NICMASS–CF |
| 1997 Oct 9 | 50730.75 | 0.910 | 0.571 | −79.9 | 15623 | PHX–2.1m |
| 1997 Oct 30 | 50751.64 | 0.953 | 0.613 | −78.6 | 16214 | NICMASS–CF |
| 1998 May 1 | 50934.90 | 0.337 | 0.986 | −70.2 | 16209 | NICMASS–CF |
| 1998 Jun 17 | 50981.94 | 0.435 | 0.081 | −68.6 | 16207 | NICMASS–CF |
| 1998 Aug 27 | 51052.73 | 0.583 | 0.225 | −63.7 | 16207 | NICMASS–CF |
| 1998 Oct 22 | 51108.72 | 0.700 | 0.339 | −61.1 | 16202 | NICMASS–CF |
| 1999 Apr 26 | 51295.00 | 0.090 | 0.717 | −76.7 | 16204 | NICMASS–CF |
| 1999 Jul 3 | 51362.95 | 0.232 | 0.856 | −76.4 | 15680 | PHX–4m |
| 1999 Oct 27 | 51478.73 | 0.474 | 0.091 | −68.7 | 16203 | NICMASS–CF |
| 2000 Apr 16 | 51650.95 | 0.835 | 0.441 | −77.3 | 15587 | PHX–2.1m |
| 2000 Oct 17 | 51834.80 | 0.219 | 0.815 | −71.1 | 16223 | NICMASS–CF |
| 2012 Jun 7 | 56085.93 | 0.113 | 0.455 | −76.5 | 23055 | PHX–2.1m |
| 2012 Jun 9 | 56087.94 | 0.117 | 0.459 | −82.9 | 15588 | PHX–2.1m |
| 2012 Jun 12 | 56090.92 | 0.123 | 0.465 | −78.5 | 23476 | PHX–2.1m |
Notes. aPhased with P = 478.0 days and zero phase = JD 2,445,038. bPhased with P = 492.0 days and zero phase = JD 2,445,038. cAt start of observed interval.
Download table as: ASCIITypeset image
Table 3. RX Pup Radial Velocities
| Date | HJD | Photometric | Spectroscopic | RV | Wavelengthc | Source |
|---|---|---|---|---|---|---|
| −2,400,000 | Phasea | Phaseb | (km s−1) | (Å) | ||
| 1996 Oct 30 | 50387.04 | 0.172 | 0.470 | 21.0 | 16204 | NICMASS–CF |
| 1997 Oct 30 | 50752.04 | 0.807 | 0.073 | 34.8 | 16214 | NICMASS–CF |
| 1998 Apr 30 | 50934.61 | 0.124 | 0.375 | 11.4 | 16209 | NICMASS–CF |
| 1998 Oct 22 | 51108.99 | 0.428 | 0.663 | 19.5 | 16202 | NICMASS–CF |
| 1999 Apr 25 | 51296.62 | 0.754 | 0.973 | 31.1 | 16204 | NICMASS–CF |
| 1999 Oct 26 | 51478.03 | 0.070 | 0.273 | 11.6 | 16203 | NICMASS–CF |
| 2000 Oct 15 | 51833.03 | 0.687 | 0.860 | 23.3 | 16223 | NICMASS–CF |
| 2001 Mar 20 | 51988.07 | 0.957 | 0.116 | 6.7 | 16198 | NICMASS–MSO |
| 2001 May 15 | 52044.88 | 0.055 | 0.210 | 10.1 | 16194 | NICMASS–MSO |
| 2001 Jul 4 | 52094.85 | 0.142 | 0.292 | 11.8 | 16275 | NICMASS–MSO |
| 2001 Oct 15 | 52198.28 | 0.322 | 0.463 | 15.5 | 16277 | NICMASS–MSO |
| 2001 Dec 9 | 52253.20 | 0.418 | 0.554 | 20.5 | 16276 | NICMASS–MSO |
| 2002 Feb 8 | 52314.08 | 0.524 | 0.655 | 0.8, 24.0 | 16276 | NICMASS–MSO |
| 2002 Mar 16 | 52349.91 | 0.586 | 0.714 | −0.3, 26.9 | 16275 | NICMASS–MSO |
| 2002 May 3 | 52397.97 | 0.670 | 0.793 | 26.9 | 16274 | NICMASS–MSO |
| 2002 Jun 21 | 52446.84 | 0.754 | 0.874 | 29.2 | 16275 | NICMASS–MSO |
| 2002 Oct 27 | 52574.13 | 0.976 | 0.084 | 5.7 | 16275 | NICMASS–MSO |
| 2002 Dec 21 | 52629.25 | 0.072 | 0.176 | 8.6 | 16277 | NICMASS–MSO |
Notes. aPhased with P = 575 days and zero phase = JD 2,442,238. bPhased with P = 605 days and zero phase = JD 2,442,238. cAt start of observed interval.
Download table as: ASCIITypeset image
Table 4. HM Sge Radial Velocities
| Date | HJD | Photometric | Spectroscopic | RV | Wavelengthc | Source |
|---|---|---|---|---|---|---|
| −2,400,000 | Phasea | Phaseb | (km s−1) | (Å) | ||
| 1994 Oct 26 | 49651.77 | 0.726 | 0.930 | −13.2 | 15609 | NICMASS–CF |
| 1995 Jun 8 | 49876.85 | 0.153 | 0.362 | −2.7 | 16206 | NICMASS–CF |
| 1995 Jul 25 | 49923.88 | 0.243 | 0.453 | −6.4 | 16207 | NICMASS–CF |
| 1995 Jul 26 | 49924.98 | 0.245 | 0.455 | −6.6 | 16207 | NICMASS–CF |
| 1995 Oct 8 | 49998.69 | 0.385 | 0.596 | −4.1 | 16217 | NICMASS–CF |
| 1995 Oct 9 | 49999.72 | 0.387 | 0.598 | −5.5 | 16217 | NICMASS–CF |
| 1996 Mar 19 | 50162.01 | 0.694 | 0.910 | 3.9 | 16209 | NICMASS–CF |
| 1996 Jun 20 | 50254.94 | 0.871 | 0.088 | 12.0 | 16206 | NICMASS–CF |
| 1996 Aug 25 | 50320.72 | 0.996 | 0.214 | 12.0 | 16204 | NICMASS–CF |
| 1996 Sep 25 | 50351.79 | 0.055 | 0.274 | −28.8 | 16341 | PHX–2.1m |
| 1996 Oct 23 | 50379.66 | 0.108 | 0.328 | −12.4 | 16376 | PHX–2.1m |
| 1996 Oct 30 | 50386.62 | 0.121 | 0.341 | −12.3 | 16204 | NICMASS–CF |
| 1997 May 1 | 50569.83 | 0.468 | 0.693 | −0.2 | 16209 | NICMASS–CF |
| 1997 Jun 14 | 50613.87 | 0.552 | 0.777 | −0.9 | 23327 | PHX–2.1m |
| 1997 Jun 29 | 50628.96 | 0.581 | 0.806 | 1.7 | 16205 | NICMASS–CF |
| 1997 Oct 9 | 50730.69 | 0.774 | 0.001 | 0.3 | 15623 | PHX–2.1m |
| 1997 Oct 10 | 50731.62 | 0.775 | 0.003 | −3.2 | 23235 | PHX–2.1m |
| 1999 Jul 4 | 51363.86 | 0.975 | 0.217 | 3.5 | 15680 | PHX–4m |
| 2001 Jul 5 | 52095.23 | 0.363 | 0.620 | −3.3 | 16275 | NICMASS–MSO |
| 2001 Aug 13 | 52135.05 | 0.438 | 0.697 | −3.0 | 16274 | NICMASS–MSO |
| 2001 Aug 30 | 52152.09 | 0.471 | 0.729 | −2.1 | 16276 | NICMASS–MSO |
| 2002 May 6 | 52401.31 | 0.944 | 0.208 | −14.9, 14.7 | 16274 | NICMASS–MSO |
| 2002 Jun 24 | 52450.20 | 0.036 | 0.302 | −10.0 | 16275 | NICMASS–MSO |
| 2002 Jun 25 | 52451.19 | 0.038 | 0.304 | −11.8 | 16275 | NICMASS–MSO |
| 2002 Aug 20 | 52506.07 | 0.142 | 0.409 | −6.7 | 16274 | NICMASS–MSO |
| 2004 May 5 | 53131.00 | 0.328 | 0.608 | 2.3 | 9895 | LB1A–CF |
| 2011 Jun 16 | 55278.91 | 0.258 | 0.595 | −6.1 | 9842 | LB1A–CF |
| 2012 Jun 7 | 56085.92 | 0.935 | 0.280 | −1.1 | 23055 | PHX–2.1m |
| 2012 Jun 9 | 56087.90 | 0.939 | 0.284 | −19.9, −6.2, 5.9 | 15588 | PHX–2.1m |
| 2012 Jun 12 | 56090.90 | 0.945 | 0.290 | 2.3 | 23476 | PHX–2.1m |
Notes. aPhased with P = 527.0 days and zero phase = JD 2,440,310. bPhased with P = 521.0 days and zero phase = JD 2,440,310. cAt start of observed interval.
Download table as: ASCIITypeset image
Table 5. RR Tel Radial Velocities
| Date | HJD | Photometric | Spectroscopic | RV | Wavelengthc | Source |
|---|---|---|---|---|---|---|
| −2,400,000 | Phasea | Phaseb | (km s−1) | (Å) | ||
| 2001 Mar 26 | 51994.27 | 0.422 | 0.099 | −61.5 | 16198 | NICMASS–MSO |
| 2001 May 19 | 52048.28 | 0.562 | 0.243 | −57.8 | 16194 | NICMASS–MSO |
| 2001 Jul 3 | 52093.33 | 0.679 | 0.364 | −55.1 | 16244 | NICMASS–MSO |
| 2001 Jul 5 | 52095.34 | 0.684 | 0.369 | −52.1 | 16275 | NICMASS–MSO |
| 2001 Aug 10 | 52131.24 | 0.777 | 0.465 | −48.3 | 16274 | NICMASS–MSO |
| 2001 Aug 30 | 52152.11 | 0.832 | 0.520 | −46.5 | 16276 | NICMASS–MSO |
| 2001 Oct 17 | 52200.08 | 0.956 | 0.648 | −72.5, −45.4 | 16277 | NICMASS–MSO |
| 2001 Dec 10 | 52253.95 | 0.096 | 0.792 | −71.5 | 16276 | NICMASS–MSO |
| 2002 Mar 22 | 52356.32 | 0.362 | 0.065 | −61.1 | 16277 | NICMASS–MSO |
| 2002 May 5 | 52400.33 | 0.476 | 0.182 | −59.7 | 16274 | NICMASS–MSO |
| 2002 May 6 | 52401.30 | 0.479 | 0.185 | −59.4 | 16274 | NICMASS–MSO |
| 2002 Aug 17 | 52503.11 | 0.743 | 0.456 | −50.0 | 16274 | NICMASS–MSO |
| 2002 Oct 25 | 52572.00 | 0.922 | 0.640 | −44.9 | 16275 | NICMASS–MSO |
| 2002 Dec 23 | 52630.948 | 0.075 | 0.797 | −71.3 | 16277 | NICMASS–MSO |
| 2005 Jun 25 | 53546.90 | 0.454 | 0.240 | −57.9 | 23592 | PHX–GemS |
Notes. aPhased with P = 385.0 days and zero phase = JD 2,442,207. bPhased with P = 375.0 days and zero phase = JD 2,442,207. cAt start of observed interval.
Download table as: ASCIITypeset image
We were able to use telescopes with apertures in the 1–2 m range to obtain most of our spectra for radial velocity measurement because low signal-to-noise data are sufficient. In addition, considerable time is available on small telescopes, so long integrations were possible. However, the primary use of small telescopes did limit the program in one way. The guiders at the KPNO 0.9 m coudé feed and at the 1.88 m Mount Stromlo telescope worked in the optical with light from the target star reflected off the slit jaws. As a result, faint optical targets were excluded, and so V2110 Oph, a 19th visual magnitude D-type SyN, was not observed.
We initially employed the NICMASS infrared array camera, which was developed at the University of Massachusetts (see references in Joyce et al. 1998). The largest number of observations was obtained with it at either the KPNO 0.9 m coudé feed telescope and spectrograph or the 1.88 m MSO telescope and coudé spectrograph. The 2 pixel resolving power (R = λ/Δλ) of NICMASS was similar at both telescopes: 46,000 at KPNO versus 38,000 at MSO. The central wavelength was 1.623 μm at KPNO and 1.630 μm at MSO with wavelength coverage limited by the 256 pixels of the array in the dispersion direction to 45 Å at KPNO and 55 Å at MSO. A more complete description of the experimental setup may be found in Joyce et al. (1998), Fekel et al. (2000), and other papers in the current series. The major Canberra area bush fires of 2003 January caused the destruction of both the MSO 1.88 m telescope and the NICMASS infrared camera. Fortunately, most of the observational material required for our study of the D-symbiotics had been obtained before the fire.
Representative spectra of the program stars at 1.623 μm and 1.630 μm are shown in Figures 1 and 2. Spectra of our velocity standard δ Oph, which has a spectral type of M0.5 III (Keenan & McNeil 1989), have been included in both figures for comparison. The spectra of the program stars in the 1.6 μm region are dominated by CO second overtone lines. The late-type giants in the D-type SyNe, illustrated in the figures, are however considerably cooler than δ Oph. FeH lines are present in the 1.6235 μm region of the D-symbiotics.
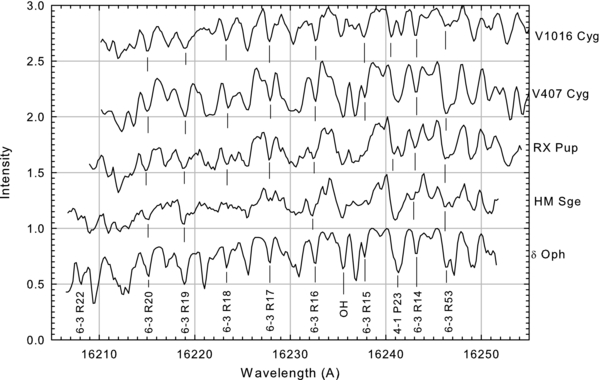
Figure 1. Sample spectra of four program stars taken with the NICMASS camera on the KPNO coudé feed telescope. The M0.5 III δ Oph spectrum is the velocity template reference spectrum. This region is dominated by CO lines with occasional OH lines. In the late M giant symbiotic spectra FeH also makes contributions. The spectra have been shifted in wavelength to align the features.
Download figure:
Standard image High-resolution image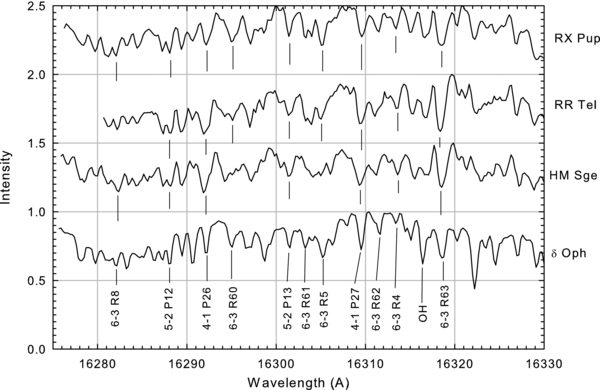
Figure 2. Sample spectra of three program stars taken with the NICMASS camera and the coudé spectrograph on the MSO 1.88 m telescope. The M0.5 III δ Oph spectrum is the velocity template reference spectrum. This region also is dominated by CO lines. The spectra have been shifted in wavelength to align the features.
Download figure:
Standard image High-resolution imageAdditional observations were obtained with the Phoenix cryogenic echelle spectrograph at the f/15 Cassegrain focus of the KPNO 2.1 telescope, KPNO 4 m Mayall telescope, or the Gemini South telescope. A complete description of the Phoenix spectrograph can be found in Hinkle et al. (1998). Typically, the widest slit was used giving a resolving power of ∼50,000, but a few of the observations have a higher value of ∼70,000. Most Phoenix observations were centered near 1.56 μm. A few observations were also obtained of V407 Cyg, V1016 Cyg, RR Tel, and HM Sge in the 2.3 μm region. A single additional observation at 4.66 μm for three stars, V407 Cyg, V1016 Cyg, and HM Sge, was also obtained. An expanded discussion of the Phoenix experimental setup can be found in Fekel et al. (2000).
Three observations, one of V407 Cyg and two of HM Sge, were obtained after 2003 at KPNO with the 0.9 m coudé feed telescope, coudé spectrograph, and a CCD designated LB1A. This 1980 × 800 pixel CCD was manufactured by Lawrence Berkeley National Laboratory and is 300 μm thick. Although this thickness results in increased pixel contamination by cosmic ray and background radiation events, the chip was used because of its high quantum efficiency at far red wavelengths. The spectrograms are centered near 1.005 μm and have a wavelength range of 420 Å and a resolving power R = 21,500.
We also employ two archival HM Sge spectra taken on 1979 May 12 and 1989 September 13 with the 4 m FTS (Hall et al. 1979). The FTS, while limited to bright objects, was capable of large spectral coverage at high resolution. For the 1979 observation the 2.1–2.4 μm region was observed at R = 33,000. In 1989 the 1.5–2.4 μm region was observed at R = 23,000. These observations do not have hot reference star observations and so the telluric lines have not been ratioed out.
As described in previous papers of this series, standard observing and reduction techniques were used (Joyce 1992) for the IR array and CCD data. Wavelength calibration posed a challenge because the spectral coverage was far too small to include a sufficient number of ThAr emission lines for a dispersion solution. Our approach was to utilize absorption lines in a K iii star to obtain a dispersion solution. Several sets of lines were tried, including CO, Fe i, and Ti i. These groups all gave consistent results.
Radial velocities of the program stars were determined with the IRAF cross-correlation program FXCOR (Fitzpatrick 1993). Most velocities are referenced to observations of M-giant IAU velocity standards, δ Oph or α Cet, which were obtained multiple times during the course of each night. The radial velocities of those standard stars were adopted from the work of Scarfe et al. (1990). In addition, for a few of our observations the M giant stars HR 4162, HR 7900, HR 8621, and HR 8860 were used as velocity reference stars. We measured velocities of these stars relative to δ Oph and α Cet, and average velocities of 18.0, −9.6, 7.4, and −7.8 km s−1, respectively, were adopted from our unpublished results. All velocities in this paper are heliocentric.
We have used photometric periods and epochs from the literature to make phase plots of the velocities. We also determined periods from our radial velocity data. Because of the very asymmetric nature of the velocity curves, we used the least string method, as implemented by Bopp et al. (1970), to determine the periods. We then phased the velocities with the best spectroscopic period, adopting the same photometric epoch of maximum light that was used to plot the velocities with the photometric periods. The velocities and both the photometric and spectroscopic phases are included in Tables 1–5.
3. HISTORICAL REVIEWS OF PROGRAM STARS
In this section we present a literature review for each of our five program stars. We show that each of the program stars has a well-defined history of nova activity and that the systems are binaries containing a Mira variable and a hot star. We discuss the violence of the nova eruption(s) and examine the history of activity recorded in the imaged circumstellar envelope. For each system we also highlight the separation of the components and mention various estimates of the orbital period.
3.1. V407 CYG = AS 453 = NOVA CYG 1936
3.1.1. Discovery
V407 Cyg was discovered as a nova-like variable when it underwent an outburst in 1936.4Ahnert et al. (1949) found brightenings with a period of ∼670 days. No spectroscopic observations were obtained of the 1930s outburst. However, V407 Cyg appears in the catalog of Merrill & Burwell (1950) as emission line object MHα 289-90 = AS 453 with a "combination" spectrum. Little further notice was taken of V407 Cyg until the late 1980s. Based on a review of the discovery and subsequent classification of V407 Cyg as a Mira, Meinunger (1966) remarked that this was no doubt a nova–Mira binary system.
3.1.2. The Mira
Using broadband photometry extending as blue as the U band, Esipov et al. (1988) were not able to detect the hot companion of V407 Cyg. Following Esipov & Yudin (1986), Esipov et al. (1988) did detect emission from [N ii], which requires a nebula excited by a hot star. Nonetheless, as reviewed by Munari et al. (1990), at this time the status of V407 Cyg as a symbiotic was questioned. Munari et al. (1990) found the spectral type of the V407 Cyg Mira to be M6 III. At low resolution the absorption spectrum and hydrogen emission lines closely resembled o Ceti.
Munari et al. (1990) presented a summary of optical (B) photometry of V407 Cyg from the time of discovery to 1987. From this an ephemeris for the maxima of the Mira, Bmax = JD 2,429,710 + 745E, was derived. From broadband optical and near-infrared photometry, Kolotilov et al. (1998) confirmed the period of 745 days and found a Mira-like K-band amplitude of ≲1 mag. Optical and near-IR light curves from 1970 to 2000 were presented by Munari & Jurdana-Šepić (2002). They found periods, which are a function of color, in the range 745 to 756 days. Munari et al. (2011) concluded that a 745 day pulsation was a good fit to near-IR photometry. However, Kolotilov et al. (1998) and Munari & Jurdana-Šepić (2002) determined that the pulsation of the Mira is highly variable from cycle to cycle. Shugarov et al. (2007) found a period of 763 days.
Munari et al. (1990) and Kolotilov et al. (2003) concluded that the pulsation period for V407 Cyg is the longest of any known symbiotic system. They furthermore noted that this period exceeds that of typical isolated Miras and is in the period range given by Engels et al. (1983) for OH/IR obscured Miras. They speculated that the outbursts of the V407 Cyg white dwarf companion prevent the Mira from becoming obscured. Munari et al. (1990) stated that V407 Cyg presents an opportunity to observe an unobscured Mira of exceptionally long period. Using J-H-K infrared colors and the Glass & Feast (1982) period–luminosity relation, Munari et al. (1990) calculated a distance of 2.7 kpc for V407 Cyg.
Tatarnikova et al. (2003a), Tatarnikova et al. (2003b), and Shugarov et al. (2007) reported the presence of a strong Li i λ6708 line in the spectrum of the Mira. Li is destroyed in the interior of main-sequence stars and material convected to the surface of red giants is devoid of Li (Brown et al. 1989). However, in agreement with the V407 Cyg observations a very small set of Li-rich AGB stars are known. These are massive AGB stars, >4 M☉, where Li has been synthesized in hot-bottom burning during the third dredge-up (Boothroyd et al. 1993). Observations of LMC and SMC Li-rich AGB stars show that these stars cover a restricted range in absolute bolometric magnitude, Mbol ∼ −6 to −7 (Smith & Lambert 1990). This implies both a lower and upper bound for the mass, M ∼ 4–8 M☉.
3.1.3. Dust and the Orbit
Mid-IR observations show that the V407 Cyg dust is a mix of silicate and graphite grains (Yudin 1999). This also suggests a fairly recent third dredge-up of hot-bottom-burned material that reduced previously carbon-rich material to C/O < 1. From a fit of the infrared spectral energy distribution (SED) Kolotilov et al. (1998) found an inner radius dust temperature of 600 K for silicate and 1000 K for graphite grains. Yudin (1999) suggested an inner radius of ∼5 R*. Using literature photometry the Whitelock et al. (1994) calibration of the mass-loss rate for oxygen-rich objects indicates a mass-loss rate of 6 × 10⁻⁷ M☉ yr−1. Kolotilov et al. (1998) and Yudin (1999) found similar values. Kolotilov et al. (1998) remark that the mass-loss rate is at least an order of magnitude smaller than that expected from period–mass-loss rate relations (for example, Whitelock et al. 1994).
Munari et al. (1990) interpreted dust obscuration events as being orbitally related. Based on possible historic dust obscuration events in V407 Cyg Munari et al. (1990) suggest an orbital period of ∼43 yr with the last inferior conjunction occurring at JD 2,441,600. Munari et al. (1990) also conclude that the system is totally detached.
3.1.4. Recent Activity
In large part, interest in V407 Cyg has been driven by the active phases. These occurred in the late 1930s, early 1990s (Munari et al. 1994), 1998–2002 (Kolotilov et al. 2003; Tatarnikova et al. 2003a), and most significantly in 2010. Munari et al. (2011) differentiated between the low-amplitude, long-lasting outbursts typical of symbiotic systems and larger amplitude nova outbursts. The latter are not associated with the rapid thermonuclear runaway events of the former. Low-level outbursts can be seen on historic light curves of V407 Cyg cited above. Shugarov et al. (2007) detected flickering in the 1998 outburst, confirming mass transfer to a white dwarf secondary. In spectra reported by Tatarnikova et al. (2003a) the Hα profiles show changing accretion by the hot star over the 1993–2002 period.
The 2010 event was a nova explosion resulting in an optical magnitude increase of ∼10 mag over quiescent values reported before the 1930 event (Nishiyama et al. 2010; Ahnert et al. 1949). Following the 2010 outburst of V407 Cyg, Shore et al. (2011) proposed reclassifying V407 Cyg as a member of the rare class of symbiotic recurrent novae (SyRNe). Other members of this class are S-type symbiotic systems that contain a very massive white dwarf. The continuum from the nova dominated the blue spectrum in 2010 March (Munari et al. 2011). Coronal emission lines of [Fe x] λ6375, [Fe xi] λ7890, [Ar x] λ5535, and [Ni xii] λ4233 were discovered (Munari et al. 2010) along with gamma-ray emission (Abdo et al. 2010), the first detection of gamma-ray emission from a symbiotic nova. Lü et al. (2011) discussed the long orbital period of D-symbiotics as a requirement for gamma-ray emission in symbiotic systems.
Munari et al. (2011) present results from optical and infrared observations of the 2010 nova episode. They found a very fast wind from the nova that is rapidly decelerating within the Mira wind. The extensive, massive Mira wind contains unaffected regions despite the high-energy processes occurring near the Mira. However, Munari et al. (1990) found that the radiation field and outburst from a white dwarf companion inhibited dust formation in the Mira wind.
Additional insight into the interaction between the nova and the Mira comes from the Cho & Kim (2010) detection of 28SiO v = 1 and v = 2 masers in V407 Cyg. These masers have velocities of −28.1 and −27.9 km s−1, respectively. They also reported an H2O maser at a velocity of −31.5 km s−1. Deguchi et al. (2011) concluded that the nova outburst of 2010 disrupted the SiO masers. The high velocity component of the maser disappeared two weeks after the nova outburst, roughly synchronized with the appearance of strong X-ray emission (Deguchi et al. 2011). Deguchi et al. (2011) proposed that the maser region was disturbed by the passing nova shock. Following from this, the nova-SiO maser and hence white dwarf–Mira separation is ∼20 AU, implying an orbital period of at least decades.
The spectroscopic evolution of the 2010 nova outburst of V407 Cyg is described by Shore et al. (2011). A spectrographic time series reported by Shore et al. (2011) supports the SyRN classification. Shore et al. (2011) found velocities in Hα approaching 3000 km s−1. The highly ionized species had broad profiles, for instance [Fe x] λ6375 extended from −400 to +600 km s−1. The Na i D line underwent systematic changes similar to those seen in SNe and related to the illumination of historic enhancements of mass-loss. The shock temperature of 2 × 10⁷ K for the first 30 to 60 days after the outburst implies a shock velocity of ∼800 km s−1.
Shore et al. (2011) note that if the stellar mass is ∼4 M☉ and the white dwarf mass is ∼1.2 M☉, as suggested by the SyRN classification, the mass ratio is about 3. This sets constraints on the ratio of the Roche radius to the semimajor axis, with RRL/a ∼ 0.3. Taking the Roche radius to be larger than the Mira radius, then the semi-major axis a > 6 AU, and the period is long, clearly at least the 43 yr suggested by Munari et al. (1990). A 43 yr period places the Roche radius at 6 AU, which is within the outer Mira atmosphere (Reid & Menten 1997). The quiescent accretion ratio of the white dwarf is ∼10−8 to 10−9 M☉ yr−1 (Munari et al. 1990), which is a few percent of the Mira mass-loss rate of ∼10−7 M☉ yr−1 Yudin (1999). The accretion rate, while highly uncertain, seems typical for detached Mira–white dwarf binaries (de Val-Borro et al. 2009) and suggests a period of >100 yr or a highly elliptical orbit.
A SED derived from literature photometry of V407 Cyg is shown in Figure 3. In Figure 4 the phased radial velocity data are presented. We find a best fit pulsation period of 770 days from the velocity measurements. There is a difference of 25 days, ∼3% of the period, between the photometric and spectroscopically derived periods.
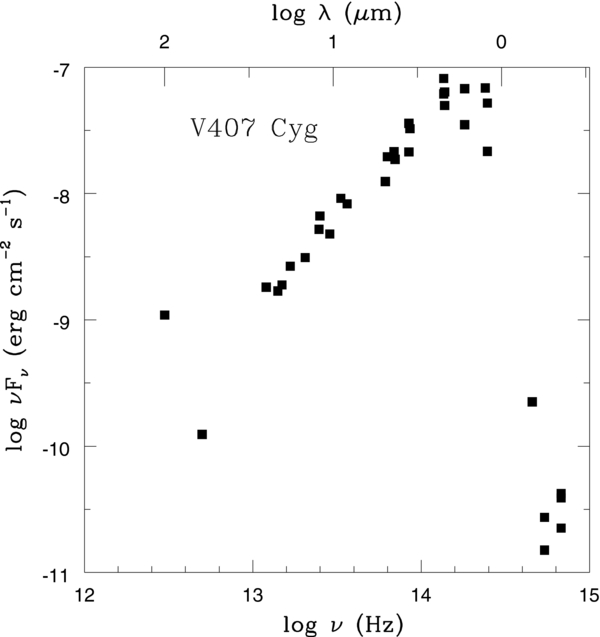
Figure 3. A representative spectral energy distribution for V407 Cyg based on literature photometry.
Download figure:
Standard image High-resolution image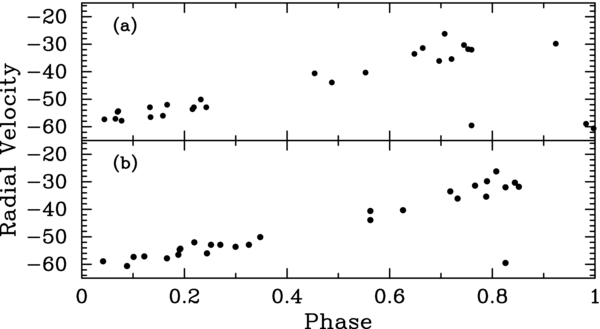
Figure 4. V407 Cyg velocities measured in the 1.0–1.6 μm region. Panel (a) phased with the photometric ephemeris of Munari et al. (1990) P = 745 days and zero phase = JD 2,429,710 and (b) phased with best fit spectroscopic P = 770 days and the photometric zero phase.
Download figure:
Standard image High-resolution image3.2. V1016 CYG = AS 373 = NOVA CYG 1964
3.2.1. Discovery
V1016 Cyg was first cataloged by Merrill & Burwell (1950, MHα 328-116 = AS 373) as a star with red magnitude ∼12 having strong Hα emission. Attention was focused on V1016 Cyg in 1964 due to a nova-like outburst (Hoffleit 1965). A light curve dating back to the 1920s can be found in FitzGerald et al. (1966). V1016 Cyg underwent brightening to a photographic magnitude near 15 in the 1950s prior to the nova-like event. The nova-like event resulted in a nearly 5 mag increase in brightness during 1964 (FitzGerald et al. 1966). Ultimately V1016 Cyg brightened to 10.66 at V (Philip 1969).
3.2.2. The Mira and the Hot Star
FitzGerald et al. (1966) reported a low-excitation emission line spectrum. The additional presence of late-M features on an archival near-IR spectrum dating from 1947 drove them to suggest that V1016 Cyg is a symbiotic variable. O'Dell (1967) subsequently noted continuum from a hot star with intense Balmer emission lines. Swings & Allen (1972) found that the near-IR (HKL) photometry of V1016 Cyg could be fit by 1000 K dust. Confirmation of the symbiotic nature followed when Harvey (1974) found that the K-band magnitude of V1016 Cyg underwent 1.0 mag changes with a ∼450 day period, suggesting that a Mira variable is present. Harvey (1974) was the first to suggest the combined presence of a Mira and a hot star in the system. Schild et al. (1992) show a medium-resolution K-band spectrum of V1016 Cyg taken in 1990. The spectrum displays the presence of dust emission with the signal increasing to the red. Broad H2O absorption bands are present and the CO 2–0 band head can be seen. Brackett γ appears in emission. The signatures of H2O and CO are characteristics of oxygen-rich cool M giants and especially Mira variables. Mürset & Schmid (1999) gave the spectral class of the giant as M7.
3.2.3. Nebula
Spectroscopic observations in [N ii] and [O iii] by Solf (1983) revealed that the V1016 Cyg system contained a compact bipolar nebula with lobes separated by 040 spatially and 51 km s−1 in velocity. The expansion velocity projected along the major axis is 120 km s−1 with a nebular mass of 2 × 10⁻⁴ M☉. Bipolar structure was reported by Hjellming & Bignell (1982) from Very Large Array (VLA) maps at 23.1 GHz. Girard & Willson (1987) provide an alternative conical geometry to model the optical spectra. However, deeper images and spectroscopy in [N ii] confirmed a nebula of about 20'' diameter, containing a bipolar kinematic feature extending 3'' from the center with projected velocities of ±30 km s−1 (Corradi et al. 1999).
3.2.4. Ephemeris, Colors, Distance
For V1016 Cyg Watson et al. (2000) provide citations to distance estimates, ranging from 2.1 to 10 kpc, that were derived from various techniques. An ephemeris of the times of maxima for the Mira is provided by Kenyon & Webbink (1984): Max(K) = JD 2,444,101 + 471E. Munari (1988) produced a revision: Max(K) = JD 2,444,852 + 478(±5)E. Taranova & Shenavrin (2000) presented 20 yr of near-IR photometry of V1016 Cyg. A pulsation period of 470 ± 5 days is found for the Mira. Using the Glass & Feast (1982) IR period–color relation for Miras, Taranova & Shenavrin (2000) found a distance of 2.8 ± 0.6 kpc and a luminosity for the Mira of 8600 L☉. Parimucha (2003) determined a pulsation period of 474 ± 2 days and a spectral class of M7. Again, using the Glass & Feast (1982) period–color relation and standard relation for pulsating variables, Parimucha (2003) computed a distance of 2.9 ± 0.8 kpc. Assuming a distance of 3.9 kpc, Mürset et al. (1991) estimated that the hot component has a radiation temperature of 150,000–125,000 K, radius ∼0.3 R☉, and luminosity ∼35,000 L☉.
3.2.5. Dust and Mass-Loss
Taranova & Shenavrin (2000) found an optically thick dust envelope around V1016 Cyg, which had an optical depth of a few in the non-thermal near-IR. During the period of observation (1978–1999) the dust was dispersing. Munari (1988) proposed that the dust obscuration events are periodic with a period of ∼6 yr. IRAS photometry by Anandarao et al. (1988) previously had revealed two dust shells, one at ∼300 K with radius ∼60 AU and a second more massive shell at ∼60 K with radius ∼7500 AU. Taranova & Shenavrin (2000) found the dust to have a temperature of ∼600 K, a radius of 1400 R☉, and a mass of ∼3 × 10⁻⁵ M☉. Angeloni et al. (2010) also identified two dust shells by fitting the V1016 Cyg SED with a 3000 K Mira plus a 1000 K dust shell at 20 AU and a 400 K dust shell at 60 AU. Literature photometry and the Whitelock et al. (1994) calibration of the mass-loss rate for oxygen-rich objects indicate a mass-loss rate of 8 × 10⁻⁶ M☉ yr−1. The distance found by Parimucha (2003) from the K-period relation for Miras results in a peak dust shell flux that correlates well with other symbiotics. Infrared Space Observatory (ISO) SWS spectra of V1016 Cyg show strong silicate features (Angeloni et al. 2010).
From the Raman scattered He ii λ4850 line, Jung & Lee (2004) determined a mass-loss rate, which they said should be "taken with caution" due to high sensitivity to the system kinematics, of ≲ 4 × 10⁻⁷ M☉ yr−1 for V1016 Cyg. This is more than an order of magnitude less than the total (gas plus dust) mass-loss rate derived from infrared colors. From fitting the Raman O vi λ6825 line Lee & Kang (2007) computed a terminal wind velocity of 11 km s−1. Watson et al. (2000) noted that V1016 Cygni is one of the brightest radio sources among the symbiotic systems. They suggested that this is related to the nova-like outburst in 1965. They concluded that at least the 6 cm radiation is the result of interacting winds associated with the Mira and white dwarf.
3.2.6. Orbit
Schild & Schmid (1996) used spectropolarimetric observations of the Raman 6825 Å line to determine a change in position angle over 3 yr that is consistent with a binary period of 80 ± 25 yr. The inclination is moderate, 60° ± 20°, with the orbital plane oriented in agreement with the bipolar model of Solf (1983). Subsequent observations reported by Schmid & Schild (2002) suggest that the binary period is several times longer than originally proposed but confirm that the binary axis is near the plane of the sky. Using imaging data from the Hubble Space Telescope (HST), Brocksopp et al. (2002) measured an angular separation of 42.4 mas between the white dwarf and the Mira of V1016 Cyg. Assuming a distance of 2 kpc, this is a projected separation of 84 AU. Brocksopp et al. (2002) concluded that the orbital period is >540 yr, which differs significantly from the orbital period determined from Raman spectroscopy suggesting the orbit is highly eccentric.
An SED derived from literature photometry of V1016 Cyg is shown in Figure 5. In Figure 6 the phased radial velocity data are presented. From the velocities we find a best fit pulsation period of 492 days. The photometrically and spectroscopically determined periods differ by 14 days, ∼3% of the period.

Figure 5. A representative SED for V1016 Cyg based on literature photometry.
Download figure:
Standard image High-resolution image
Figure 6. V1016 Cyg velocities measured in the 1.6 μm region. Panel (a) phased with literature photometric P = 478 days and zero phase = JD 2,445,038 and (b) phased with best fit spectroscopic P = 492 days and the photometric zero phase.
Download figure:
Standard image High-resolution image3.3. RX PUP = HD 69190 = CD -41 3911 = WRAY 16-17 = SS73 8 = HEN 3-138
3.3.1. Discovery
RX Pup is a CD star (CD −41 3911) and hence one of the longest studied, prototypical symbiotic novae. In her spectral survey of these objects Fleming (Pickering & Fleming 1897) found the Balmer lines in emission. Swings & Struve (1941) presented a summary of visual magnitude and spectrum variations from the turn of the 20th century through the early 1940s. Swings & Struve (1941) noted similarities of the visual RX Pup spectra to spectra of other stars that are now classified as symbiotics. RX Pup appears in the emission line object catalogs of Wray (1966, Wray 16-17), Sanduleak & Stephenson (1973, SS73 8), and Henize (1976, Hen 3-138). Investigators in the 1970s found that the optical spectrum has a low excitation phase, reminiscent of a Be star with a disk, and a high excitation phase, with Wolf–Rayet features similar to those of RR Tel (Allen & Wright 1988). Mikołajewska et al. (1999) reported on evidence that RX Pup underwent nova outbursts in the 1890s and 1970s. This implies a period of 80 yr, although due to a lack of data in the 1930s the period could be as short as 40 yr.
3.3.2. The Mira and the Hot Star
Feast et al. (1977) found a large amplitude infrared variation (ΔK = 1.4 mag) indicating that the RX Pup system contains a Mira variable. Feast et al. (1977) also concluded that the SED required a ∼900 K dust component in addition to the Mira. Barton et al. (1979) detected H2O and CO bands in the 2 μm spectrum, again suggesting the presence of an oxygen-rich Mira variable. This, combined with the hot star characteristics mentioned above, led Barton et al. (1979) to propose that RX Pup be classified as a symbiotic star. H2O and CO bands were confirmed by Whitelock et al. (1983). Based on near-IR spectroscopy, Schulte-Ladbeck (1988) found the spectral class of the Mira to be later than M5. Mürset & Schmid (1999) determined a spectral class of M5.5. The recurring nova outbursts and the symbiotic status clearly show that RX Pup is a member of the small class of symbiotic nova.
Whitelock et al. (1983) detected long-term trends at J and L suggesting a dust formation episode in the late 1970s. After correcting for the Mira pulsation variations Mikołajewska et al. (1999) found long-term changes in the light curve from 1974 through 1996, 2.5 mag in J and 0.8 mag in L. The L-band changes were not fully in phase with those in the J band but were not antiphased either. The changes in reddening in the Mira are not correlated with changes in reddening in the hot component and the emission line forming region. Thus, the obscuration only affects the Mira. Mikołajewska et al. (1999) also noted that the Mira pulsation amplitude is variable depending on the state of the hot component.
Ultraviolet spectra from IUE, reported on by Kafatos et al. (1985), show the presence of an accretion disk around the white dwarf. The emission lines have typical full widths of 200 km s−1. The hot component ionizing the wind was found to have a color temperature in the range 50,000–100,000 K and a luminosity of ∼1000 L☉. Seaquist & Taylor (1987) detected a variation of flux density and angular structure with frequency of the radio continuum. This is in agreement with thermal bremsstrahlung continuum originating from a stellar wind. Assuming a wind velocity of 60 km s−1 and a stellar distance of 1 kpc they compute a mass-loss rate of ≳ 4 × 10⁻⁶ M☉ yr−1. Mürset et al. (1997) detected X-rays from RX Pup. The radiation from an optically thin region with a temperature of 7×10⁶ K suggests an origin in either colliding winds or an accretion disk.
3.3.3. Distance
The distance to RX Pup has been estimated with multiple techniques. Klutz et al. (1978) found a distance of 1 kpc based on interstellar Na i lines. From J-band photometry Whitelock et al. (1983) determined a period of 580 days with an amplitude of ∼1.8 mag. This period and the Mira J-band period–luminosity relation allowed Whitelock (1987) to derive a distance of 1.5 kpc. Allen & Wright (1988) determined two distances, one of 1.5–1.6 kpc, based on the X-band Mira period–luminosity relation, and a second of 0.7 kpc, based on mid-IR fluxes. They suggested a compromise distance of 1 kpc. From mid-IR colors Kenyon et al. (1988) derived a distance of 1.25 kpc for RX Pup and AK = 0.8. Kenyon & Webbink (1984) provide an ephemeris of Max(K) = JD 2,442,810 + 580E. Using near-IR photometry, Mikołajewska et al. (1999) found a 578 day period for the Mira. From the Mira period–luminosity relation at K Mikołajewska et al. (1999) computed MK = −8.7, for which the corresponding distance is 1.8 ± 0.5 kpc. Mikołajewska et al. (1999) warn that both the reddening for the Mira period–luminosity relation for variables of very long period and the circumstellar reddening of RX Pup are uncertain. During various epochs the RX Pup E(B − V) has been estimated to range from >1.0 to 3.3. Uncertainties in circumstellar reddening are a problem in the distances for all the D-symbiotics. Gromadzki et al. (2009) used SAAO K-band photometry to obtain a pulsation period of 575 ± 8 days and gave an ephemeris for maxima of 2,442,238 + 575E. With a K-band period–luminosity relation Gromadzki et al. (2009) estimated a distance of 1.6 kpc.
3.3.4. Dust and Mass-Loss
Kenyon et al. (1988) used mid-IR colors to determine a dust temperature of 325 K. Anandarao et al. (1988) found inner and outer dust shell radii of 43 and ∼3900 AU with temperatures of 364 and 45 K. These temperatures are much lower than the ∼900 K determined from near-IR photometry by, for example, Feast et al. (1977). From an analysis of JHKL magnitudes Kotnik-Karuza et al. (2007) report 900 and 700 K dust temperatures for RX Pup in different dust obscuration events. They determined a maximum grain size of 1.1 and 2.0 μm in these events. The visual optical depth was up to 7.5 mag. IRAS LRS spectra show strong silicate features (Anandarao et al. 1988). Literature photometry and the Whitelock et al. (1994) calibration of the mass-loss rate for oxygen-rich objects indicate a mass-loss rate of 8 × 10⁻⁶ M☉ yr−1. Similar photometric estimates are provided by Kotnik-Karuza et al. (2007) and Gromadzki et al. (2009).
3.3.5. Orbit
A critical parameter of the RX Pup binary is the separation of the components. Allen & Wright (1988) noted that the system does not have the characteristics expected for Roche lobe overflow. Therefore, the minimum separation is on the order of twice the Mira radius or ∼7 AU. A better lower limit on the separation can be determined from the radio observations. Seaquist & Taylor (1992) reviewed radio and IR data and showed that the radio (cm through mm) observations are fitted by optically thick free-free. The infrared from about 100 μm to shorter wavelengths is dominated by blackbody radiation from the dust. From the radio data Seaquist & Taylor (1992) argued for a binary separation in the range ∼30–70 AU. The upper limit on the separation can be found from the structure surrounding the stars. Mikołajewska et al. (1999) concluded that the permanent dust shell around the Mira suggests a binary separation >50 AU, which corresponds to a Porb > 200 yr.
3.3.6. Nebula
Parts of the RX Pup system have been spatially resolved. Using a coronagraph and narrowband [N ii] filter Paresce (1990) found a one-sided jet-like feature co-aligned with the semimajor axis of the 6 cm radio nebula. Corradi & Schwarz (2000) presented high-resolution spatially resolved spectra of RX Pup. They confirmed the Paresce (1990) detection of extended [N ii] emission. However, they concluded that the [N ii] region has a velocity decreasing with distance from RX Pup, so it is not a jet. Outflow velocities in excess of 80 km s−1 are measured. They suggested that the nebula is bipolar and has a size hundreds of times larger than the binary separation. Hollis et al. (1989) showed that RX Pup has a radio structure composed of at least three nearly co-linear components. They identified the strongest feature with the hot star. Under the assumption that RX Pup is 1.5 kpc distant, the other features are separated from the hot star by 230 and 590 AU. They suggested these other features are ejecta from activity at earlier epochs. Hollis et al. (1989) reviewed the radio detection history of RX Pup and noted that RX Pup undergoes episodes of radio flux variations.
Shore et al. (2011) highlighted similarities noted by Mikołajewska et al. (2002) between the S-type SyRN systems with massive white dwarfs and RX Pup. RX Pup appears to currently have similarities to the pre-nova observations of V407 Cyg, which underwent a nova outburst in 2010 and is now believed to be an SyRN system. However, the outflow velocities in RX Pup are significantly less than in V407 Cyg.
An SED of RX Pup derived from literature photometry is shown in Figure 7. In Figure 8 the phased radial velocity data are presented. From the velocities we find a spectroscopic pulsation period of 605 days. The difference between the photometric and spectroscopic periods is 30 days, ∼5% of the period.
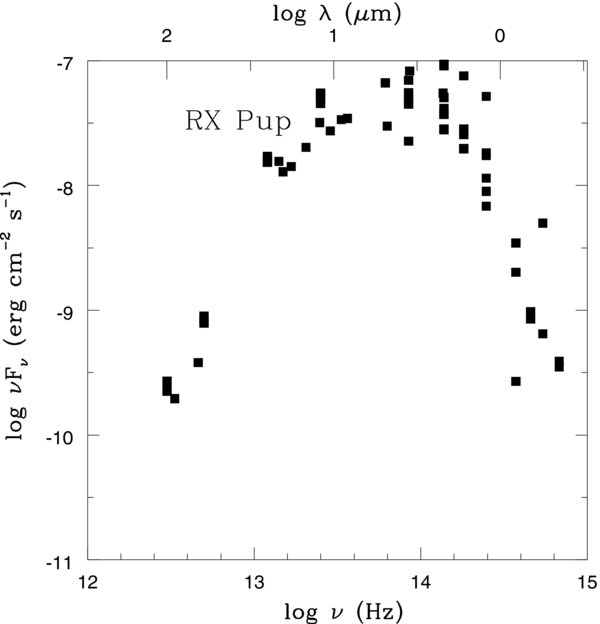
Figure 7. A representative SED for RX Pup based on literature photometry.
Download figure:
Standard image High-resolution image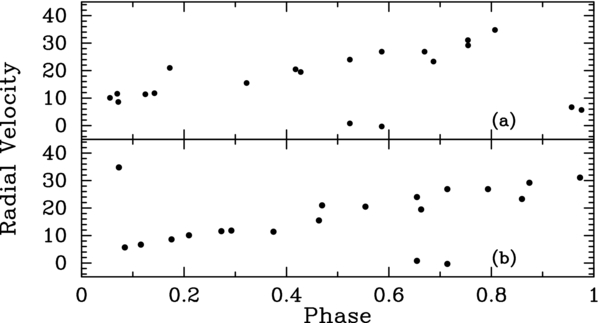
Figure 8. RX Pup velocities measured in the 1.6 μm region. Panel (a) phased with the photometric ephemeris of Kenyon & Webbink (1984) P = 575 days and zero phase JD 2,442,238 and (b) phased with best fit spectroscopic P = 605 days and the photometric zero phase. The two phases of P(phot) between 0.5 and 0.6 with double RVs have been confirmed in the observations.
Download figure:
Standard image High-resolution image3.4. HM SGE = NOVA SGE 1975
3.4.1. Discovery
Dokuchaeva (1976) reported an anonymous star, later named HM Sge, had brightened from mph ⩾ 17 mag to V = 11 mag in 1975. The star was a red variable with an emission line spectrum. Puetter et al. (1978) found a 950 K blackbody with strong 8–13 μm silicate emission to be a good match to the 2.5 to 8 μm spectrum. They also reported CO absorption at 2.3 μm and concluded that HM Sge contained a reddened cool star. Davidson et al. (1978) was the first to suggest that HM Sge was a symbiotic star and estimated a distance of 1–3 kpc. Allen (1980) argued that HM Sge was a slow nova and that slow novae were the same phenomena as symbiotic stars. Kenyon & Truran (1983) expanded on this point and placed HM Sge in the group of symbiotic stars that undergo eruptions. The properties of these "symbiotic novae" include outbursts extending over decades and long period binary systems containing an M giant.
Interest generated by the nova-like brightening resulted in observations of HM Sge at wavelengths from the radio through the X-ray. Allen (1981) reported that HM Sge is one of three symbiotics (RR Tel, V1016 Cyg, and HM Sge) detected in the X-ray region. Kwok & Leahy (1984) found that the X-ray flux exceeded that expected from thermonuclear reactions on the surface of the white dwarf during an eruption and proposed that the X-ray flux results in shocked gas when the fast wind from the white dwarf collides with the slow wind from the M giant. Purton et al. (1983) reviewed radio observations of HM Sge from 1977 to 1980. They found that the radio continuum emitting region in HM Sge had a diameter of ∼02.
3.4.2. The Mira and the Hot Star
A number of observers began time-series photometry in the late 1970s. From such narrowband near-IR observations Bregman (1982) suggested that the late-type star is a Mira with a period of 550 days. Using K-band photometry, Taranova & Yudin (1983) reported a period of ∼500 days. From near-IR photometry Lorenzetti et al. (1985) settled on a pulsation period of 540 days. Using a decade-long time series, Munari & Whitelock (1989) determined a pulsation period of 527 days for HM Sge with maximum light occurring at JD 2,440,310(±30) + 527(±2.0)E. Yudin et al. (1994) confirmed the period of 527 days from J-band data and provided an ephemeris for minima. From J-band photometric observations over the 1978–1999 interval, Taranova & Shenavrin (2000) found a pulsation period of 535 ± 5 days. These periods all support the classification of the M giant as a Mira. In addition, 1–5 μm narrowband photometric observations by Bregman (1982) showed that HM Sge has water vapor absorption bands characteristic of an oxygen-rich Mira. Schulte-Ladbeck (1988) estimated a spectral class for the Mira of later than M5, while Mürset & Schmid (1999) concluded that it has an M7 spectral class.
Stauffer (1984) found the effective temperature of the white dwarf to be varying, ranging from less than 70,000 K to 160,000 K with a timescale of months. The proposed mechanism was a hydrogen shell flash in the accretion envelope of the white dwarf, which removed the envelope exposing the hotter core of the white dwarf. Nussbaumer & Vogel (1990) reported a longer term variation with the radiation temperature of the white dwarf increasing from below 40,000 K in 1976 to 170,000 K in 1989, while the luminosity remained constant at ∼104 L☉. They suggested that increasing radiation temperature of the white dwarf is common following nova eruptions in symbiotic stars.
3.4.3. Distance
As with other D-symbiotics, the Mira period–luminosity relation can be applied to derive a distance but with the caveat that the circumstellar reddening is typically large and uncertain, leading to a large range of distances. For example, using Balmer line ratios of HM Sge, Blair et al. (1983) found a rather small value of AV ∼ 1.2 mag, while also from Balmer line ratios Davidson et al. (1978) estimated AV to be twice as large, ∼2.5. At the other extreme Bregman (1982) determined AV = 12 from the infrared Brackett lines. Assuming a typical bolometric magnitude for the Mira, Lorenzetti et al. (1985) derived a distance of 4 kpc. Kenyon et al. (1986) noted that this produces an unreasonably large bolometric luminosity for the hot component in the binary. Kenyon et al. (1986) found a reddening of AK = 2 for the Mira. Insight into this problem was provided by Kenyon et al. (1986), who concluded that consistency with optical observations of the hot star requires that the hot star lie outside the dust shroud surrounding the Mira. Based on a pulsation period of 540 days, Whitelock (1987) suggested a period–luminosity relation distance of 2.3 kpc. Taranova & Shenavrin (2000) derived a distance of 1.8 ± 0.4 kpc.
3.4.4. Dust
From 1–5 μm narrowband photometric observations Bregman (1982) found 1000 K dust present. During the mid-1980s HM Sge underwent infrared fading, which was attributed to dust obscuration. Munari & Whitelock (1989) showed that the infrared SED could be fit by 2500 K and 800 K blackbodies. During obscuration events the blackbody temperatures required to fit the SED remained constant, but the 2500 K Mira component decreased compared to the 800 K component. Schild et al. (1992) presented a medium-resolution K-band spectrum taken in 1990. The spectrum was dominated by dust emission increasing to the red with the only spectral line being weak Brackett γ emission. Schmid et al. (2000) reported that in 1998 the spectrum of the Mira was present in the red and near-IR. These observations agree with the report by Taranova & Shenavrin (2000) of long-term variations in the dust obscuration with maximum obscuration occurring near JD 2,447,500 (1988 December). Time-series near-IR photometry showing obscuration episodes contemporaneous with our near-IR spectroscopy is presented by Shenavrin et al. (2011). The emission line spectrum and SED of HM Sge are modeled in the context of interacting winds by Formiggini et al. (1995) and Angeloni et al. (2010). They find dust shells at 400 and 1000 K. ISO-SWS spectra of HM Sge show strong silicate features (Angeloni et al. 2010). Literature photometry and the Whitelock et al. (1994) calibration of the mass-loss rate for oxygen-rich objects indicate a mass-loss rate of 8 × 10⁻⁶ M☉ yr−1.
3.4.5. Nebula
Solf (1984) reported on the first spatially resolved information about the HM Sge circumstellar shell. With spatial–spectral mapping a bipolar mass flow of ∼200 km s−1 was found that collimate into two narrow lobes separated by 15. In addition, there are two low-velocity features of 02 separation and a shell of 05 diameter expanding at ∼60 km s−1. Solf (1984) suggested that the expansion rate of the nebula implies a distance of ∼400 pc and a corresponding nebular mass of ∼10−4 M☉. Corradi et al. (1999) presented narrowband images of HM Sge. There is a spatially extended circumbinary region of diameter 04, which is much larger than the expected spatial size of the binary orbit. In addition HM Sge has an extended structure of collimated knots out to about 9''. Corradi et al. (1999) suggested that these originate as a fast collimated wind from the white dwarf and accretion disk. With the Mira no longer obscured by dust in 1998 Schmid et al. (2000) observed the polarization in the Raman O vi line and derived the position angle of the binary axis. The Raman line polarization and the axis of the binary system are aligned parallel or perpendicular to the structure seen in the radio and narrowband optical images.
MERLIN maps of HM Sge at 6 and 18 cm, presented by Eyres et al. (1995), show that the inner nebula is bipolar with the peaks separated by ∼016. VLA measurements at 1.3 cm indicate that the peaks are moving apart at ∼9 mas yr−1. Eyres et al. (1995) concluded that an interacting wind model agrees with the observations. Assuming a shock velocity of 57 km s−1, derived from the brightness temperature, Eyres et al. (1995) found a distance to HM Sge of 3.2 kpc. Wallerstein et al. (1984) had previously demonstrated that the optical emission line profiles in HM Sge required an origin in a conical nebula resulting from interacting winds. Richards et al. (1999) continued monitoring the radio emission of HM Sge through the 1990s. They found hot spots that appear to be rotating in an inclined disk with a period of 90 yr. They revised the distance to ∼1 kpc and estimated the separation of the two stars to be 25 AU. The biconical outflow was attributed to winds from the nova outburst interacting with the pre-existing cool wind, while the disk was suggested to have an inclination of 60°.
Using HST and VLA observations, Eyres et al. (2001) were able to identify the binary components directly in images. The projected angular separation is 40 ± 9 mas with a binary axis position angle of 130° ± 10°. This agrees with the polarization position angle. Requiring consistency with a component separation of 50 AU (Richards et al. 1999) results in a distance of 1250 ± 280 pc. Eyres et al. (2001) found that the nebula shows two distinct regions. They associate these with the cool component wind or shielding of the nebula from the hot radiation field.
On a much smaller scale, the system contains an accretion disk around the white dwarf. Lee & Kang (2007) found that fits to high spectral resolution observations of the O vi λ6825 Raman line require a Keplerian thin disk around the white dwarf with an outer disk rim velocity of 26 km s−1 and a terminal velocity for the Mira wind of 10 km s−1.
Schild et al. (2001) presented mid-IR ISO observations of HM Sge. They reported that the mid-IR spectrum is dominated by silicate dust emission at a condensation temperature of 800–1600 K. The mid-IR spectrum also contains line emission from a number of high-excitation forbidden lines. Angeloni et al. (2007) interpreted the ∼500 km s−1 FWHM of the mid-IR emission lines as originating between the two stars in a wind interaction shock. The ionization stages represented and the strength of the lines are in agreement with a 4 × 10⁶ K plasma temperature (Mürset et al. 1997). Angeloni et al. (2007) reported a best fit with a preshock density of 5 × 105 cm−3 and a post-shock density of 108 cm−3.
An SED derived from photometry of HM Sge taken from the literature is shown in Figure 9. In Figure 10 the phased radial velocity data are presented. From the velocities we find a best fit pulsation period of 521 days. The photometric and spectroscopic periods are in fairly good agreement for HM Sge, differing by 6 days, ∼1% of the period.
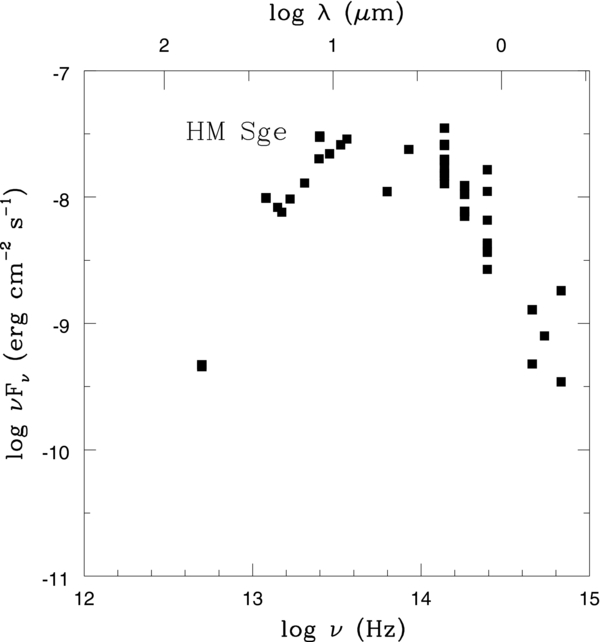
Figure 9. A representative SED for HM Sge based on literature photometry.
Download figure:
Standard image High-resolution image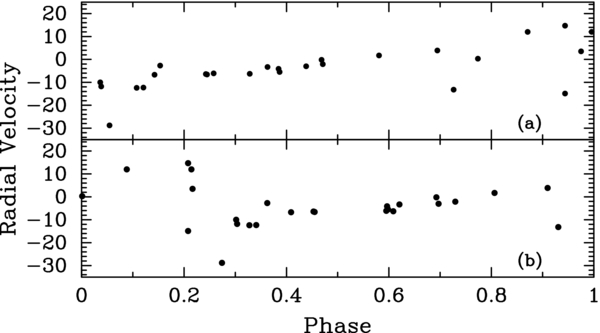
Figure 10. HM Sge velocities measured in the 1.0–1.6 μm region. Panel (a) phased with the photometric ephemeris of Munari & Whitelock (1989) P = 527 days and zero phase = JD 2,440,310 and (b) phased with the best fit spectroscopic P = 521 days and the photometric zero phase.
Download figure:
Standard image High-resolution image3.5. RR TEL = HEN 3-1811 = NOVA TEL 1948
3.5.1. Discovery
Fleming & Pickering (1908) first identified RR Tel as a peculiar variable star. Based on Harvard plates, Payne (1928) found a period of 384 days, which was revised to 387 days after another two decades of observation (Gaposchkin 1950). Mayall (1949) did a full search of the Harvard plate material for RR Tel historical variations. From 1889 to 1930 RR Tel had very low amplitude visual variability. The visual amplitude then grew until in the early 1940s it was ∼3 mag with a period of 387 days. RR Tel then underwent a slow nova outburst in 1944 (see light curve in Mayall 1949). Following the nova outburst, Mira variations in the blue (photographic) were not visible due to the brightness of the nebular emission line spectrum (Feast et al. 1983b). Infrared photometry confirmed the 387 day period of the Mira (Feast et al. 1983b). Kenyon & Bateson (1984) found that visual estimates of the brightness started showing periodic variability about 1976. From these data a period of 374 days was determined. Kenyon (1986) provided an ephemeris of Min(V) = JD 2,442,551.7 + 374.2E. Heck & Manfroid (1985) claimed that the period is not constant but varies between 350 and 410 days. Gromadzki et al. (2009), using SAAO data, computed a Mira period of 385 ± 4 days and an ephemeris for near-IR maxima of JD 2,442,207 + 385E.
RR Tel appears in the Henize (1976, Hen 3-1811) catalog of southern emission line stars. It was reported as having a nova-type spectrum by Thackeray (1950) with Payne-Gaposchkin (1955) confirming the spectral changes originally reported by Thackeray (1950). Following the 1944 outburst, an F supergiant spectrum evolved into an emission line spectrum with strong Fe ii and Ca ii lines. Velocities, measured by Thackeray (1953) in the early 1950s, ranged to −865 km s−1, consistent with material ejected by a nova. Seaquist (1977) detected radio continuum at 5.0 GHz. Subsequent work has shown the existence of shocks in the circumstellar material and the nearby ISM (Contini & Formiggini 1999). RR Tel has a rich emission line spectrum in the visual with many forbidden and permitted lines present for a large range of ionization states. Thackeray (1977) presented an extensive survey of the nebular spectrum in the visual. Typical velocities are in the range −64 km s−1 for hydrogen to −56 km s−1 for helium. The nova outburst is reviewed by Nussbaumer & Dumm (1997).
3.5.2. The Mira and the Hot Star
Allen et al. (1978) detected strong H2O and weak CO bands in the K-band spectrum of RR Tel, implying that the late-type star in this system is an oxygen-rich, late-type Mira variable. The oxygen-rich nature of RR Tel is confirmed by the presence of TiO bands in the red (Webster 1974). Schulte-Ladbeck (1988) estimated the RR Tel spectra class as ⩾M5. Mürset & Schmid (1999) classified the spectral class as M6.
Mürset et al. (1991) suggested a temperature for the hot star of 140,000 K with a radius of 0.15 R☉ and a luminosity of ∼5000 L☉. For the same temperature Nussbaumer & Dumm (1997) estimated a radius of 0.11 R☉ and a luminosity of 3700 L☉. RR Tel was cataloged as a luminous supersoft X-ray source (SSS) with a bolometric flux of 1.3 × 1037 erg s−1 by Greiner (2000). There are only 10 galactic SSSs known and all are believed to be massive white dwarfs in binaries (Greiner 2000; Di Stefano 2010).
3.5.3. Dust
Feast et al. (1983b) concluded that the dust is at least partly heated by the hot star in the system. Their near-IR photometry gave a dust temperature of ∼1000 K. Based on IRAS data, Anandarao et al. (1988) found a 248 K dust shell with a radius of 173 AU. Penston et al. (1983) computed the radius of the emitting area of the nebula to be between 47D2/3 and 935D2/3 AU, where D is the distance in kpc. The expansion velocity of the nova as computed by Thackeray (1977) gives a radius of ∼670 AU for the nebula in rough agreement with a distance of a few kpc. Eriksson et al. (2008) found that the Fe ii fluorescence nebula has a mean radius of 450 ± 50 AU. Munari & Whitelock (1989) noted that among all the well-studied D-symbiotics, RR Tel was the only one that had not been observed to undergo a dust obscuration event. However, Kotnik-Karuza et al. (2007) recently reported such an event. They also found a dust temperature derived from near-IR photometry of 750 K. Contini & Formiggini (1999) and Angeloni et al. (2010) model the emission line spectrum and SED of RR Tel. They find that 400 K and 1000 K dust is present. Both IRAS-LRS (Anandarao et al. 1988) and ISO-SWS (Angeloni et al. 2010) spectra show that silicate dust is present but the silicate signature is weak, suggesting graphite grains are also present. As for V407 Cyg this suggests that the current oxygen-rich outer layers result from third dredge-up of hot-bottom-burned material. Literature photometry and the Whitelock et al. (1994) calibration of the mass-loss rate for oxygen-rich objects indicate a mass-loss rate of 3 × 10⁻⁶ M☉ yr−1.
3.5.4. Distance and Orbit
From the characteristics of the circumbinary nebula Thackeray (1977) estimated a lower limit to the distance to RR Tel of ∼2.5 kpc. Feast et al. (1983b), using a J-band period–luminosity relation, set a distance of 3.6 kpc. Whitelock (1988) revised the distance to 2.6 kpc based on a K-band period–luminosity relation. Using the same relation, Gromadzki et al. (2009) found a distance of 2.5 kpc. The K0 − [12] color measured by Gromadzki et al. (2009) gives a mass-loss rate of 1.6 × 10⁻⁶M☉ yr−1.
From Raman line spectropolarimetry Schmid & Schild (2002) determined orbital motion of 1 3 yr−1 for RR Tel. In 1999 the P.A. was 110°. In the case of a circular orbit the orbital period would be ∼300 yr. The semimajor axis of an orbit of period 300 yr is 56 AU or 22 mas at a distance of 2.5 kpc.
A SED derived from photometry of RR Tel taken from the literature is shown in Figure 11. In Figure 12 the phased radial velocity data are presented. From the velocities we find a best fit pulsation period of 375 days. The photometric and spectroscopic periods differ by 10 days, ∼3% of the period.

Figure 11. A representative SED for RR Tel based on literature photometry.
Download figure:
Standard image High-resolution image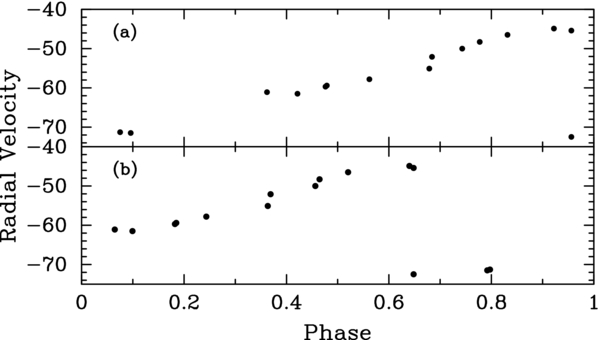
Figure 12. RR Tel velocities measured in the 1.6 μm region. Panel (a) phased with the photometric ephemeris of Gromadzki et al. (2009) P = 385 days and zero phase = JD 2,442,207 and (b) phased with the best fit spectroscopic P = 375 days and the photometric zero phase.
Download figure:
Standard image High-resolution image3.6. Overview
Table 6 provides a summary of the basic parameters for the five systems. The program stars were selected to have a history of nova-like variability. The violence of the outbursts can be judged by the change in brightness and the spectral characteristics of the outflow. The V407 Cyg event in 2010 had a change in brightness of 10 mag and outflow velocities approaching 3000 km s−1. HM Sge may have undergone similar brightening but reported outflow velocities are a factor of 10 less. RR Tel has reported outflow velocities near 1000 km s−1. All the program stars are at somewhat similar distances of a few kpc. Three of the program stars (V1016 Cyg, RX Pup, and HM Sge) have resolved nebula, demonstrating a prolonged history of eruptions,5 while the two (V407 Cyg and RR Tel) do not have resolved nebula. All five have a luminous hot compact companion, which is presumably a white dwarf that is undergoing a hydrogen shell flash. The dust in these systems can typically be modeled by two temperatures, ∼400 and ∼1000 K. For HM Sge the dust is uneven across the binary system and perhaps absent around the hot star. None of the Mira components are obscured by cool dust, as would be expected for very long period Miras. However, all the Miras discussed undergo occasional episodes of dust veiling by 1000 K dust, which is a unique phenomenon of D-symbiotics. The mass-loss rates derived from K − [12] colors are the same for V1016 Cyg, RX Pup, and HM Sge, 8 × 10⁻⁶ M☉ yr−1, and similar for RR Tel, 3 × 10⁻⁶ M☉ yr−1. Surprisingly these mass-loss rates agree, within the considerable scatter, with the mass-loss period relation for field stars (Whitelock et al. 1994). The V407 Cyg mass-loss rate is more than an order of magnitude lower than this relation. Orbital information seems most reliably obtained from high spatial resolution imaging of the components and spectropolarimetry. These both suggest component separations of perhaps 50 AU and orbital periods of hundreds of years. However, these estimates depend on the assumption of circular orbits, which is likely not the case for systems with large component separations (Fekel et al. 2007).
Table 6. Basic Parametersa
| V407 Cyg | V1016 Cyg | RX Pup | HM Sge | RR Tel | |
|---|---|---|---|---|---|
| Mira spectral type | M6 | M7 | M5.5 | M7 | M6 |
| Pulsation period (days) | 745–763 | 450–478 | 575–580 | 500–550 | 350–410 |
| Dust temperature (K) | ⋅⋅⋅ | 60, 1000 | 45,350,700–900 | 800–1000 | 280,750–1000 |
| Outflow velocity (km s−1) | 3000 | ⋅⋅⋅ | ⋅⋅⋅ | ⋅⋅⋅ | 850 |
| Hot star temperature (K) | ⋅⋅⋅ | 125000–150000 | 50000–100000 | 70000–160000 | 140000 |
| Hot star luminosity (L☉) | ⋅⋅⋅ | 35000 | 1000 | 10000 | 5000 |
| Distance (kpc) | 2.7 | 2.1–10 | 1.5 | 1.8–4 | 2.5–3.6 |
| Component separation (AU) | >20 | 84 | >50 | 25–50 | 56 |
| Orbital period (yr) | ⋅⋅⋅ | 200–600 | >200 | ⋅⋅⋅ | 300 |
| Additional notes | Li, M > 4M☉ | 20'' nebula | Resolved nebula | 9''–20'' nebula | ⋅⋅⋅ |
Note. aCompiled from Section 3.
Download table as: ASCIITypeset image
4. DISCUSSION
In the preceding sections the observational and historical results were summarized for the program SyNe and SyRNe. The implication is that the five binary systems presented in this paper are similar. This, however, is not certain because symbiotic behavior refers to evolutionary driven mass transfer between members of a binary system rather than a single evolutionary path. With this caveat we will next discuss the implications of the velocity measurements on pulsation, orbits, and stellar masses. We will then briefly review the current model for these systems and discuss how the infrared spectra support this model and provide further understanding of the dust formation process. Finally, we will discuss the evolution of D-type SyN and SyRN systems.
4.1. Pulsational and Orbital Velocities
The velocity curves (Figures 4, 6, 8, 10, and 12) are essentially identical to those observed for a wide variety of isolated Miras (Lebzelter et al. 2005). The discontinuous velocity curves are a distinguishing feature of Miras among the late-type variables and demonstrate conclusively that the red giant in these systems is a Mira. This is hardly surprising given that extensive infrared photometric observations show large amplitude stellar variability and medium-resolution near-IR spectroscopy shows strong H2O absorption bands (Section 3).
For isolated Miras infrared velocity curves have been compared to thermal microwave lines to establish a relation between pulsation velocities and the systemic velocity (Hinkle et al. 1989; Lebzelter et al. 2005). The pulsation velocity measured from the CO second overtone at phase 0.36 approximates the stellar velocity. The program stars do not have contemporaneous photometric and spectroscopic observations. Likely due to a combination of intrinsic period variations and uncertainties in the period multiplied by many cycles, the photometric phases appear shifted for the spectroscopic observations. Indeed we find that the phase of maximum velocity does not approximately align with zero phase as it does in isolated Miras (Figures 4, 6, 8, 10, and 12). We have taken the most positive velocity to be phase zero for computing the center-of-mass stellar velocity. This introduces an error of at most a few km s−1 in the systemic velocity. The derived heliocentric center-of-mass velocities for the Miras in the D-symbiotic system are presented in Table 7.
Table 7. Systemic Velocitiesa
| Star | IR Center of Massb | H i Emissionc | SiO Maserd | H2O Maserd |
|---|---|---|---|---|
| (km s−1) | (km s−1) | (km s−1) | (km s−1) | |
| V407 Cyg | −41 | ⋅⋅⋅ | −44 | −47 |
| V1016 Cyg | −74 | −33, −70 to −83, −102 to −107 | −64 | ⋅⋅⋅ |
| RX Pup | 16 | ⋅⋅⋅ | ⋅⋅⋅ | ⋅⋅⋅ |
| HM Sge | −5 | −2 | −117 | −112 |
| RR Tel | −64 | ⋅⋅⋅ | ⋅⋅⋅ | ⋅⋅⋅ |
Notes. aHeliocentric. bCurrent paper. cWallerstein et al. (1984). dCho & Kim (2010).
Download table as: ASCIITypeset image
The center-of-mass velocities can be compared with literature values for a number of spectroscopic features in the program stars. There are maser velocities for three of the program stars and optical absorption line velocities for one program star (Table 7). The relation between Mira maser velocities and the stellar center-of-mass velocity is time variable and complex (see for instance Cotton et al. 2010).6 In the case of the D-symbiotics the circumstellar geometry, critical for masers, is no doubt different than for single Miras due to interaction between the Mira circumstellar shell and the hot companion (Formiggini et al. 1995). Velocities for both emission and absorption optical lines in isolated Miras are not at the center-of-mass velocity. These are generally blueshifted by several km s−1 (Hinkle & Barnes 1979). Wallerstein et al. (1984) concluded that the range of values for symbiotic emission lines (Table 7) results from flows in the circumstellar shell.
D-symbiotics are semi-detached systems requiring orbital periods of decades or longer. It has been known for some time that the orbital periods of most D-symbiotics are in fact much longer than decades. For instance, Kenyon et al. (1988) find H ii data consistent with binary separations in excess of 100 AU, corresponding to periods on the order of 1000 yr. Similarly using 1.35–20 cm radio wavelength observations Seaquist & Taylor (1990) found the mean semimajor axis for D-symbiotics to be ∼200 AU with corresponding orbital periods of ∼1600 yr. These are, however, order-of-magnitude estimates that include significant uncertainties in the distances as well as uncertainties introduced by the geometry and physical model of the emitting regions.
A significant step forward in determining orbits for symbiotics was the use of spectropolarimetry to measure the orbital position angle from various Raman scattering features. As reviewed above for V1016 Cyg, spectropolarimetry suggests a period of ∼200 yr (Schmid & Schild 2002). For RR Tel spectropolarimetry gives an orbital period of ∼300 yr for a circular orbit. The corresponding semimajor axis is ∼56 AU (Schmid & Schild 2002). Unfortunately, this technique does not work for all systems since some objects do not have the required spectral features. For RX Pup Mikołajewska et al. (1999) used the permanent dust shell around the Mira to estimate a binary separation >50 AU corresponding to Porb > 200 yr. For HM Sge Eyres et al. (2001) identified the binary components directly in HST images. Taking a distance of 1250 pc gives a component separation of 50 AU and a period, assuming a circular orbit, of ∼200 yr. Munari et al. (1990) suggested an orbital period of ∼43 yr for V407 Cyg that is based on a very simple model of dust obscuration events that is now discredited.
In summary the program stars appear to have orbital periods of ∼200 yr or more. No velocity changes other than pulsation were detected in any of the program stars. For HM Sge archive infrared spectra dating to 1979 significantly extend the baseline. Even with 30 yr of monitoring orbital motion is not detectable for this system.
4.2. Masses
Component masses are key parameters for understanding binary systems and especially mass exchange systems such as the D-symbiotics. Given the very long orbital periods of SyN and SyRN binaries, input into this question from orbital data is not available. There are however indirect arguments that suggest the SyN and SyRN binaries are systems involving AGB progenitors of larger mass.
The activity of the systems provides one line of evidence. In the S-type symbiotics the highly eruptive subclass of SyRNe have massive white dwarfs (Mikołajewska 2010). This suggests that the similarly eruptive D-type SyRN, V407 Cyg, will also contain a massive white dwarf. As discussed in Section 3.1.2, the observation of Li in the V407 Cyg Mira requires a progenitor mass between 4 and 8 M☉. The V407 Cyg white dwarf progenitor had a larger mass. V1016 Cyg, RX Pup, and HM Sge have resolved nebula indicating prolonged nova activity. RR Tel was a nova in the 1940s but does not have a resolved nebula. However, RR Tel is known to have a massive white dwarf due to membership in the rare class of luminous SSSs (Greiner 2000). The RR Tel dust composition suggests hot-bottom burning in a massive AGB star.
Limits on the Mira progenitor mass also constrain the white dwarf mass. The current white dwarf companions evolved first and hence were the more massive stars in the unevolved binary systems. An initial mass–final mass relation for DA white dwarfs is given by Salaris et al. (2009). A 4 M☉ progenitor results in a 0.75 M☉ white dwarf with the assumption that the mass of the white dwarf results mainly from the progenitor and not mass transferred from the Mira. White dwarfs in the range typically discussed for S-type SyRNe, >1.1 M☉, require progenitor masses of >7 M☉.
The relation between the Mira and white dwarf progenitor masses can be explored statistically. White dwarfs with progenitor masses ≳4 M☉ were Cepheids at an earlier evolutionary stage (Turner 1996). Cepheid binary mass ratios thus provide another window for understanding the D-symbiotic novae. The distribution of Cepheid binary-system mass ratios for a range of primary masses has a peak at M2/M1 = 0.2–0.3 (Trimble 2008). The distribution can also be interpreted as a bimodal distribution with another peak at M2/M1 = 1. If the V407 Cyg system descended from a binary with the typical 3:1 mass ratio, the progenitor for the white dwarf would have a mass >10 M☉. With the initial-final mass relation for white dwarfs (Salaris et al. 2009), the mass of the white dwarf from a 10 M☉ progenitor is ∼1.1 M☉. Similarly the RR Tel massive white dwarf suggests the progenitor for the current Mira had a mass in the 3–4 M☉ range. Of course the Cepheid mass ratio is a probability with a range of allowed ratios including 1:1. Obviously in the case of V407 Cyg the more massive member of the unevolved binary did have a mass low enough to evolve as an AGB star.
The pulsation periods provide additional information about the masses. It is known that longer period Miras are typically more luminous and massive (Glass & Feast 1982; Vassiliadis & Wood 1993). Based on Table 5 of Belczyński et al. (2000), the average pulsation period for the known D-symbiotic SyN and SyRN Miras is 543 days as compared to an average pulsation period of 391 days for the other D-symbiotics.
The pulsation amplitudes also provide some insight into the masses. Lebzelter et al. (2005) reviewed the near-infrared velocity amplitudes for all the long period variable (LPV) data in the literature. These data appear shaded in Figure 13. The family of LPVs typically consists of overtone pulsator semiregular variables (SRVs) and fundamental pulsator Miras. Lebzelter et al. (2005) showed that SRVs typically have velocity amplitudes <10 km s−1, and most of the Miras have velocity amplitudes peaking around 23 km s−1. For the LPVs a range of masses can occupy the same location on the period–luminosity relation. Lebzelter et al. (2005) suggested that this range of mass gives the period–luminosity relation its finite width. They also argued that mass is a parameter for the velocity amplitude. Figure 13 includes in the unshaded boxes velocity amplitudes for the Miras discussed in this paper. Four of the five Miras have velocity amplitudes at the extreme of the distribution. Only V1016 Cyg falls in the typical range. Because V407 Cyg has a large velocity amplitude (29.2 km s−1) and an arguably large mass (⩾4 M☉), we suggest that the large amplitude Miras associated with RX Pup, HM Sge, and RR Tel have masses similar to V407 Cyg.

Figure 13. Number of LPVs vs. near-infrared velocity amplitude. The shaded area is from LPVs taken from the literature. The unshaded boxes are the symbiotic Miras discussed in this paper.
Download figure:
Standard image High-resolution imageIn summary the V407 Cyg system has clearly evolved from a system with a combined mass >8 M☉. The V407 Cyg Mira had a progenitor mass in the range 4 to 8 M☉. Two SyN systems, RX Pup and HM Sge, have periods in the 500–600 day range, large velocity amplitude, and a history of nova activity suggesting a progenitor mass >2 M☉. RR Tel with a 385 day period does have a large pulsation amplitude and a massive white dwarf companion. The absence of resolved nebula perhaps indicates that this is an intermediate-mass Mira just entering the helium flash stage. V1016 Cyg has a 474 day period with a velocity amplitude in the mid-range for Miras. Its resolved nebula is indicative of previous nova activity. The high activity level in V1016 Cyg could be driven by a massive white dwarf but supporting evidence is lacking.
4.3. Colliding Winds
Values for the orbital semimajor axis of the white dwarf and Mira SyN and SyRN systems inferred from various techniques are ≳50 AU implying orbital periods ≳200 yr. Assuming from the above discussion a mass of ∼3 M☉ for the Mira and a Mira pulsation period of ∼500 days, then the period–mass–radius relation of Vassiliadis & Wood (1993) indicates a Mira radius of ∼2.5 AU (∼4 × 1013 cm). Thus, the separation of the binary components is ≳ 20 RMira.
While this picture is similar to, but on a much larger scale than, that of the S-type symbiotics, the structure of the circumstellar envelope is surprisingly different for these classes of objects. Miras in the D-symbiotics have mass-loss rates at least an order of magnitude larger than the mass-loss rates of red giants or non-variable AGB stars in S-type symbiotics. Seaquist & Taylor (1990) found the D-symbiotics to have radio emission from an extended volume surrounding the binary, a feature not seen in the S-type symbiotics. They concluded that the mass exchange process is different between the classes of objects. Subsequent work has shown that the S-type symbiotics have mass exchange through a Roche lobe while D-symbiotic systems have mass flow through a wind interaction zone (Kenny & Taylor 2005).
Colliding wind models developed by Girard & Willson (1987) and Kenny & Taylor (2005) use momentum conservation in the interacting winds to derive the geometry, mass, and velocity distribution of the circumbinary nebula. In the simplest case the winds collide on a conic surface with the apex angle determined by the product of m =  , the ratio of the mass-loss rates for the hot and cold components, and w = vh/vc, the ratio of the wind velocities for the hot and cold components. mw also sets the direction of the conic, with greater than 1 encasing the cool star, and the distance of the interaction from each of the stellar components. The collision interface contains a wind interaction zone that is thin compared to the binary separation, turbulent, and with an outflow velocity away from the apex of the collision cone. The wind interaction zone is bounded by a strong shock front facing the white dwarf and a weak shock front facing the Mira. The collision fronts are geometrically thin but can have temperatures as high as 106 K.
For the systems discussed here the white dwarf and the Mira both have significant mass outflow. Miras in the superwind stage have outflow velocities of ∼15 km s−1 and mass-loss rates of ≳ 10−5 M☉ yr−1 (Vassiliadis & Wood 1993). During the shell hydrogen burning associated with nova eruptions (Iben 2003), the white dwarf can have an outflow velocity of 1000–3000 km s−1 (Table 6) with a mass-loss rate exceeding the Mira mass-loss rate. The RX Pup white dwarf, for instance, can eject ∼10−3 M☉ during a single hydrogen burning event (Allen & Wright 1988). The white dwarf mass-loss rate can be highly variable. The quiescent hot white dwarfs found in non-eruptive D-symbiotic systems resemble central stars of PNs with mass-loss rates of ∼10−8 M☉ yr−1 (Nussbaumer & Walder 1993). Assuming the SyN systems have two components of equal mass-loss rate, mw is of order 100. From Table 1 of Girard & Willson (1987) the interaction zone will be ∼10% of the binary separation, i.e., ∼5 AU or ∼2 R*, from the Mira for the typical orbital parameters discussed above. Figure 14 is a cartoon of an mw = 100 wind interaction zone.
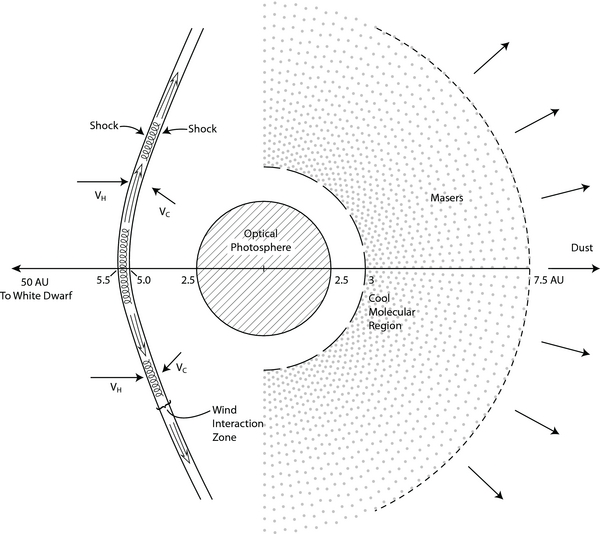
Figure 14. A cartoon of an mw = 100 wind interaction zone. The wind interaction zone, where the winds from the hot and cool stars of velocity vH and vC collide, is 0.5 AU thick (Kenny & Taylor 2005). Increasing the mass flow from the white dwarf results in both a decreased distance between the interaction zone and the Mira and an increased curvature of the interaction zone around the Mira. The flow in the wind interaction zone is turbulent with an outflow from the apex. Hot dust condenses in the interaction zone. The Mira photosphere is shown with a radius of 2.5 AU. The dimensions of the extended Mira atmosphere follow from Reid & Menten (1997). Observational evidence requires considerably more disruption of the Mira circumstellar environment than indicated in the figure.
Download figure:
Standard image High-resolution imageIn the Reid & Menten (1997) description of an isolated Mira circumstellar environment, dust condenses between 3 and 4 R*, and SiO masers originate at less than half this distance from the Mira. For SyN systems undergoing nova outbursts mw can be significantly larger than 100, and the wind interaction zone can penetrate to a few Mira radii disrupting the outer photosphere and inner circumstellar environment. Seaquist et al. (1995) undertook a sensitive search for OH and H2O masers in symbiotic Miras. They found a large deficiency in masers in symbiotic Miras as compared with isolated Miras and proposed that this results from the white dwarf wind. This is in agreement with wind interaction disrupting the circumstellar and outer Mira photospheric environment (Figure 14).
The wind interaction model explains many observational aspects of D-symbiotics. For instance Nussbaumer & Walder (1993) proposed that jets and collimated outflows, noted in Section 3 for RX Pup and HM Sge, result from colliding winds. Shocks and a wind interaction zone have been used to explain the emission line spectra reported by Wallerstein et al. (1984), Formiggini et al. (1995), Contini & Formiggini (1999), and others. Kenny & Taylor (2005) fit 4.9 and 22.5 GHz images of the HM Sge nebular structure with a wind interaction model.
Wind interaction models also have been used to fit the SEDs (Angeloni et al. 2010). A major contributor to the SED of SyN systems is hot, 1000 K dust. All the dust in D-symbiotics is now believed to be heated by wind interaction by one or more of several mechanisms. Angeloni et al. (2010) proposed that dust grains from the AGB star are heated collisionally to 1000 K in the wind interaction zone by the ionized gas. Gehrz et al. (2005) noted that in a wide variety of objects 1000 K is the temperature of grains condensing in the post-shock zone at the base of an outflow. In a wind interaction model the grains would condense in the wind interaction zone. An alternative view for wind interaction heating has been presented for PN. The grains in the AGB material in PNs are excited pre-shock passage (Graham et al. 1993). Wallerstein et al. (1984) pointed out that the optical Fe ii lines in V1016 Cyg, which originate in the Mira, are reddened by the circumstellar dust, while the helium recombination lines of the hot star are not. As proposed in all three scenarios the dust is not circumbinary.
Formiggini et al. (1995) noted that the ionized region around the white dwarf can be ∼1015 cm (∼25 Mira radii), i.e., as large as the binary separation. Kenny & Taylor (2005) similarly pointed out that the ionizing radiation from the white dwarf penetrates the wind interaction zone. This does not preclude the presence of dust. Hot dust is present in PNs, which are also a wind interaction process, and co-exists with ionized gas (Woodward et al. 1992). The SED also indicates the presence of cooler dust. On the side of the Mira away from the white dwarf the lower density extended circumstellar shell interacts with the white dwarf wind heating the grains to ∼400 K (Angeloni et al. 2010).
Schild et al. (2001) noted that circumstellar dust in isolated Miras has different characteristics from dust in the wind interaction zone. Dust from isolated Miras is very extended, cold, and typically optically thin. The wind interaction dust originates in a geometrically much thinner but denser region. Schild et al. (2001) proposed that the presence of cool (400 K) and hot (1000 K) dust components is a distinguishing characteristic of D-symbiotics. Schild et al. (2001) noted similarities to WR+O systems, which also have episodic dust formation events. Simulations of the wind interaction zone in these hot binaries show that pockets of dust formation can occur due to instabilities (Folini & Walder 2000; Kenny & Taylor 2005).
4.4. Dust and the IR Spectrum
Feast et al. (1983a) first reported that the infrared excess in D-symbiotics is in some cases conspicuous into the near-IR region. The SED fits by Formiggini et al. (1995), Angeloni et al. (2010), and others confirm this. In addition to a large IR excess from hot dust many D-symbiotics also undergo episodes of enhanced dust obscuration. In such events the optical light fades and the thermal infrared brightens. A key property is that these events never occur in isolated Miras.
Ironically, as noted by Schild et al. (2001) a characteristic of the Mira components in the D-symbiotics is their lack of obscuration by cold circumstellar dust. Non-symbiotic Miras with pulsation periods longer than a few hundred days are typically obscured by cold (≲300 K) dust of their own making and are classified as either obscured carbon stars or OH/IR objects (Engels et al. 1983; Habing 1996). No symbiotic Mira, even those of very long period, is obscured by cold dust. For instance, three of the systems discussed in this paper, V407 Cyg period = 745 days, RX Pup period = 578 days, and HM Sge period = 530 days, have pulsation periods sufficient for the Miras to be in the superwind domain (Vassiliadis & Wood 1993), and such Miras would typically be dust obscured. The SEDs of V1016 Cyg (Figure 5), RX Pup (Figure 7), HM Sge (Figure 9), and RR Tel (Figure 11) show a large contribution from 400 K and 1000 K dust. The SED for V407 Cyg (Figure 3) shows much less dust.
4.4.1. 1.6 μm Spectra
The spectra of the D-type SyN systems in the 1.6 μm region (Figures 1 and 2) are dominated by FeH, CO Δv = 2, and atomic lines, all of which are photospheric in origin. Line weakening from dust obscuration is a conspicuous feature in the 1.6 μm spectra of some objects. Figure 15 presents a set of spectra from three program stars, centered at 1.562 μm, that shows a progression of line weakening with HM Sge being the most obscured. A time series of 1.6 μm spectra of HM Sge is presented in Figure 16. HM Sge underwent a dust obscuration event during the time that the spectra were taken. Significant changes in the line depths are apparent including periods when the spectra are nearly featureless.
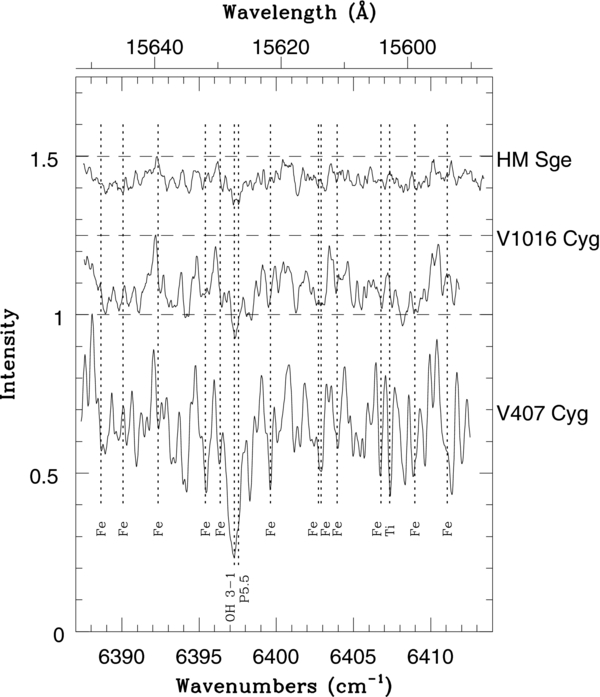
Figure 15. Comparison of the 1.56 μm spectra of three program stars observed in 2012 June. The weaker features are due to CO and possibly FeH. A number of strong unidentified features are also present.
Download figure:
Standard image High-resolution image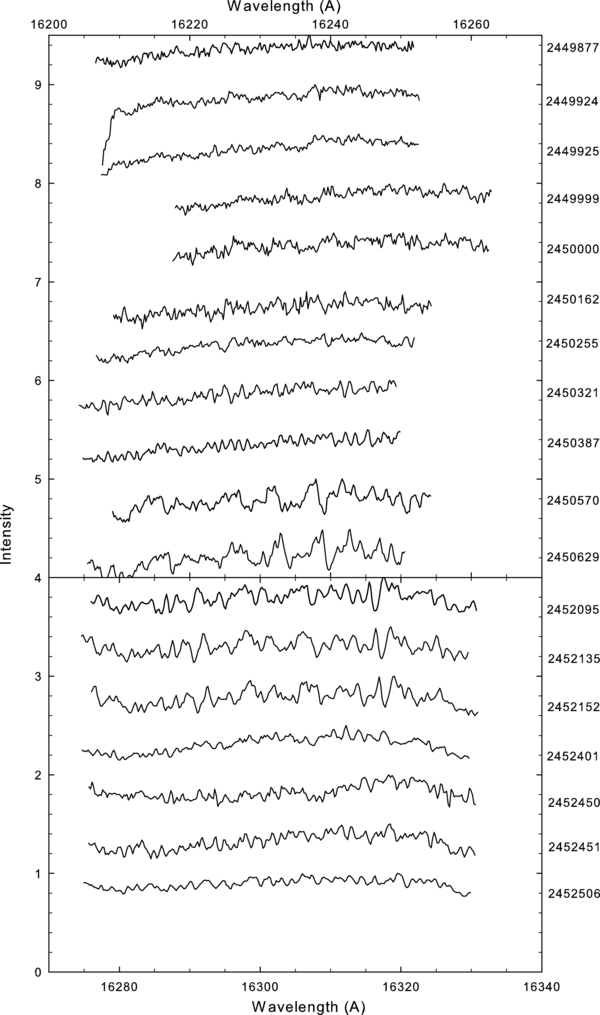
Figure 16. HM Sge spectra taken in the H band between 1995 June 8 and 2002 August 20. The top panel spectra, obtained at KPNO, approximately cover the wavelengths 16205–16260 Å. The bottom panel spectra, obtained at MSO, approximately cover the wavelengths 16275–16330 Å. The JD of the observation appears to the right. Conspicuous changes in line depth are due to changing obscuration.
Download figure:
Standard image High-resolution imageA correlation does not exist between the Mira pulsation phase of HM Sge and the visibility of the lines. In isolated, unobscured Miras the 1.6 μm CO is observable throughout the pulsation cycle (Hinkle et al. 1982). The 1.6 μm second overtone CO lines require photospheric conditions and are not populated at the temperature of the ∼1000 K circumstellar dust. The spectrum has been obscured by either scattering or continuous emission by dust.
In Figure 17 the dates of our H-band spectroscopic observations of HM Sge are compared with the near-IR photometry of Taranova & Shenavrin (2000) and Shenavrin et al. (2011). The nearly featureless spectra, observed early in our investigation (JD ∼ 2,450,000), correspond to a prolonged dust obscuration event that is conspicuous by decreased flux in the J band. This suggests that scattering by dust produces the obscuration at 1.6 μm. The obscured spectra around JD ∼ 2,452,500 do not correspond to a long-term photometric obscuration event. Thus, we suggest that dust obscuration events of short duration also occur.
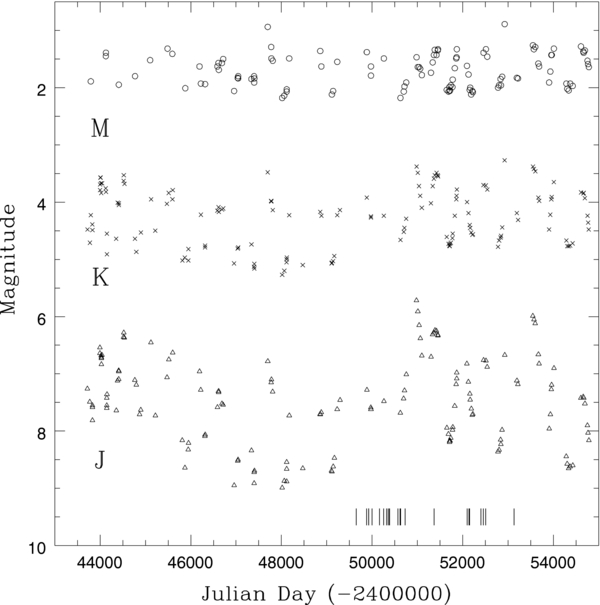
Figure 17. JKM-band photometry of HM Sge taken from Taranova & Shenavrin (2000) and Shenavrin et al. (2011) covering a span of about three decades. The epochs of the 1.6 μm spectra are shown by the vertical lines above the abscissa. The 527 day Mira pulsation is apparent in all three channels but the J band is also strongly affected by variations in the obscuration.
Download figure:
Standard image High-resolution image4.4.2. 2.3 μm Spectra
A few observations of the program stars were made at wavelengths longer than 1.6 μm. The 2.31 μm region (Figure 18) contains CO Δv = 2 lines and H2O lines. Some of the lines in this spectral region have low-excitation energies potentially allowing an origin in a circumstellar region. However, no features appear in our spectra at multiple or shifted velocities or with conspicuously larger depth suggesting an origin other than photospheric. Two additional spectra were taken of each of the objects in Figure 18 to explore the region around the 2–0 band origin. Similarly, no conspicuous circumstellar features are present. We also have spectra of other 2.3 μm regions in V1016 Cyg and RR Tel. These also have shallow lines and a photospheric spectrum without circumstellar features.

Figure 18. Comparison of the 2.3 μm spectra of three program stars observed in 2012 June. The primary absorption features are CO and H2O lines.
Download figure:
Standard image High-resolution imageFour HM Sge spectra centered at 2.31 μm, spanning over 30 yr (Table 8) from 1979 through 2012, are compared in Figure 19. The 1979 through 1997 spectra are identical except for observational uncertainties and telluric features. Photometric monitoring shows substantial changes in the dust obscuration during this time period (Schmid et al. 2000; Taranova & Shenavrin 2000). The 2012 spectrum has the same velocity as the others, but the features are much weaker. The 2.3 μm CO lines are shallow, with a maximum central depth of 28%, and relatively broad, with FWHM = 25 km s−1, at an unchanging velocity (Tables 7 and 8) of −2 km s−1, a few km s−1 blue of the Mira center-of-mass velocity. The excitation temperature of these CO lines is 2200 ± 500 K, a close match to the Mira photometric temperature (Feast et al. 1983a).
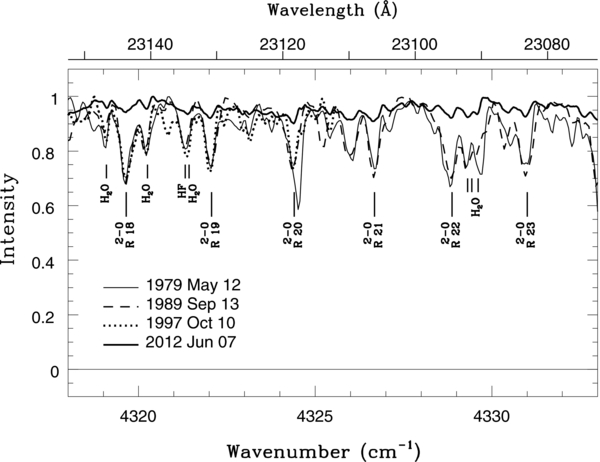
Figure 19. HM Sge spectra observed on four dates spanning more than 20 yr. The four spectra have the same velocity, −2.3 ± 0.6 km s−1. Note the striking similarity of the spectra from 1979 though 1997. Differences between these spectra can be attributed to noise and uncanceled telluric lines. The 2012 spectrum has the same features but much weakened.
Download figure:
Standard image High-resolution imageTable 8. HM Sge 2.3 μm Results
| Date | HJD | Phasea | Wavelength | S/N | Res | CO Δv = 2 | CO Δv = 3 | H2O |
|---|---|---|---|---|---|---|---|---|
| −2,400,000 | (μm) | (λ/Δλ) | (km s−1) | (km s−1) | (km s−1) | |||
| 1979 May 12 | 44005 | 0.97 | 2.0–2.5 | 60 | 32000 | −1.6 | ⋅⋅⋅ | −1.6 |
| 1989 Sep 13 | 47782 | 0.06 | 1.5–2.5 | 40 | 28000 | −2.3 | −7.3 | 2.1 |
| 1997 Oct 10 | 50732 | 0.59 | 2.307–2.315 | ⋅⋅⋅ | 50000 | −2.3 | ⋅⋅⋅ | ⋅⋅⋅ |
| 2012 Jun 7 | 56086 | 0.64 | 2.307–2.315 | ⋅⋅⋅ | 50000 | −3.0 | ⋅⋅⋅ | ⋅⋅⋅ |
Note. aAssuming IR maximum on 43487.44 and period of 532.89 days.
Download table as: ASCIITypeset image
The 2.3 μm spectra of the D-symbiotic novae are unlike any other late-type spectra. While the D-symbiotics contain a Mira variable, D-symbiotics and Miras have very different 2.3 μm spectra. Figure 20 includes a spectrum of the 430 day period oxygen-rich Mira R Cas. R Cas has an M7e spectral type (Keenan et al. 1974) and strong water vapor lines (Hinkle et al. 2000), making it a good reference spectrum for HM Sge. The CO first overtone region in isolated Miras such as R Cas is characterized by very deep lines with blended velocity components. The velocities of the lowest excitation lines differ from those of the higher excitation lines. Both the line depth and velocities are the result of a contribution to lower excitation lines by a cool molecular region at a different velocity (Hinkle et al. 1982; Tsuji 1988, 2008). Figure 20 also includes a spectrum of the 635 day period M10 OH-IR Mira NV Aur. NV Aur is moderately obscured with I−K ∼ 6.6 (Lockwood 1985). As illustrated in Figure 20 the CO low-excitation lines are weaker in NV Aur than in R Cas and the water lines stronger. While the high-excitation (J'' ∼ 80) CO lines are not present in NV Aur, the low-excitation CO lines have multiple velocity components. Both the weaker CO low-excitation lines and the missing high-excitation lines can be attributed to the later spectral type of NV Aur. In summary, spectral features arising in the cool molecular region and characterizing the 2.3 μm spectra of Miras make no contribution to the 2.3 μm spectra of D-type SyNe.
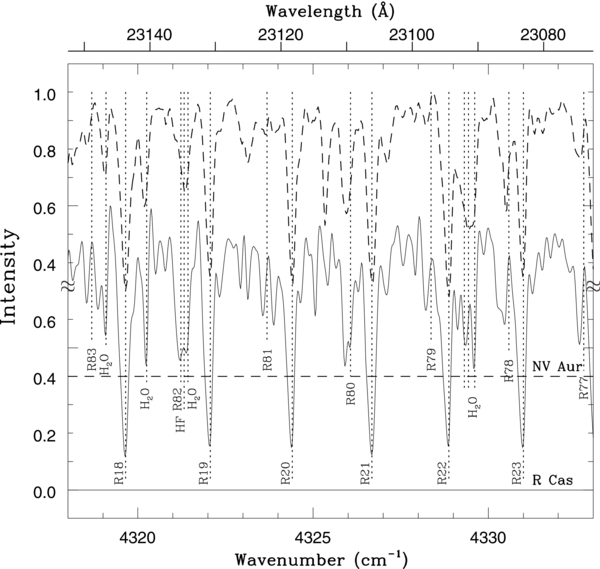
Figure 20. The same spectral region as shown in Figure 19 for the typical oxygen-rich Mira R Cas (1978 May 23 phase 0.12; bottom) and OH-IR Mira NV Aur (top). The dotted lines show the positions of the CO and H2O line frequencies shifted to align with the low-J CO lines. The high-excitation CO lines are shifted red from this position in R Cas and are absent in NV Aur. The low-excitation CO lines in R Cas have a second velocity component matching that of the high-excitation CO. The depth of the low-excitation CO lines is in striking contrast to the HM Sge spectrum.
Download figure:
Standard image High-resolution imageWe postulate that the 2.3 μm spectrum in D-SyN symbiotics is formed by 1000 K dust continuum emission combined with the photospheric spectrum scattered by the 1000 K dust layer. Scattering in a stationary dust layer would allow the velocity to be fixed, which is observed in HM Sge. While scattering increases to the blue, the 1.6 μm velocities are photospheric. For instance, in the 1989 September 13 HM Sge observation, which covers both the 1.6 and 2.3 μm regions, the CO second overtone lines at 1.6 μm have a velocity of −7 km s−1 matching the photospheric pulsation velocity curve of the Mira, while the CO first overtone lines at 2.3 μm have a velocity of −2.2 km s−1. The SED of HM Sge (Figure 7) shows that the 1000 K dust makes a strong contribution to the spectrum red of 2 μm. The 1.6 μm region is well blue of the peak of the 1000 K dust emission in the region where photospheric radiation becomes more important.
Based on the absence of 2.3 μm CO lines attributable to the 1000 K gas, a limit for the CO column density can be set at ≲ 1019 molecules cm−2. Assuming the solar C/H abundance this is ≲ 1022 H cm−2. Smith & Gehrz (2005) modeled the dust in three bipolar symbiotics. They found that the mass in the 1000 K dust is negligible compared to the mass in the cooler dust. The reason for this is that the dust mass scales as the grain properties, density, and luminosity to the inverse forth power of the temperature. So a region with hotter dust can be prominent in the SED but contain relatively little mass compared to a cooler, equally prominent region. Thus, it is not surprising that 1000 K dust continuum makes a significant contribution to the spectrum but that the gas along the line of sight is insufficient to produce observable features in the 2.3 μm region.
Included in the broad wavelength coverage of the HM Sge FTS spectra is the Brackett γ line at 2.16 μm. This line is present in emission ∼25% above the continuum with an FWHM of ∼117 km s−1. The heliocentric velocity of the peak of the Brackett γ emission is +47 km s−1 on 1979 May 11. Emission lines of similar width and velocity have been seen in the optical and ultraviolet (Solf 1984; Mueller & Nussbaumer 1985) although Wallerstein et al. (1984) reported a Balmer emission line velocity of −2 km s−1. Angeloni et al. (2007) found a broader, ∼500 km s−1, FWHM for mid-IR emission lines. Wallerstein et al. (1984) connected the optical emission lines with the wind interaction shock. The velocity width of the Brackett γ profile suggests a relation to the wind interaction shocks but not to the 1000 K gas.
4.4.3. 4.6 μm Spectra
Figure 21 illustrates spectra in the 4.66 μm region for the same three program stars shown in Figures 15 and 18. The spectrum of HM Sge has no photospheric absorption, a continuum presumably from dust, and CO emission lines. The spectrum is similar to those seen from dust disks around post-AGB binary stars (Hinkle et al. 2007). The velocity of the emission lines, −0.7 ± 1.5 km s−1 is, within the uncertainty, a match to the 2.3 μm velocity. The 4.6 μm emission line velocity is very different from the velocity of the hydrogen Brackett γ emission line. The spectrum of V1016 Cyg has absorption at the stellar velocity and slightly blueshifted emission. The V407 Cygni spectrum is dominated by stellar absorption. We note that none of the spectra of these three stars have cold circumstellar CO absorption features. Circumstellar CO absorption lines formed in an expanding circumstellar shell are ubiquitous 4.6 μm spectral features of isolated late-type giants (Bernat 1981).
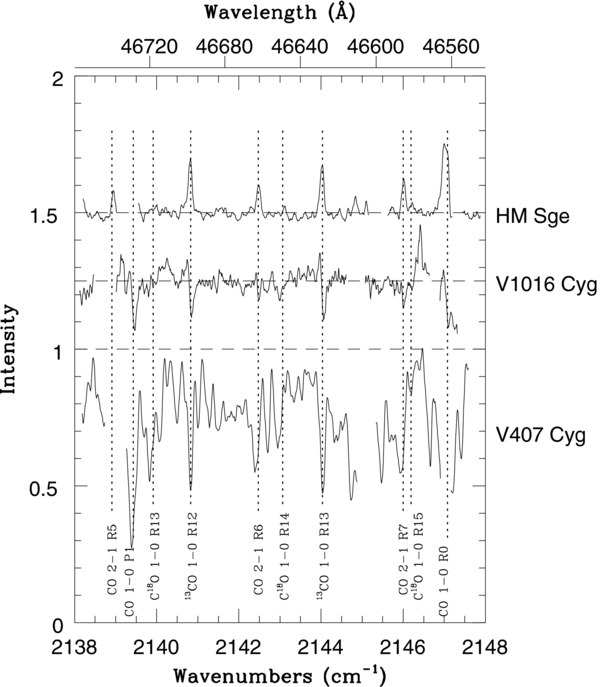
Figure 21. Comparison of the 4.6 μm spectra of three program stars observed in 2012 June.
Download figure:
Standard image High-resolution image
The flux of the low-J 2–1 12CO emission lines in HM Sge increases with increasing rotational quantum number J, implying that the lines are not saturated. If the excitation temperature equals the temperature of the dominant dust component at this wavelength, 1000 K, the line flux should peak at J ∼ 13. The two 13CO lines in Figure 21, R12 and R13, would then be at the peak flux. For an excitation temperature of 1000 K the 12C/13C ratio would be about 10, which is a typical value for isolated Miras (Little et al. 1987). Assuming that the CO lines are optically thin and have a 1000 K excitation temperature, a 2 kpc distance for HM Sge results in a CO emission measure of n(CO)Vsh ∼ 4 × 1046 molecules, where Vsh is the volume of the emitting region. Taking the carbon abundance as solar, the mass of the emitting region is ∼2 × 1026 g, ∼9 × 10⁻⁸M☉. For HM Sge the blackbody radius that is required to match the observed flux for 1000 K dust at a 2 kpc distance is 1.21 × 1014 cm or ∼3 Mira radii. From the relations of Smith & Gehrz (2005) the mass of the 1000 K dust is 7 × 10⁻⁹ M☉. The gas-to-dust ratio is then ∼120. Smith & Gehrz (2005) suggested a typical gas-to-dust ratio of 230 for symbiotic objects. From the limit to the column density and the emission measure the size of the gas emitting area is >1024 cm2. If spherical, the emitting region is 1 × 1012 cm ≈ 0.1 AU deep. The area found for the dust is ∼4 × 1028 cm2, suggesting that the gas is limited to an edge of the dust region.
The absence of detectable circumstellar lines in our spectra suggests that both the cool molecular region of the extended Mira atmosphere and the expanding circumstellar shell are absent. The weakness or absence of masers (Cho & Kim 2010), which are also formed in the molecular zone (Cotton et al. 2010), is additional proof of the disruption of the extended Mira atmosphere. Various authors (e.g., Whitelock 1987; Munari 1988; Munari et al. 1990) have invoked UV radiation from the hot companion to destroy dust or inhibit its formation in the circumstellar environment of D-symbiotics. However, in the case of UV disruption the hemisphere of the Mira shadowed from the white dwarf would have an inner molecular and cool expanding circumstellar shell. The interacting wind model includes wind penetration into the shadowed hemisphere of the Mira (Kenny & Taylor 2005) and explains the absence of spectral features from this region.
V407 Cyg, which underwent the most violent and recent eruption of any of the program stars, has the least dust contribution to the SED (Figure 3) and to the infrared spectra (Figures 15, 18, and 21). Both the white dwarf wind velocity and likely the white dwarf mass-loss rate are higher for this system than the others. The resulting mw ratio will be larger, resulting in a wind collision interface closer to the Mira. This appears to inhibit formation of dust perhaps through a narrowing of the wind interaction zone. The disruption of the weak D-symbiotic masers by nova outbursts (Deguchi et al. 2011) also suggests that the wind interaction zone is closer to the Mira during nova outbursts. In the contrasting case of HM Sge the wind interaction zone must be undergoing frequent dust formation events. The dust cannot have a lifetime of more than a few months in the wind interaction zone or the variations in the dust obscuration would have a much longer period than observed. Uneven flow or instabilities in the wind interaction zone between the wind shock fronts could result in enhanced dust formation (Folini & Walder 2000). As the white dwarf wind decreases, the apex of the wind interaction zone will move toward the white dwarf, and the interaction cone will open. This is also a possible source of instabilities.
4.5. A Pathway to Type Ia SNe?
The AGB star in D-SyN systems must lose several solar masses on its journey from the main sequence to the white dwarf sequence. A few percent of this mass, accreted to a massive white dwarf companion, could result in an SN Ia explosion. Most of the Miras in the D-SyN systems have pulsation periods requiring that they are in the superwind evolutionary phase and have mass-loss rates ≳ 10−5 M☉ yr−1. Variable activity of the white dwarf suggests large-scale instability in the wind interaction. Di Stefano (2010) argued that the (recurrent) nova activity of the white dwarf requires an accretion rate between eruptions of ∼10−7 M☉ yr−1. The white dwarfs in the D-SyN systems are more massive than typical. In particular, one of our program stars, RR Tel, is a luminous SSS, which marks the white dwarf as both massive and having a large accretion rate.
To become a thermonuclear SN, the evolution of a massive white dwarf via the single-degenerate route requires that its mass increase beyond the Chandrasekhar mass. The rate of mass increase is set by both the infall rate and the mass retention factor. The latter is the rate at which the accretion exceeds hot star wind mass-loss plus nova mass ejection events. Di Stefano (2010) discussed the criteria for mass retention. The mass accretion versus ejection remains poorly understood for symbiotic white dwarfs and beyond the scope of the current discussion (see, for example, Alexander et al. 2011). In addition, Di Stefano (2010) has argued that the SSS phase is too brief to accrete the needed Chandrasekhar mass.
We have argued that most of D-symbiotics in the sample reported here involve two stars with progenitor masses ≳3 M☉. The progenitor mass of the Mira requires that the individual components were main-sequence B stars with lifetimes to the AGB phase of ≲108 yr (Becker & Iben 1979). SNe resulting from these systems would be on a prompt timescale. Strolger et al. (2010) found that SNe Ia have a significantly longer time delay. This suggests that if the D-SyN white dwarfs do evolve to an SN stage the events are uncommon. The long orbital periods and detached orbits of the D-type SyN binaries preclude a future as a double degenerate SN.
5. CONCLUSIONS
D-symbiotics SEDs are characterized by circumstellar dust at two temperatures, ∼400 and ∼1000 K. The 1000 K dust is associated with the dust obscuration events, unique features of these stellar systems. A prevailing view has been that the 1000 K dust is related to the circumstellar shell of the Mira. We have shown that our program D-symbiotics do not have either a cool molecular region or an expanding circumstellar shell associated with the formation and distribution of dust into the circumstellar environment. This is in agreement with the absence or weakness of the circumstellar masers. The near-IR spectrum is formed by the photospheric spectrum scattered by the 1000 K dust. In the most obscured case we have observed the dust is optically thick at 4.6 μm and the CO fundamental lines are seen in emission.
The observations are in accord with wind interaction models. The structure of the circumstellar environment of the D-symbiotics is dominated by the collision of the Mira and white dwarf winds. Depending on the velocities and mass-loss rates of the white dwarf and Mira, the wind interaction zone can be in or near the extended Mira atmosphere. We propose that the 1000 K dust is formed in the interaction zone as mass-loss from the Mira enters the wind interaction zone. Similar processes are seen as the gas flows through circumstellar shocks in novae and post-AGB objects (Gehrz 1999; Gehrz et al. 2005). Variations or instabilities in the wind interaction zone produce the observed time variations in the dust obscuration. Similar dust obscuration events are seen in hotter wind interaction binary systems (Folini & Walder 2000). Spectra show time variations in the dust can occur on a timescale as short as months. In the very active system V407 Cyg there is little dust. In that system we propose that the wind interaction zone has been compressed by the mass flow off the white dwarf.
Spectral features from expanding circumstellar gas, typical of isolated Miras, would be expected in an undisturbed shadowed cone on the opposite side of the Mira from the white dwarf. The absence of these features suggests that this region is also influenced by the wind interaction shocks, in general agreement with wind interaction models. Angeloni et al. (2010) proposed that the 400 K dust is formed in the region of the Mira opposite the white dwarf where the shock accelerates through the decreasing density of the extended Mira atmosphere. Following Gehrz (1999) and Smith & Gehrz (2005), the dust mass of the 400 K region exceeds that of the 1000 K region by a factor of ≳100. This seems appropriate for an extended dust region as opposed to the transient shell represented by the 1000 K region.
Wind interaction models require typical Mira mass-loss rates and wind velocity. Indeed if, as proposed above, the 1000 K dust is formed in the wind interaction zone, time variability of months in obscuration requires on-going condensation of grains from gas lost by the Mira and the subsequent destruction of these grains. However, the Mira cool molecular circumstellar region (Figure 14) appears absent in these stars. Dust condensation in a cool molecular zone is a key link in the mass-loss process. Levitation of the photospheric gas by stellar pulsation must drive the mass several AUs to the wind interaction zone without grain condensation. This suggests that the mass-loss paradigm in isolated stars may be in need of revision.
Velocity time series at 1.6 μm measure the cyclic pulsation of the stellar photosphere in the Mira component of the D-symbiotic binary. The Miras in D-SyN systems are found typically to have large pulsation velocity amplitudes. Large velocity amplitude is a hallmark of massive Miras (Lebzelter et al. 2005). Pulsation velocity amplitudes combined with Li detections, X-ray activity from the white dwarf, and mass ratios for progenitor binaries suggest that four of the five Miras in the known D-symbiotic nova binaries have intermediate-mass progenitors. White dwarfs in S-type symbiotic novae are known to be massive and it is argued that this is also the case for the D-symbiotic novae. The V407 Cyg system is the most massive, with the progenitor mass for the Mira ⩾4 M☉ and a white dwarf mass of ≳1 M☉. None of the systems show any indication of orbital motion. This confirms the orbital periods of several hundred years previously suggested by both high spatial resolution imaging and Raman spectroscopy techniques.
The Mira progenitor must lose several solar masses on its way to becoming a white dwarf. A fraction of this material is accreted by the white dwarf, which then undergoes nova events. If these events fail to eject the accreted material, the white dwarf can become an SN. Ignoring selection effects in the literature sample of D-symbiotics, ∼25% of the ∼2000 D-symbiotics in the galaxy (Lü et al. 2007) are SyNe. While these objects appear not to be a major source of SNe Ia the D-symbiotics likely account for a subclass of SNe. The circumstellar environment of the D-type SyNe is sufficiently different from that of an isolated AGB star that spectroscopic signatures from the circumstellar shell in an SN explosion would be minimal. The lifetime on the thermal pulsing AGB of a star arising from an intermediate-mass progenitor is (3–5) × 105 yr (Vassiliadis & Wood 1993), suggesting at most one SN event from these objects in the Milky Way every 1000 yr.
Observations were obtained at the Kitt Peak National Observatory, Mt. Stromlo Observatory, and Gemini Observatory. We are grateful for the professional support and hospitality we received at all three observatories. The Gemini Observatory is operated by the Association of Universities for Research in Astronomy, Inc., under a cooperative agreement with the NSF on behalf of the Gemini partnership: the National Science Foundation (United States), the Particle Physics and Astronomy Research Council (United Kingdom), the National Research Council (Canada), CONICYT (Chile), the Australian Research Council (Australia), CNPq (Brazil), and CONICRT (Argentina). Observations were obtained with the Phoenix infrared spectrograph, which was developed and operated by the National Optical Astronomy Observatory. The spectra were obtained as part of programs GS-2003A-DD-1 and GS-2004A-DD-1.
We thank Robert Blum for carrying out some of the Gemini South observations. Verne Smith provided insight into third dredge-up abundances. Michael Skrutskie provided the NICMASS camera, which enabled much of this work. Jessica Moy gave valuable assistance in tracking down obscure journals and incorrect references in the literature. The research at Tennessee State University has been supported in part by the State of Tennessee through its Centers of Excellence program. This research would not have been possible without the SIMBAD database, operated by CDS in Strasbourg, France, and NASA's Astrophysics Data System Abstract Service. AAVSO data were also used in this research. The travel support for K.H.H. and R.R.J. provided by the NOAO office of science enabled this work. NOAO is operated by the Association of Universities for Research in Astronomy (AURA) under cooperative agreement with the National Science Foundation.
Footnotes
- 4
- 5
The referee has noted that the resolved nebula could in principle be a remnant of the AGB phase of the white dwarf. In this case the expansion lifetime of the remnant would require nearly equal masses for the white dwarf and Mira progenitor.
- 6
The maser velocities for HM Sge are very different from those of the center of mass and represent either an origin for the maser in a different region of the binary system or an origin in a different object along the line of sight.