


ABSTRACT
Observations from the EUV Imaging Spectrometer (EIS) on board Hinode have revealed outflows and non-thermal line broadening in low intensity regions at the edges of active regions (ARs). We use data from Hinode's EIS, Solar Dynamic Observatory's Atmospheric Imaging Assembly and Helioseismic and Magnetic Imager, and the Transition Region and Coronal Explorer instrument to investigate the boundaries of arcade-like AR cores for NOAA ARs 11112, 10978, and 9077. A narrow, low intensity region that is observed at the core's periphery as a dark band shows outflows and increased spectral line broadening. This dark band is found to exist for days and appears between the bright coronal loop structures of different coronal topologies. We find a case where the dark band region is formed between the magnetic field from emerging flux and the field of the pre-existing flux. A magnetic field extrapolation indicates that this dark band is coincident with the spine lines or magnetic separatrices in the extrapolated field. This occurs over unipolar regions where the brightened coronal field is separated in connectivity and topology. This separation does not appear to be infinitesimal and an initial estimate of the minimum distance of separation is found to be ≈1.5–3.5 Mm.
Export citation and abstract BibTeX RIS
1. INTRODUCTION
Solar active regions (AR), defined by regions of increased EUV and X-ray emission and structuring, show many coronal loops with a range of temperatures. The general observation is that small, hot (2–3 MK) loops make up the core of the AR, with larger, cooler (<1 MK) loops on the periphery. The recent study by Ugarte-Urra et al. (2009) makes a distinction between multi-temperature core loops (0.4–2.5 MK) and cooler (0.4–1.3 MK) peripheral loops. The core loops are generally found to be hotter and more dynamic in terms of brightenings, while the larger cool loops on the periphery appear more static. A spatial structuring of the AR in temperature and Doppler shift is also apparent. Del Zanna (2008) finds a persistent pattern of redshifts for structures seen in cooler lines and blueshifts in hotter lines for regions of weak emission at the edges of ARs. These blueshifts are observed at sharp boundary regions.
The outflow at the edges of ARs is well observed with Hinode (Del Zanna 2008; Doschek et al. 2008 and Hara et al. 2008). The presence of a second velocity component in the blue wing of AR spectral profiles was suggested by Hara et al. (2008). Analysis of the asymmetry of the spectral line profiles by De Pontieu et al. (2009) showed large asymmetries at the wings of the profiles that would indicate a second velocity component around −50 to −100 km s−1 along the line of sight (in the direction of the observer). Peter (2010) investigated the non-blended Fe xv λ284 line asymmetries and found strong evidence of the high velocity component in asymmetric profiles. Bryans et al. (2010) applied a double Gaussian fit to the line profiles and found a high velocity (up to −200 km s−1) component present in the outflowing regions at the edges of AR 10978. Their analysis suggests that the outflow may contain more unresolved components.
Large regions of outflow, in low intensity areas at the boundaries of ARs, are shown to be relatively steady on the order of a few days to at least six days (Del Zanna 2008; Doschek et al. 2008; Bryans et al. 2010) and have been suggested as contributors to the slow solar wind. These outflows may have low intensities due to their possible intermittency, as pointed out by Doschek et al. (2008). However, the intermittent events must persist for days to create the observations of seemingly steady outflow. The bright structures that form the edges of ARs have been shown to be episodic. Light curves and velocity measurements from fan like structures show a quasi-periodicity on timescales of 5–10 minutes (Guo et al. 2010), and loop structures also exhibit intensity flux variations in the 5–20 minutes ranges (Shimizu 1995; Ugarte-Urra et al. 2009; Scott et al. 2012). This similarity in time scales of the observed bright features forming the edges of ARs leads us to the possibility that the process that produces the bright quasi-periodic outflows may be responsible for the observed dynamic loop brightenings. These bright and dynamic events, on or just inside the AR boundary, could be effects of the energizing mechanism that produces the apparently persistent outflows just outside the bright AR boundaries.
The large regions of outflow at the edges of ARs are found to be coincident with unipolar magnetic regions (Doschek et al. 2008; Del Zanna 2008). Some authors suggest that the peripheral outflows may travel along an open magnetic field (Hara et al. 2008; Del Zanna 2008; Del Zanna et al. 2011). The distinction of core loops and periphery loops and the sharp boundaries found in intensity and velocity over unipolar regions brings to light the significance that topology has in affecting/producing the dynamic phenomena of the solar AR. Magnetic topology and the associated separators have been shown to be a possible contributor to the heating of AR loops through reconnection at the separators (Lee et al. 2010). The dynamic and transient brightening core loops are shown by Lee et al. (2010) to be associated with separators where the environment for successive reconnection exists.
We refer here to reconnection as a topological reorganization in the magnetic field. Changes in the topological flux have been measured by tracking the separation of Hα ribbons (Qiu et al. 2002), measuring speeds and sizes of supra-arcade downflows (McKenzie & Savage 2009), and by following coronal loops that connect two different ARs (Longcope et al. 2005). The site of reconnection may be removed from the site of energy conversion and several successive transient localized reconnection events may produce persistent high-temperature emission (Longcope et al. 2010) that may be evident as an arcade of post-flare loops. The flaring loop footpoints are shown to be very close to the "spines" of a magnetic field model. The spine lines follow separatrix surfaces that partition the coronal magnetic field and therefore map the reconnecting field lines. The expansion of the flare ribbons observed in UV and Hα indicates that energy release continues into the decay phase of the flare (Qiu et al. 2011). The continuing energy release suggests that a flare may consist of many individual loops forming and heating at different times.
Models that use topology and the change in connectivity to heat the corona have been developed by Demoulin & Priest (1997) using the idea of quasi-separatrix layers (QSLs). The QSL idea was invoked by Baker et al. (2009) to explain the observed outflow outside ARs. Other reconnection/topology based explanations of the outflow are given by Del Zanna (2008) and Del Zanna et al. (2011). A non-reconnection based idea is put forth by Murray et al. (2010), where AR expansion drives or contributes significantly to the outflow.
A coherent picture of how these different structures and phenomena are related is yet to be established. However, another observational consistency appears that adds to our developing view. Increased non-thermal spectral line broadening has been found near the footpoints of AR loops by Doschek et al. (2007), Scott et al. (2012), Scott & Martens (2011). The most interesting aspect is that the maximum line broadening is not on the footpoint, but directly adjacent.
The line broadening is generally positively correlated with blueshifted Doppler velocities (Doschek et al. 2007), while the intensity has been shown to be negatively correlated with line broadening near the footpoints of coronal loops (Scott et al. 2012; Scott & Martens 2011). Here, we find a region of outflow and increased line broadening at the boundary of an AR, where the topology changes from that of the core. This boundary region shows anti-correlation between intensity and line width. The boundary is evident as a dark band (in intensity images) just outside the bright footpoint region of an arcade type AR core. This band appears in a wide range of temperatures and can be found outside bright Hα ribbons. Observations by Czaykowska et al. (1999) and by Del Zanna et al. (2006) report outflow on the outer side of flare ribbons where the plasma is "less bright." While these studies propose chromospheric evaporation as the source of the outflow, we do not speculate on the source of the outflows here.
The studies of Czaykowska et al. (1999) and Del Zanna et al. (2006) are post flare observations that offer examples of outflows in low intensity areas occurring near the footpoints of bright loops. It is suggested here that there is a topological similarity between the post flare arcades and the bright loops that form an arcade-like AR core. The focus is to demonstrate that outflows occurring adjacent to the footpoints of bright arcade loops are located in regions of decreased intensity that reveal topological boundaries.
A recent study by Harra et al. (2010) observed the emergence of magnetic flux into an AR and described the "most distinctive feature" in their Doppler velocity images as a ring of outflow at the edge of the emerging flux region. This ring of outflow was found outside of the bright intensity ring. Line width enhancements also formed a ring outside the intensity ring. We show similar observations of outflow and increased line width outside an emerging region. A ring of outflow is found in the boundary between the newly emerged field and the preexisting field. The boundary is evident in the intensity images as a dark band that separates the excited loops of different topologies.
In this paper, we find dark bands (narrow regions of low intensity) that separate the arcade-like AR core loops and the cooler more static periphery loops. These narrow boundary regions exhibit outflow, and an anti-correlation between intensity and spectral line broadening. This boundary is shown to be coincident with where separators pass low in the corona. The re-appearance of this dark band suggests that it may be an observable feature of an AR and an initial quantification of the size scale is given.
2. OBSERVATIONS AND DATA ANALYSIS
The ARs examined for this study are: NOAA AR 11112 in 2010 October, NOAA AR 10978 in 2007 December, and NOAA AR 9077 in 2000 July. The main AR investigated is AR 11112. Observations of this AR from Hinode/EIS, Solar Dynamic Observatory (SDO)/Helioseismic Magnetic Imager (HMI), SDO/Atmospheric Imaging Assembly (AIA), and Kanzelhohe Hα are utilized. Hinode/EIS made 2 arsecond rasters of AR 11112 with 30 s exposures beginning at 11:15 UT and 12:50 UT on 2010 October 15. EUV Imaging Spectrometer (EIS) began rastering AR 10978 on 2007 December 11 at 16:24 UT with the 1 arcsecond slit and 15 s exposures. A Transition Region and Coronal Explorer (TRACE) 171 Å image from 2000 July 14 07:17 UT is used. This is ≈3 hr before the famous Bastille day "slinky" flare.
EIS data reduction was performed with the standard EIS SolarSoft procedure eis_prep. The prepped spectral data was fitted with single Gaussian profiles to determine the intensity, peak wavelength, and FWHM of the ion line profiles. The errors for the fit intensity are less than 2% and less than ±0.002 Å for the line widths. The rest wavelengths were calculated using the guidelines of Young et al. (2012). The errors in the absolute velocity are ≈ ± 5 km s−1. EIS recorded data for several spectral windows. We selected the unblended ion lines Si vii 275 (log(T[K]) = 5.8), Fe xiii 202 (log(T[K]) = 6.2), and Fe xv 284 (log(T[K]) = 6.4) for our analysis of asymmetry and line broadening. Densities were calculated using the density-sensitive intensity ratio of Fe xii (186.88/195.12 Å log(T[K]) = 6.1).
The unblended ion lines allow for the examination of asymmetric spectral profiles and line widths. The asymmetry analysis of the line profiles is similar to De Pontieu et al. (2009). This method assesses the asymmetry at specified distances from the line centroid for specific wavelength ranges. The wavelength range used for this study is 40 km s−1. The asymmetry is calculated in the 40 km s−1 windows, beginning at ±20 km s−1 and stepping ±10 km s−1, with the last window at ±200–240 km s−1. The wavelength range that corresponds to ±80–120 km s−1 is shown in this study. This method is a quick way to determine the nature of the asymmetry (Peter 2010) and it should be kept in mind that it is simply a first order look at the asymmetry. The correlations between intensity and line broadening were calculated by finding the linear Pearson correlation coefficient. Linear fits to the intensity and line broadening distributions were performed using the least absolute deviation method (Scott & Martens 2011).
A magnetic field extrapolation from HMI magnetogram data was used to locate the separators and spines of a potential field for AR 11112. The Magnetic Charge Topology (MCT) model is used to "compress" the HMI magnetogram data into flux regions that represent single point source magnetic poles. A potential field is extrapolated from these points. The locations of the magnetic nulls, separators, and spines can then be found and shown. Tarr & Longcope (2012) describe these methods in detail and provide an in depth investigation of the flux emergence and free magnetic energy evolution in AR 11112.
3. RESULTS
3.1. AR 11112
Figures 1 and 2 show a boundary at the southern edge of the arcade-like AR core. The boundary is apparent as a dark band that is low in intensity and stretches along the entire southern border of the arcade-like structure (pointed by the arrow in Figure 1). This can be seen in both the Fe xiii 202 and Fe xv 284 intensity images. Similarly, the maxima of the line broadening, Doppler velocity, and R-B asymmetry (Figures 1–2(b), (c), and (e)) highlight the southern boundary. Although the band is not readily apparent in the Si vii 275 intensity image (Figure 3(a)), the boundary can be seen in the line width (line broadening), Doppler velocity, and R-B asymmetry Si vii images. The maximum outflow velocities in the boundary/dark band region are around −20 km s−1 for Si vii and Fe xiii and −7 km s−1 for Fe xv. However, the velocity gradients in a line perpendicular to the band are 21, 28, and 22 km s−1 for Si vii, Fe xiii, and Fe xv. This indicates that the determined reference wavelength for Fe xv may be slightly longer relative to the Si vii and Fe xiii lines. The densities from Fe xii range from 109.0 to 109.1 cm−3 in the dark band. While the densities on the bright AR boundary range from 109.8 to 1010 cm−3.

Figure 1. EIS Fe xiii 202 log scaled intensity image (top left), HMI magnetogram (top right), linear scaled intensity image (middle left), line width (middle right), Doppler velocity (bottom left), and R-B asymmetry (bottom right) for AR 11112. The arrow indicates the dark band (as seen in intensity) that appears as a region of increased line broadening, Doppler shift, and R-B asymmetry.
Download figure:
Standard image High-resolution image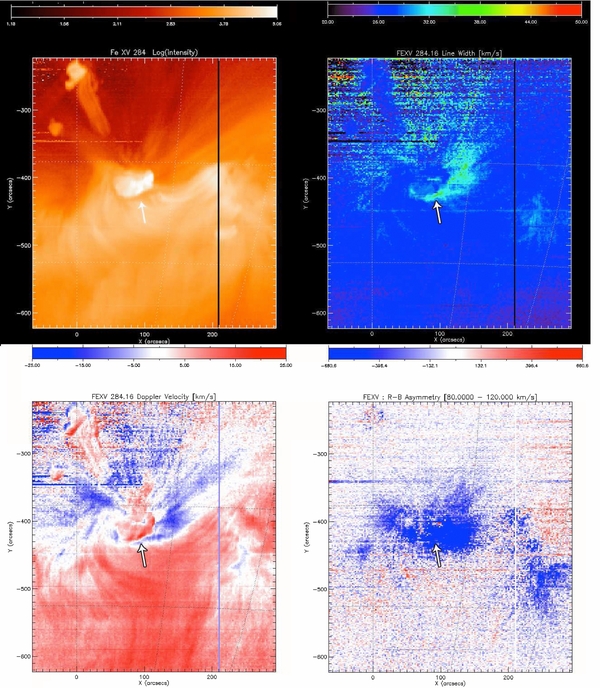
Figure 2. EIS Fe xv 284 log scaled intensity image, line width, Doppler velocity, and R-B asymmetry for AR 11112. Similar to the Fe xiii images, the dark band is seen in intensity and appears as a region of increased line broadening, Doppler shift, and R-B asymmetry.
Download figure:
Standard image High-resolution image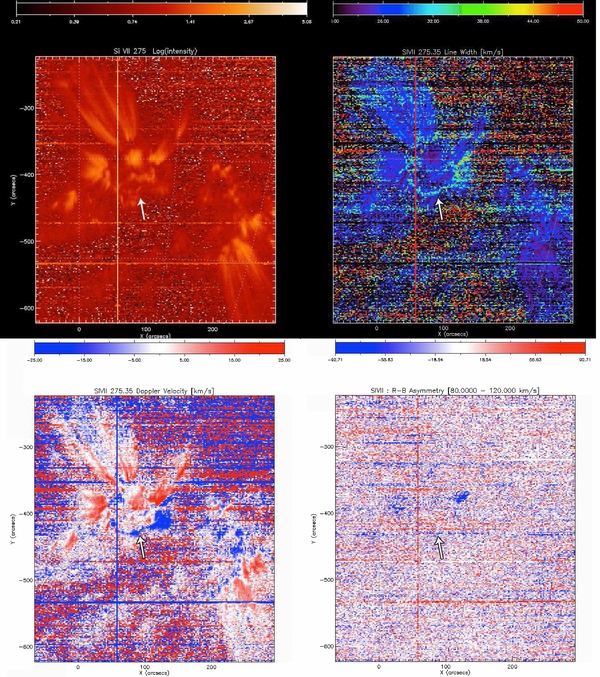
Figure 3. EIS Si vii 275 log scaled intensity image, line width, Doppler velocity, and R-B asymmetry for AR 11112. The dark band (as seen in the Fe xiii intensity) is not visible in intensity, but still appears as a region of increased line broadening, Doppler shift. The R-B asymmetry does not delineate the dark band region. The large blue-wing asymmetry is concentrated north and outside the AR near the footpoints.
Download figure:
Standard image High-resolution imageA large anti-correlation between intensity and spectral line broadening for AR 11112 is shown for a sub-region of the boundary/dark band region (Figure 4). The entire data set shows a negative correlation between intensity and spectral line broadening, indicating that the areas of spectral line broadening are dim and bright areas are un-broadened. The sub-region distribution is grouped in a region of the plot that departs slightly from the complete distribution, forming a "fin" like shape in the scatter plot (Figure 4). The least absolute deviation fits to the intensity/line width distributions are indicated by the solid lines of the scatter plot in Figure 4.
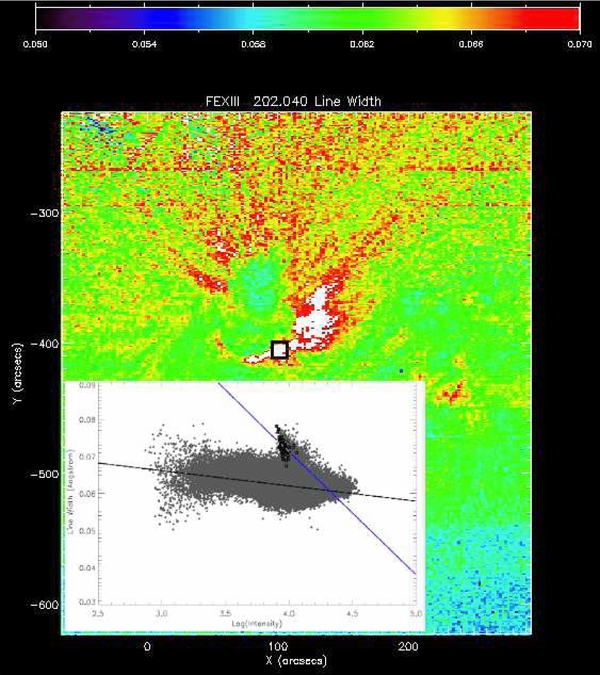
Figure 4. EIS Fe xiii 202 line width image with a subregion containing the dark band outlined by the black lined box. The scatter plot displaying the anti-correlation between intensity and spectral line broadening for AR 11112. The solid black line is the least absolute deviation fit to the entire data set. The blue line is the least absolute deviation fit to the selected subregion. The subregion displays a larger anti-correlation (low intensity, increased line width).
Download figure:
Standard image High-resolution imageThe analysis of the next EIS raster, beginning at 12:50 UT, shows similar results. The dark band persists in the EUV images. The EIS Doppler images show the same outflow along the southern boundary. The large line widths are found at the boundary region as well. The large scale topology evident in the EUV images did not change drastically. It is apparent from movies created from the AIA data that many small scale "loop restructuring" events occur within the core, with very few events crossing the dark band. Vertical cross sections that lie across (perpendicular to) the dark band from EIS and AIA were examined and a separation of 3–6 EIS pixels (≈2–5 Mm) and 4–10 AIA pixels (≈1.7–5 Mm) was found.
The boundary of the AR core is seen clearly in a variety of wavelengths corresponding to different temperatures. The dark band is apparent in the AIA 304 Å and 171 Å images (Figures 5(a) and (c)) as well as 131, 193, and 211 Å. Close inspection of the Hα and AIA 171 Å images indicates that as expected, the footpoints of the arcade-like AR core are co-spatial with the Hα ribbons. The dark band seen in EUV is located just outside the lower (southern) ribbon, where outflows are detected. The events that do cross the band quickly move across to the outer edge of the band where the EUV loops display a different connectivity or topology. These events are sporadic brightenings that cross the band and move to sustain the dark region between the topologically distinct groups of EUV loops.
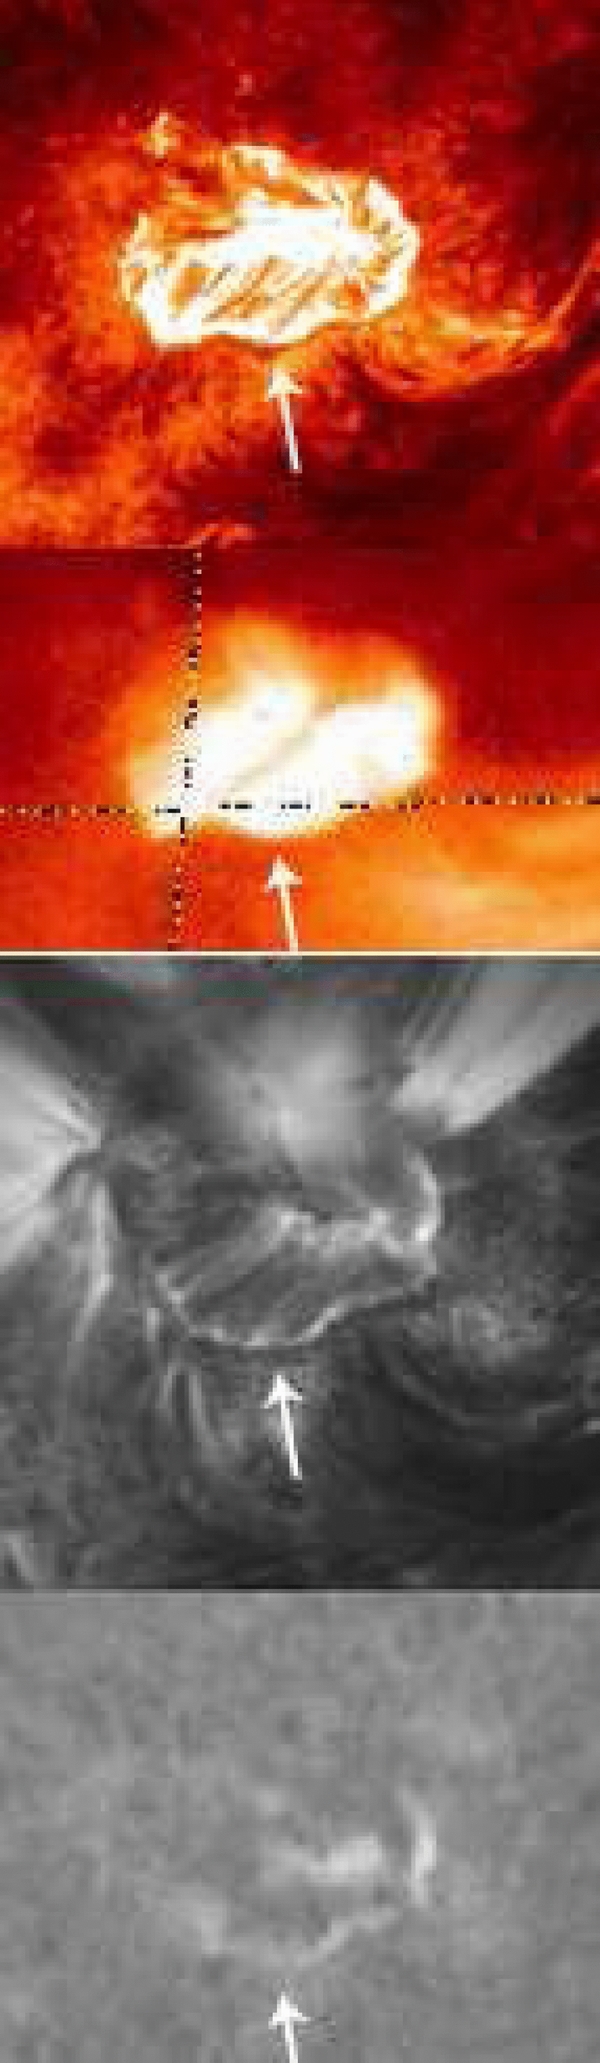
Figure 5. Core of AR 11112 seen in a number of different wavelengths. The top image (a): AIA 304 Å 23:22 UT. The second from the top (b): XRT Ti-poly 21:24 UT. Third down (c): AIA 171 12:13 UT. Bottom (d): Kanzelhoehe Hα 12:22 UT.
Download figure:
Standard image High-resolution imageInspection of the AIA EUV images of AR 11112 from October 14–17 indicates that the dark band can be maintained for days. Figure 6 shows a time stackplot of a vertical cross section (50 pixels in y) that spans the dark band region from October 14 18:26 UT to October 17 09:28 UT. The vertical cross section was taken from a location indicated by the arrow in Figures 1 and 5. The separation along the vertical strip varies in time, but a minimum, finite separation is maintained.
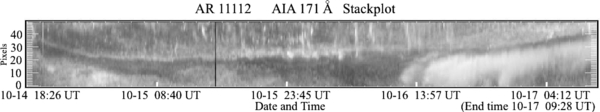
Figure 6. Stackplot of a cross section perpendicular to the dark band region in the location of the arrows in Figures 1–5. The dark band region begins at y = 30 on October 14 and is still visible at y = 40 on October 17, 09:28 UT.
Download figure:
Standard image High-resolution imageComparison of AIA 171 Å and HMI movies shows that the dark band is formed as new magnetic flux emerges into a region of pre-existing unipolar negative flux. This older negative flux closes westward to a corresponding region of pre-existing positive polarity flux. The new negative flux remains distinct from the pre-existing negative flux as it pushes slightly eastward from the site of emergence. The new positive flux pushes westward after emergence, remaining within the old negative flux region.
Activity in the form of hedgerow-like, dark outflowing material in AIA 171 Å at 10–14 07:12 UT begins as the opposite signed flux (positive) emerges into the existing field. By 10–14 18:26 UT, significant amounts of both positive and negative flux have emerged and moved away from their origins in opposite directions, pushing on the pre-existing flux. The dark band and the coronal loops that form the arcade-like AR core become distinct at this time.
The separation between the newly emerged field and original field is evident from the location of the dark band region and continues for more than three days (Figure 6). From 10–14 14:23 UT to 10–15 05:32 UT, the dark band seems to exist between two EUV ribbons formed by the footpoints of loops from the different topologies (see AIA movie). One ribbon feature is associated with the emerging flux (top) and the second ribbon feature is associated with the pre-existing flux. This occurs over a unipolar region of negative flux.
It should be noted that numerous other sites of smaller scale emergence are located within the pre-existing field (both positive and negative). For example, around 10–16 17:19 UT, flux begins to emerge into the region of existing positive flux (west side). Some hours later, there is an apparent dark band that forms a ring around the emerging arcade-like field. Similar to the observations described above, hedgerow-like dark outflowing material originates from this dark band region. This dark region is also located in a unipolar region.
The separators found in the MCT potential field extrapolation are shown as solid colored lines overlaying the HMI magnetogram in Figure 7. The non-green separators all connect to a coronal null point located above the newly emerged positive flux, indicating that the core is topologically separated from the surrounding field by a dome-shaped separatrix surface. This is observationally demonstrated by the arcade-like appearance of the AR core. The coronal null's separatrix surface converges at the photospheric boundary along spine lines, which demarcate the boundary between the old and new flux systems. The separators displayed over the AIA EUV image (Figure 8) indicate that the separators connect to the southern AR core boundary region (red solid lines in Figure 8) very near or coincident with the dark band seen in the EUV images. The dark band lies remarkably close to the spines that connect poles N87, N58, N67, and N49.
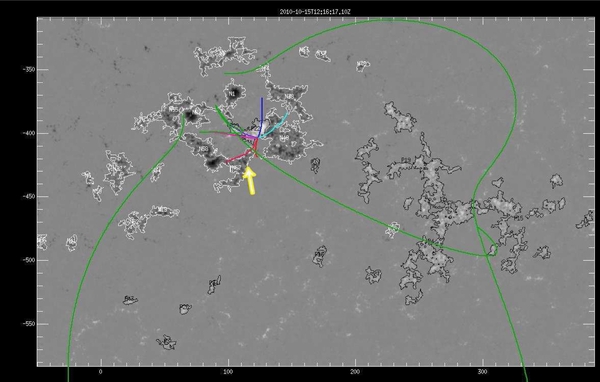
Figure 7. SDO HMI magnetogram of AR 11112 2010 October 15 12:16 UT with the magnetic flux concentrations outlined in white and black. P labels the positive poles and N the negative. The separatrices are shown by the colored lines. The non-green lines show the separatrices that are near the AR core.(An animation and a color version of this figure is available in the online journal.)
Download figure:
Standard image High-resolution image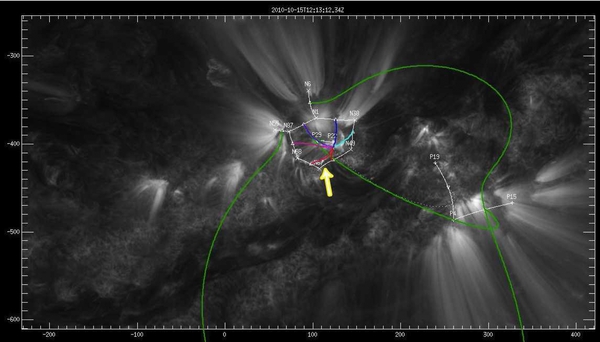
Figure 8. SDO AIA 171 intensity image of AR 11112 2010 October 15 12:13 UT with the separatrices shown by the colored lines. The non-green lines show the separatrices that are near the AR core. P labels the positive poles and N the negative. The white lines are the "spines" that connect the magnetic poles.(An animation and a color version of this figure are available in the online journal.)
Download figure:
Standard image High-resolution image3.2. AR 10978
A dark band that separates different topologies is evident in the EIS intensity images of AR 10978 (Figures 9 and 10(a)). The outer boundaries of an arcade-like AR core are highlighted in increased line width (line broadening), negative Doppler velocity, and blue wing asymmetry (blue R-B asymmetry). The Si vii Doppler image (Figure 10(c)) shows blueshifts in the boundary region, but there is only a slight dark band apparent in the Si vii intensity image. There is little asymmetry found for Si vii. The calculated Doppler velocities in the dark band region range from −8 to −25 km s−1 for all of the ions (Fe xiii, Fe xv, and Si vii) and are among the maximum blueshifted velocities for this AR. The densities in the dark band range from 109.0 to 109.4 cm−3, and on the bright boundary range from 109.8 to 109.9 cm−3. The intensity profiles perpendicular to the dark band indicate that the dark region is ≈3–5 EIS pixels (≈2–3.5 Mm) across.
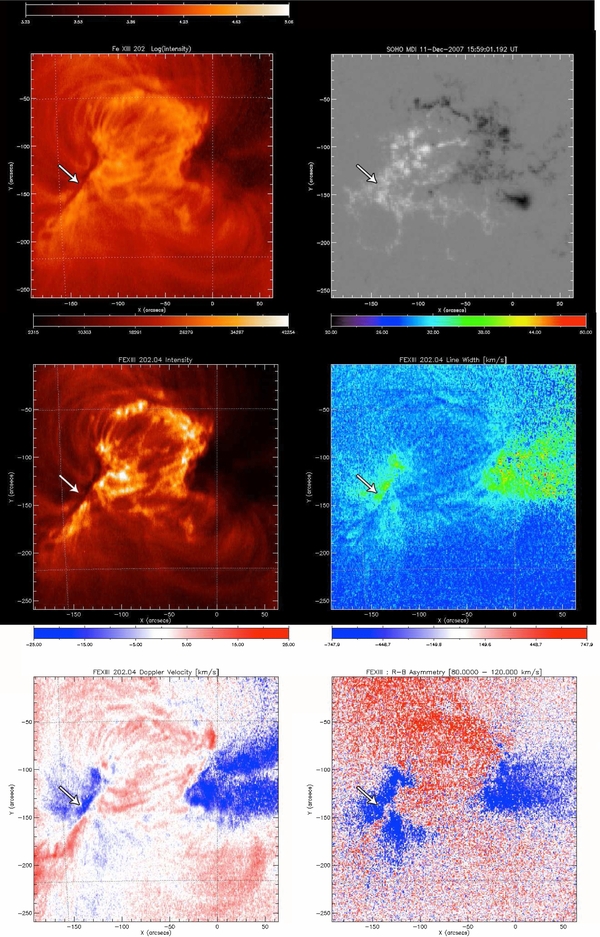
Figure 9. EIS Fe xiii 202 log scaled intensity image (top left), MDI magnetogram (top right), linear scaled intensity image (middle left), line width (middle right), Doppler velocity (bottom left), and R-B asymmetry (bottom right) for AR 10978. The arrow indicates the dark band (as seen in intensity) that appears as a region of increased line broadening, Doppler shift, and R-B asymmetry.
Download figure:
Standard image High-resolution image
Figure 10. EIS Fe xv 284 log scaled intensity image, line width, Doppler velocity, and R-B asymmetry for AR 10978. Similar to the Fe xiii images, the dark band is seen in intensity and appears as a region of increased line broadening, Doppler shift, and R-B asymmetry.
Download figure:
Standard image High-resolution image3.3. AR 9077
The TRACE 171 Å image taken before the famous Bastille day flare shows the presence of a dark band region (Figure 12). This is similar to the dark bands found in ARs 11112, 10978 and appears to separate coronal loops of different topologies. The cross sections taken across (perpendicular to) the narrow regions of the dark band show that the minimum distance of separation between the regions of different apparent topologies is ≈4–6 TRACE pixels (≈1.5–2 Mm).

Figure 11. EIS Si vii 275 log scaled intensity image, line width, Doppler velocity, and R-B asymmetry for AR 10978. The dark band (as seen in the Fe xiii intensity) is slightly visible in intensity and does not appear readily in the line broadening, Doppler shift, or R-B asymmetry images.
Download figure:
Standard image High-resolution image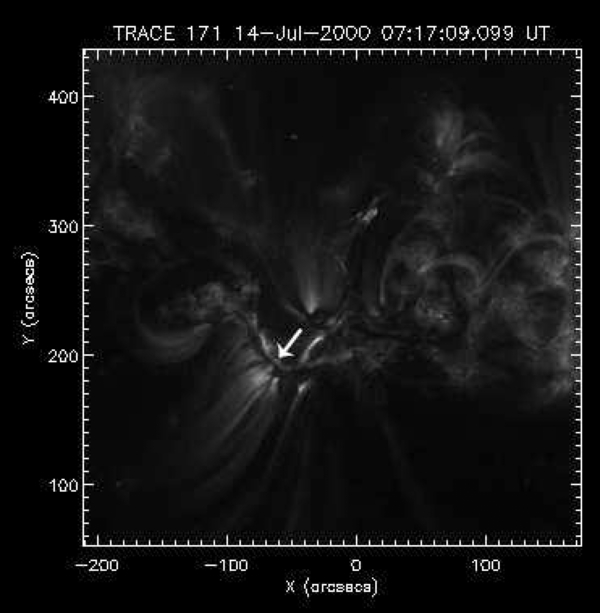
Figure 12. TRACE 171 Å image from AR 9077 2000 July 14 07:17 UT. The arrow indicates the location and orientation of the 20 pixel cross section.
Download figure:
Standard image High-resolution image
4. DISCUSSION
Observations at the boundaries of AR cores show a signature of outflow, low intensity, and large line widths in a narrow region between core loops and interconnecting loops. These signatures are found very close to the spines separating the magnetic flux domains. A variety of possible processes attempt to account for these specific signatures. Here, we discuss our observations in the context of these ideas.
Chromospheric evaporation has been employed to explain the outflowing plasma on the outer edges of post-flare coronal arcades (Czaykowska et al. 1999; Del Zanna et al. 2006). The chromospheric evaporation and condensation processes are responses to flaring plasma and are modeled using flare like conditions. Our observations indicate that the outflows outside coronal arcades are present long before the larger flares can supply the energy for this process. If the explanation of the outflowing material is to be chromospheric evaporation, then the energizing mechanism must be much steadier with smaller energies.
The blue asymmetry of the spectral line profiles could arise from a small but significant high speed velocity component (Hara et al. 2008). The interpretation put forth by De Pontieu et al. (2009) suggests that the upflows are a result of chromospheric jets. While this view accounts for the blue wing asymmetries, it does not aid in the explanation of the larger scale structures and events in ARs, such as why arcades form and how flares occur. The high speed component may be the explanation to our observations of blue wing asymmetries, but we look to the magnetic field and coronal topology for help in understanding how this dark band and the bright loops that define it are related to the larger scale structure and activity of ARs.
Bright loops that constitute much of the structured intensity in the corona reveal the visible shape, form, and connectivity of ARs. The bright loops presumably trace out the magnetic field. Invoking the magnetic field line concept allows for the study of the coronal field by investigation of its topology. These ideas suggest that the interesting activity will occur in conjunction with the topological elements known as nulls and separators.
These conceptions are agreeable since they provide a means to release stored magnetic energy by the transfer of magnetic flux between domains (Bratenahl & Baum 1976; Longcope et al. 2005; Birn & Priest 2007) and a location where separatrices should be observed. An inspection of the various multi-polar topologies (e.g., Figures 1 and 2 of Bratenahl & Baum 1976, Figure 8.15 of Priest & Forbes 2000) shows that the magnetic field is separated into multiple domains by separators. At the intersection of two such boundaries (the edge of four domains) lay separators, across which reconnection can occur. These separators connect down to null points in the photosphere, the spine lines of which link to form a chain along a set of unipolar sources. This is where (over unipolar regions) we find the narrow regions of low intensity, outflow, and increased line widths or dark bands.
The similarities in the ring like nature of the outflow in the emerging AR observed by Harra et al. (2010) and our observations of AR 11112 are striking. This ring separates the emerging flux with a pre-existing field. Masson et al. (2009) find a ring like footprint as a QSL corresponding to an elongated spine ribbon that is associated with a coronal null point. They observe that the field lines reconnecting at the null undergo slipping reconnection with a velocity that is dependent on the distance from the spine. This relates the newly reconnected loops with a larger scale structure and coronal topology. When considered in conjunction with the ring like outflow of Harra et al. (2010) and our observations, the detection of a narrow ring of low intensity (dark band) and upflows could be a sign that the coronal topology is conducive to flaring. Furthermore, the study of the shape, size, and morphology of this dark ring may help determine the size and configuration of flares in ARs.
It is interesting to compare the similarity of the basic three cell topologies of classic coronal configurations and that of the magnetosphere shown by Bratenahl & Baum (1976). A few curious similarities between the observations of both are worth mentioning. A density depletion layer is expected in collisionless magnetic reconnection (Shay et al. 2001). The density depletion layer is located around the separatrix. This cavity is observed in the magnetosphere (Retinò et al. 2006; Farrugia et al. 2011). The depletion layer is expected to be on the scale of the ion gyroradius. While we find a decreased density in the region surrounding the spine separatrix, the measured width of the dark band is more than a few orders of magnitude greater than the ion gyroradius, so it is simply an interesting comparison.
The possibility that reconnection may occur without null points, in regions of large connectivity gradients called QSLs, has been demonstrated by Priest & Forbes (1992) and Priest & Démoulin (1995). Reconnection occurs within a magnetic flipping layer where the field line velocity is greater than the plasma velocity. Here, the field line slips through the plasma, changing its connectivity and transferring flux.
Baker et al. (2009) suggest that AR outflows are a result of reconnection along QSLs. The QSLs they find are elongated ribbon-like features located over regions of upflows and, although not mentioned, over regions of low intensity. We find a narrow, low intensity region of finite width between the brightened (closed) loops of different domains that displays upflow. In the QSL framework, a QSL must be located somewhere between these two domains. The distance between the bright loops of different domains (1.5–3.5 Mm) represents a length scale that the reconnection across a QSL must operate within.
The similar nature of the observations of large, low intensity regions of outflow (Doschek et al. 2008; Harra et al. 2008) and the outflow shown in narrow bands of low intensity found in this study encourages the investigation of the correlation and relation between these regions and coronal hole topology and the solar wind. Antiochos et al. (2007) contend that there may be a narrow, finite region of open field that connects seemingly disconnected coronal holes. The narrow corridor follows the spine that separates the closed flux of an embedded AR bipole and the closed global flux. Further investigation is needed to understand this link, which could be important in determining if and how ARs can contribute to the slow solar wind.
In all of the topology based processes for reconnection, the flux or field lines must flow through a flipping layer, separatrice, or spine. Meanwhile, in the MHD expanding AR model, there is outflow at the emerging/expanding field and the interconnected field. All of the described models suggest activity at a boundary across which the field lines change connectivity between a core field and an exteriorly connected field. We have presented observational signatures at these boundary regions and suggest that these regions delineate coronal topology that is intricately related to the storage and release of magnetic energy.
5. SUMMARY
The analysis of low intensity regions ("dark bands") just outside AR cores has been shown for multiple cases. The most investigated occurrence (AR11112) indicates that the dark band may persist for days and is associated with large outflows and spectral line broadening. The considered ARs, for which spectral data was available, show an anti-correlation between intensity and line width along this dark boundary. A magnetic field model based on the HMI magnetogram for AR11112 reveals that this dark band is coincident with where some separatrices meet the photospheric boundary or run low in the corona, meeting the magnetic spines. The outflows from this region are ≈−20 km s−1. The outflows are detected in all of the ion lines considered, which points to outflows at temperatures of log(T[K]) = 5.0–6.4. For all of the examples examined, a dark band is visible that separates coronal loops of different topological domains, similar to a part in a person's hairs. The estimated size scale of the dark bands is ≈1.5–3.5 Mm.
This work shows that there is a distinct region of low intensity (dark band) and outflow between two regions of different magnetic connectivity. This dark band separates an arcade-like AR core from another topological domain in which the field is apparently closed as well. The outflows are located just outside Hα ribbons. This low intensity (dark band) and outflow region outside Hα ribbons shown here with EIS data, is very similar to two previous observations (Czaykowska et al. 1999; Del Zanna et al. 2006) made with the Coronal Diagnostic Spectrometer. These show outflow at the footpoints of arcade loops. This points to a readily observable phenomena, consistent with a topological structure.
The coincidence of the spines and the dark band seems to confirm the idea that the topology of the AR is intricately related to the physical structure and dynamics of an AR. It cannot be determined from these observations if the observed outflows are a signature of evaporation. While the observations are similar to post flare studies that attribute the outflows outside of Hα ribbons to evaporation (Czaykowska et al. 1999; Del Zanna et al. 2006), this study points out the similarity in the observations and topology. A region of decreased intensity coincident with outflows at the footpoints of bright arcade loops is apparent in the above mentioned post flare observations and in this investigation. A dark band region is found that seemingly separates regions topologically. An estimated size scale of 1.5–3.5 Mm begs the questions: Is there a minimum distance that the different closed domains will try to maintain between them? Is this dark band the minimum distance that can be maintained as one domain emerges and "pushes" on the existing field/topology? Is there some energizing mechanism pushing from below or at work higher in the corona?
The outflows observed along sharp boundaries outside of ARs have been widely observed in recent years (Sakao et al. 2007; Doschek et al. 2007; Del Zanna 2008; Harra et al. 2008, 2010; Hara et al. 2008; Doschek et al. 2008; Guo et al. 2010; Brooks & Warren 2011; Warren et al. 2011; Scott et al. 2012). This is strong evidence that these outflows in low intensity regions outside AR cores can be considered a part of the general AR structure. Previous studies have dealt with the location of the magnetically closed AR core transitions into a large open field region. This study concentrates on a dark band that forms over a unipolar region between the magnetically closed (emerging) AR core and another magnetically closed domain (pre-existing).
The analysis of the velocity in the dark band regions may be affected by instrumental artifacts. As pointed out in Scott & Martens (2011) and Young et al. (2012), there may be a non-uniform point spread function (PSF) that can introduce erroneous red-shifted and blueshifted wavelengths to pixels depending on the intensity gradients next to the pixels. However, the dark band is present in both the AIA images and most of the EIS intensity images. The AIA movies occasionally display apparently outward moving material from the dark band region. Most importantly, the dark band region shows a similar structure when it is aligned vertically (along the y direction, so there are no large intensity gradients in the y direction). The non-uniformity of the PSF has minimal effect in this orientation. The portions of the dark band that have the intensity gradient in the x direction show the same pattern of outflow and increased line widths in the dark regions.
The focus of this paper is point out the existence of narrow, dark bands that are found at the edges of AR cores, separating loops of different connectivity. The dark bands have a signature of blueshifted Doppler velocity, line broadening, and blue wing R-B asymmetry, indicating multiple components of outflowing material. The dark band coincides with magnetic spines from the analysis of the magnetic field topology. This supports the notion that the dark bands separate loops of different magnetic domains. Although separatrices are locations where the reconnection is preferable, the site of flux transfer need not be the site of the plasma response. The dark region may be interpreted as the region where flux must cross in order to transfer, while the surrounding bright loops are visible as a response. However, these ideas are mentioned as possibilities and there may be other interpretations of the observations.
The common observation of outflow and line broadening in low intensity areas over unipolar regions is found: in large regions outside AR core, on edges of emerging magnetic flux, and directly adjacent to singular coronal loop footpoints. This points to a mechanism that operates at a range of scales. If the origins or manifestations of the outflows are indeed located in low intensity regions adjacent to or between bright loops, then we show examples of this mechanism at work in narrow bands of low intensity between regions of different topology. We take advantage of the arrangement of arcade-like structures to estimate a minimum separation (in intensity) between the bright arcade-like core loops and the significantly brightened periphery loops. The presence of these dark bands located near magnetic separatrices or spines before and after flares suggests that the dark bands are visible features of the separatrices that may have a role in understanding the flaring process (Longcope et al. 2010; Chen et al. 2011). Further investigation must be done to understand the mechanism/s responsible for the formation of the outflows in these low intensity regions and their connection to other AR and solar processes.
We would like to thank the referee for comments that added to the clarity of the paper.