
Abstract
The corrosion resistance of the welds made of QE22, ZRE1, and WE43 rare-earth-metals-containing magnesium alloys was investigated in 0.5% NaCl solution saturated with Mg(OH)2 using the electrochemical methods: linear sweep voltammetry, small amplitude cyclic voltammetry, and electrochemical impedance spectroscopy. These tests elucidated how welding influences the susceptibility to corrosion of that class of magnesium alloys. For the sake of comparison AZ91 magnesium alloy was investigated too. All welds were obtained by tungsten inert-gas welding method. In the case of all investigated alloys welds showed corrosion resistance comparable to the base material. However, all rare-earth-metals-containing magnesium alloys show corrosion resistance inferior to AZ91 alloy. Significant differences in corrosion resistance evaluated by different electrochemical methods were observed.
Export citation and abstract BibTeX RIS

This is an open access article distributed under the terms of the Creative Commons Attribution 4.0 License (CC BY, http://creativecommons.org/licenses/by/4.0/), which permits unrestricted reuse of the work in any medium, provided the original work is properly cited.
Aluminum, zinc, and manganese are the most frequently used alloy additions in the case of magnesium alloys. These alloys show good workability and mechanical properties at room temperature and high (in comparison to pure magnesium) corrosion resistance at a relatively low price.1–4 However, the susceptibility to creeping restricts their application. This problem can be resolved by the addition of rare earth (RE) elements. This enables the application of the magnesium alloys in automotive and aerospace transport industries, where higher working temperatures are necessary.5–8
Magnesium alloys are most frequently used for large-size castings, cast to sand molds, pressure-, and die-castings. Defects (misruns, shrinkage porosity, and fractures) frequently appear in the magnesium alloys castings, especially in large ones.8–10 Those defects are being repaired using welding and pad welding. Welding may be also used for the joining of magnesium alloy parts and for the regeneration thereof in the case of exploitation wear.
The structure of magnesium alloys after casting and thermal treatment, their physicochemical and mechanical characteristics, as well as the influence of the casting technology on the structure and properties of castings and their weldability, are described in the literature.5,8,11 The influence of metallurgical, technological and constructional factors on their tendency to high-temperature cracking is described too.12
Corrosion susceptibility is one of the most important features of structural materials. Magnesium alloys are used in transportation where they are often exposed to corrosive environments.3 Increased susceptibility to corrosion of the welded junctions could restrict their application field. The composition and metallurgical microstructure of the alloy may influence its corrosion resistance.10,13,14 The rapid solidification during welding, leading to the grain refinement and homogenization of the alloy composition may improve the corrosion resistance of the welds.15 However, the corrosion behavior of magnesium joints and the influence of welding parameters on corrosion resistance are not well understood and important research remains to be done.
Recently, friction stir welding (FSW) is the most frequently used welding method. However, it has several limitations. In the case of repairing and regeneration works more suitable method is the tungsten-inert-gas (TIG) method.
The influence of welding on the corrosion susceptibility of magnesium alloys has already been investigated but mainly in the case of the alloys containing aluminum as the main alloying component.
In the case of TIG welding, three different zones may be discerned in the region of the weld: the base material (BM), the heat-affected zone (HAZ), and the fused zone (FZ). In the case of the FSW method, one may distinguish BM, the thermo-mechanically affected zone (TMAZ), HAZ, and the stir zone (SZ).
Most of the published papers concern the welds made using the FSW method. Kannan et al.16 investigated the resistance of the FSW-welded AZ31 magnesium alloy to uniform corrosion, pitting corrosion, and stress corrosion cracking (SCC). The electrochemical and salt spray tests showed that SZ exhibits higher uniform and pitting corrosion resistance than BM, however, is more susceptible to SCC. Jang et al.17 investigated the corrosion resistance of as-received and FSW-welded AZ31B-H24 and AZ31B-T4 alloys in 3.5% NaCl solution. They observed that after welding the corrosion rate increases when the grain size increases during welding (AZ31B-H24) and decreases when the grain size decreases (AZ31B-T4). Zeng et al.18 investigated FSW-welded AM50 magnesium alloy and observed that the corrosion resistance of the weld depends on its microstructure. SZ always showed better corrosion resistance than the other weld zones (TMAZ and HAZ) and BM. The authors stated that the corrosion morphology of the alloy was predominantly controlled by the β-phase distribution. Aperador et al.19 found that rotation speed (rs) and advance speed (as) during FSW welding significantly affect the corrosion resistance of AZ31 alloy. The higher the rs/as ratio the better the corrosion resistance is. However, in all cases weldments showed higher corrosion resistance than BM. The corrosion resistance of FSW-welded AZ31B plate was investigated too.20 The highest corrosion resistance showed SZ, the lowest HAZ. It was in line with the differences in the grain size of particular zones of the weld, which were 11, 26 and 22 μm for SZ, HAZ and BM, respectively. Vuong et al.21 investigated the influence of FSW welding on the corrosion resistance of the Mg-5Al alloy. They found that increasing advanced speed increases both the breakdown potential as well as the corrosion resistance of the alloy. Authors ascribed the increased corrosion resistance to the refinement of precipitates, grain refinement and greater homogeneity of the microstructure. Improved corrosion resistance after FSW of two aluminum-containing alloys, namely AM50 and AZ31 (to lower extend), was reported by Templeman et al. 22 Liu and co-workers investigating the ZK60 alloy stated that FSW welding increases significantly the corrosion resistance of that material due to the significant grain refinement and redistribution of precipitates.23
Another technique that was used in the welding of magnesium alloys is laser welding. Lubbert et al.24 used that technique to weld several magnesium alloys containing, besides Mg and Al, either Si or Mn but the results depended on the material combination. Authors pay attention to increased pit generation in HAZ. Kannan et al.16 investigated the corrosion behavior of the samples prepared from AZ31 Mg alloy by laser welding. Corrosion current measured by linear polarization method was slightly higher for BM in comparison to FZ.
The autogenous (TIG) method in welding the AZ31 alloy was also used.25 Contrary to other researchers, they observed that the grains formed in FZ had diameters much higher than the grains of BM. Accordingly, it was found that the corrosion resistance of FZ was lower in comparison to HAZ, which was, again, lower in comparison to BM. Segarra et al.26 investigated corrosion resistance of the welds obtained by the TIG method between AZ31 plates, with the use of either AZ31 or AZ92 as a filler metal. In the case of both filler materials used the mass loss due to corrosion was much lower in the case of the weldment than in the case of BM; the weldment obtained with the use of AZ92 showed higher mass loss than the weldment obtained with AZ31. The corrosion of the TIG-welded AZ31B-H24 alloy was investigated.27 They found that the base material exhibited greater corrosion rate than the isolated weld zones. Later they investigated the same TIG-welded alloy but concentrated on the problem of galvanic coupling between different zones of the welded samples.28 According to them the presence of Mg(OH)2 film plays a crucial role in the creation of the galvanic couples across the surface. Liu and Xu29 investigated the corrosion resistance of laser-TIG hybrid welded similar Mg alloy AZ31–AZ31 and dissimilar Mg alloys AZ31–AZ91, by 3.5 wt% NaCl solution accelerated corrosion experiment and linear polarization. Generally, the joints showed better corrosion resistance than BM, which the authors ascribe to grain refinement.
Most of the cited authors observed enhanced corrosion resistance of SZ or FZ and ascribed it to the refinement of the structure, mainly to a decrease in the diameter of the grain size. Ralston et al.30 analyzed existing literature data on the dependence of corrosion rate on the grain size. In the case of samples showing rather low corrosion rate, the corrosion current increases with the increase in the grain diameter, whereas in the case of the samples showing a rather high corrosion rate, the corrosion current increases with decreasing of the grain size, due to enhanced activity of the grain boundaries in the anodic dissolution. Magnesium and its alloys show rather high corrosion rate, as compared to other metals, so in the case of magnesium and its alloys, one may expect rather high enhancement of the corrosion rate with the decrease of the grain diameter.
Some authors proposed other than grain refinement explanations for the observed differences in the corrosion resistance between BM and SZ or FZ. Zhang et al.31 investigated the behavior of differently treated base material and weld samples of FSW welded AZ31B-H24 alloy. According to those authors, the main cause of the observed differences in corrosion resistance between samples is the contamination of the surface by the heavy metals. The point of view reported in Ref. 31 finds support in the observations of Lamaka et al.,32 who stated that the re-deposition of iron, present in the electrolyte due to the dissolution of iron-containing magnesium, increases significantly the corrosion rate of magnesium. The removal of the contaminations eliminated the differences. Kish et al.33 working with the same FSW welded alloy as used in Ref. 17, stated that not the grain size but rather the size and distribution of the noble intermetallic Al-Mn particles are the reason for the observed difference in corrosion resistance exhibited by AZ31B in different heat-treated conditions (SZ versus BM). The corrosion resistance of FSW welded AM60B alloy was investigated in Ref. 34 and it was found that SZ showed higher susceptibility to localized corrosion than BM. The authors ascribed the differences in the susceptibility to corrosion to the differences in the β-phase morphology between BM an SZ.
The influence of the addition of RE metals (Ce, La, Nd, Y, and Gd) to magnesium has been investigated in detail.35 It significantly increases the corrosion rate, in some cases by almost two orders of magnitude. However, no convincing mechanism was provided. They investigated also the influence of heat treatment on the corrosion resistance of Mg-RE alloys by comparing as-cast and solution heat-treated samples. Despite the observed grain refinement and homogenization, some alloys (Mg-Ce, Mg-Y, and Mg-Nd) showed an increase in the corrosion rate, whereas some others (Mg-Gd and Mg-La) showed a decrease in corrosion rate after heat treatment. Recently, Rosalbino et al.36 reported significant improvement in corrosion resistance of Mg alloyed with Gd, Dy, and Er (up to 1 wt%). They ascribed it to the enhanced barrier properties of the corrosion products layer and additional active corrosion protection originating from the inhibiting action of the RE metal cations entrapped as oxides/hydroxides in this surface layer. The enhanced corrosion resistance of a friction stir processed Mg-4Y-3Nd magnesium alloy due to grain refinement and uniform second phase distribution was reported.37,38 The influence of RE addition on the corrosion resistance of magnesium alloys was recently studied by Hu et al.,39 however, these authors concentrated on the aluminum-REs-containing alloys.
No information concerning corrosion behavior of the TIG weldments in the case of the Mg alloys containing RE metals has been found in the literature. Therefore, a comparison of the corrosion resistance of magnesium alloys containing RE metals as cast and in the form of TIG-welded junctions is necessary to understand if the welding process influences the corrosion susceptibility thereof.
In this study, well weldable QE22, ZRE1, and WE43 were examined. One of the most intensively investigated magnesium alloys is, undoubtedly, AZ91, containing aluminum and zinc as the alloy additions. For that reason, this alloy was investigated as the reference material in the present study. Alloys containing both aluminum and REs are a special case because aluminum easily forms intermetallic compounds with REs. Thus, such alloys were beyond the scope of the present study.
In this work, the linear sweep voltammetry (LSV), small amplitude cyclic voltammetry (SACV), and electrochemical impedance spectroscopy (EIS) methods were used to evaluate the corrosion resistance of investigated alloys in sodium chloride solutions (typical corrosive environment).
Experimental
Materials and their characterization
Magnesium alloys used in this study were obtained by gravity sand casting method as metal sheets with dimensions of 200 mm × 350 mm × 20 mm. The castings were milled and 10 mm-thick plates were used for welding.
Joints of magnesium alloys were made using a nonconsumable WT20 tungsten electrode of the diameter 3.2 mm (according to EN ISO 6848:2008) in the inert gas envelope (technical grade argon of the purity 99.995% at the flow rate of 12 dm3 min–1), with the application of a Lincoln V 205AC/DC inverter welder and the alternating current. The upslope time was set to 2 s and the flash-off time was set to 4 s. The free flow-out time of argon was established to 3 s before beginning of the welding and to 4 s at the end of the process. Plates prepared for welding were chamfered for "Y" at the angle of 30°, leaving welding edge of 2 mm. Table I shows the chemical composition of the alloys used in the investigations.
Table I. The chemical composition of the alloys used in the experiments.
| Chemical composition/wt% | |||||||||||||||
|---|---|---|---|---|---|---|---|---|---|---|---|---|---|---|---|
| Alloy | zinc | aluminum | silicon | copper | manganese | iron | nickel | silver | lithium | zirconium | yttrium | neodymium | RE | Other | |
| AZ91E | plates | 0.56 | 8.60 | 0.04 | — | 0.21 | 0.003 | 0.001 | — | — | — | — | — | — | 0.01 |
| filler | 0.69 | 8.60 | 0.06 | 0.006 | 0.18 | 0.002 | <0.001 | — | — | — | — | — | <0.30 | ||
| QE22 | plates | 0.01 | — | <0.01 | <0.01 | <0.03 | <0.002 | <0.005 | 2.40 | — | 0.46 | — | — | 2.57 | — |
| filler | 0.01 | — | 0.01 | <0.01 | 0.02 | 0.005 | <0.001 | 2.40 | — | 0.52 | — | — | 2.30 | — | |
| ZRE1 | plates | 2.80 | 0.01 | <0.01 | <0.01 | <0.03 | 0.003 | <0.001 | — | — | 0.51 | — | — | 2.87 | <0.05 |
| filler | 2.50 | — | <0.01 | <0.01 | 0.01 | 0.002 | <0.001 | — | — | 0.52 | — | — | 3.17 | <0.20 | |
| WE43 | plates | 0.01 | — | 0.01 | 0.004 | <0.01 | 0.002 | 0.004 | — | 0.01 | 0.51 | 3.70 | 2.20 | 0.96 | <0.01 |
| filler | 0.03 | — | <0.01 | <0.01 | 0.012 | 0.002 | 0.001 | <0.01 | <0.01 | 0.44 | 3.70 | 2.20 | 0.84 | <0.01 | |
Before welding, the plates were heated to the temperature of 100 °C. Welds had the form of string beads, the mode of the arrangement of the beads with the application of sealing run is presented in Fig. 1. The following parameters of the welding were applied: welding current 120 A, arch voltage 14 V, linear energy of the arch 3 kJ cm–1. Filler wires of the diameter 2.4 mm, of the composition similar to the investigated materials (Table I), produced by Magnesium Elektron were used for welding. According to the recommendations of the producer (Magnesium Elektron), after welding the joints were subjected to heat treatment. Table II presents the parameters of the heat treatment.
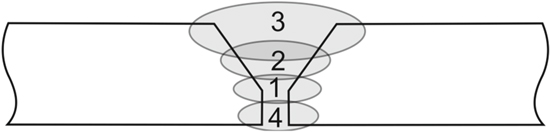
Figure 1. Order of bead placing during the preparation of the test plates.
Download figure:
Standard image High-resolution imageTable II. Parameters of the heat treatment.
| Alloy | Heat treatment |
|---|---|
| AZ91E | Hyperquenching: 415 °C/24 h/air, heating 50 °C/h, ageing: 200 °C/10 h/air |
| QE22 | Hyperquenching: 525 °C/8 h/water 60 °C, ageing: 200 °C/ h/air |
| ZRE1 | Annealing: 200 °C/16 h/air |
| WE43 | Hyperquenching: 525 °C/8 h/air, ageing: 250 °C/16 h/air |
Electrochemical measurements
Measurements were conducted in the 0.5% NaCl (pure p.a., POCH S.A. Poland) solutions, additionally saturated with Mg(OH)2, in a glass cell in a three-electrode setup at the free access of air. pH of the as-prepared solution was 9.8 ± 0.1. A platinum foil was used as a counter electrode and an Ag∣AgCl∣ saturated KCl solution electrode was used as a reference electrode. All potentials are given with respect to that electrode. Electrochemical measurements were performed using a Gamry 300 series potentiostat/galvanostat/ZRA. Samples of the cuboid shape were cut for each alloy (Fig. 2a). The HAZ samples were prepared separately in a manner depicted in Fig. 2b.

Figure 2. Schematic illustrations of places where the samples for the electrochemical measurements were cut from.
Download figure:
Standard image High-resolution imageSamples were embedded in epoxy resin in such a way that only one face of the sample cuboid was exposed to the solution. The electrical connection was made at the opposite side of the sample. Before measurements samples were wet (99.8% ethanol, POCH S.A) polished on SiC emery papers (Struers) of the gradation: 500, 1000, 2000, and finally 4000, next rinsed with ethanol and distilled water.
EIS spectra were registered in the frequency range from 3000 to 0.015 Hz, with the amplitude of the sinusoidal voltage signal 5 mV rms and with the sampling density of eight frequency points per decade in logarithmic steps. In selected cases EIS spectra were measured down to the frequency of 0.001 Hz. For the analysis of the impedance data the program Minuit40 based on a complex least-square non-linear regression procedure was used. A more detailed description of the EIS data treatment procedure may be found elsewhere.41
LSV scans were performed with the potential sweep rate of 1 mV s–1, starting from the potential of –0.3 V vs the open circuit potential (OCP). The scan was finished when the anodic current density attained approximately 2 mA cm–2. SACV measurements were performed at the potential sweep rate of 1 mV s–1 and the amplitude of ±10 mV, with the first cycle initiated in the cathodic direction. Three SACV cycles were registered during each measurement.
The measurements were performed according to two different time schedules. In the first schedule the investigated electrode was immersed in the solution and OCP was registered for two hours, then the potentiostat was set on to the lastly measured OCP and acquisition of the impedance spectrum was initiated. Two spectra at the same potential were consecutively registered to reveal the stationarity of the system, and then the LSV scan was performed.
In the second mode, the investigated electrode was immersed in the solution and OCP was registered for 8 min, then the potentiostat was set on to the lastly measured OCP and SACV measurement was started, then the potentiostat was set again to the OCP measurement. Such a procedure was repeated twelve times for 2 h. After the last SACV measurement, LSV was initiated. At least two repetitions of electrochemical measurements were carried out for each alloy (for BM, HAZ as well as for FZ material).
From the SACV voltammetry data, RP was calculated as a slope of the E = f(I) curve. Similarly, RP at the potential of current sign reversal (corrosion potential, Ecorr) was calculated from the LSV data taking into account the points between –10 and +10 mV vs Ecorr. In both cases, RS (measured by EIS) was subtracted from the slope value to account for the Ohmic drop on the solution resistance. From the LSV data also the corrosion current density was calculated by extrapolation of the linear segment on the cathodic side of the Tafel plot to the zero-current potential. In that case the potential data were Ohmic-drop corrected before calculation of icorr.
Results
Microstructure characterization
Visual inspection of the joints performed according to the EN ISO 17637:2017-02 showed that both faces of the weld did not contain any defects (Fig. 3a). No welding discrepancies according to EN ISO 10042:2018-09 were observed. No discontinuities on the surface of the joint were noticed in the liquid-penetrant inspection investigations performed according to the EN ISO 23277:2015-05. X-ray pattern analysis performed according to the EN ISO 17636-1:2013-06 standard also has not revealed any discrepancies (Fig. 3b). The observed macrostructure of the junction is characteristic of TIG welding. However, HAZ is not well discernible due to negligible structural changes. The shape factor of the welding (width-to-depth ratio) was approximately 0.8, meeting the requirements of EN ISO 10042:2008-09 for B-level quality welds (Fig. 3c).
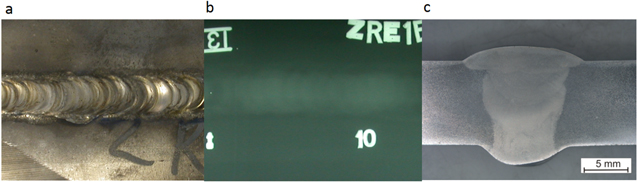
Figure 3. The results of the evaluation of the magnesium alloy welding joints for ZRE1 alloy as an example: (a) face of the weld, (b) X-ray pattern, (c) macrostructure.
Download figure:
Standard image High-resolution imageSignificant refinement of the alloy structure of the weldments (Figs. 4b, 4d, 4f, 4h) in comparison to the base material (Figs. 4a, 4c, 4e, 4g) is clearly visible. No grain refinement but increased concentration of precipitations was observed in HAZ (Figs. 4b', 4d', 4f', 4h'). The chemical composition of the precipitations is the same in the whole volume of the joint. After the heat treatment (see Table II) the welded joint of the AZ91 alloy is composed of the grains of the solid solution (α phase) as well as plate-like precipitations of the Mg17Al12 phase (Figs. 4a, 4b, b'), the welded joint of the QE22 alloy is composed of the solid solution (α phase) as well as precipitations of (Mg,Ag)12Nd phase (Figs. 4c, 4d, d'), the welded joint of the ZRE1 alloy is composed of the solid solution (α phase) as well as precipitations of (Mg,Zn)12RE phase (Fig. 4e, 4f, f') whereas the WE43 alloy welded joint shows the grains of the solid solution (α phase) as well as precipitations of the β' phase (Mg12Nd) and β1 phase (Mg3Nd) (Figs. 4g, 4h, h').42
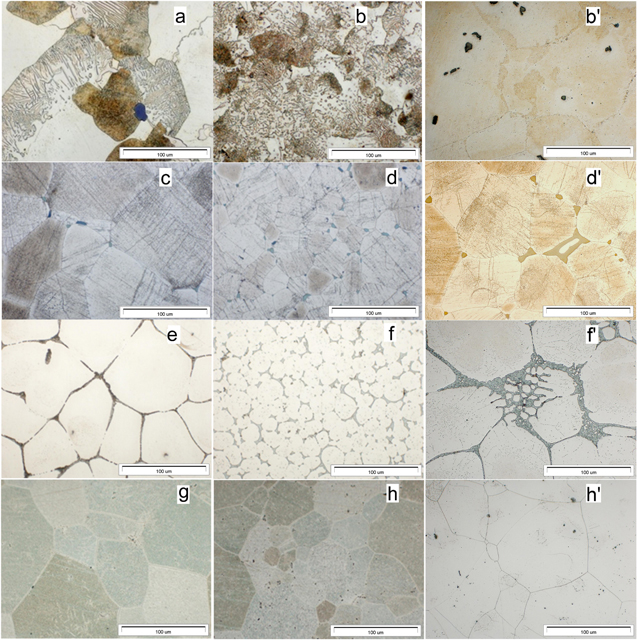
Figure 4. The microstructure of welded joints applied in the investigation of the corrosion resistance: (a), (b), (b)'—AZ91, (c), (d), (d)'—QE22, (e), (f), f'—ZRE, (g), (h), (h)'—WE43. (a), (c), (e), (g)—base material, (b), (d), (f), (h)—fused zone material, (b)', (d)', (f)', (h)'—heat-affected zone material.
Download figure:
Standard image High-resolution imageElectrochemical measurements
The measured data are summarized in Table III. For all data calculated from LSV and OCP measurements the mean value (from at least five measurements) and its standard deviation (SD) are given. Only one or two SACV measurements were performed for each sample, so the data are given for one of them. Similarly in the case of EIS, the results for only one measurement, the most representative, were given, because in most cases the noises in the low frequency region were so high that no reliable fit was possible. Comparing the data in Table III with the data presented in Figs. 5–10 one should remember, that figures are traced for particular experiments, whereas most of the data in Table III are mean values.
Table III. Corrosion data for the investigated alloys measured after two hours of immersion in the 0.5% NaCl solution saturated with Mg(OH)2. Mean value and standard deviations are given for all parameters, except last two, where values measured in a single experiment are given. All potentials are given versus the Ag∣AgCl∣KClsat electrode.
| WE43 | ZRE1 | AZ91 | QE22 | |||||||||
|---|---|---|---|---|---|---|---|---|---|---|---|---|
| BM | HAZ | FZ | BM | HAZ | FZ | BM | HAZ | FZ | BM | HAZ | FZ | |
| OCP/V | −1.719 | −1.653 | −1.558 | −1.523 | −1.507 | −1.525 | −1.486 | −1.481 | −1.506 | −1.537 | −1.481 | −1.537 |
| SD/V | 0.015 | 0.014 | 0.029 | 0.008 | 0.008 | 0.007 | 0.007 | 0.011 | 0.004 | 0.005 | 0.011 | 0.007 |
| Ecorr/V | −1.659 | −1.589 | −1.469 | −1.369 | −1.364 | −1.317 | −1.415 | −1.402 | −1.418 | −1.315 | −1.328 | −1.289 |
| SD/V | 0.024 | 0.009 | 0.037 | 0.033 | 0.028 | 0.012 | 0.017 | 0.030 | 0.022 | 0.029 | 0.027 | 0.044 |
| Eb/V | −1.400 | −1.300 | −1.284 | −1.378 | −1.256 | −1.371 | −1.274 | −1.241 | −1.234 | |||
| SD/V | 0.009 | 0.038 | 0.017 | 0.026 | 0.145 | 0.004 | 0.024 | 0.074 | 0.027 | |||
| Icorr/μA cm−2 | 18.0 | 12.9 | 18.8 | 4.72 | 16.0 | 6.88 | 4.48 | 1.20 | 7.03 | 7.89 | 22.8 | 9.84 |
| SD/μA cm–2 | 3.90 | 2.10 | 4.40 | 2.89 | 10.7 | 0.550 | 0.87 | 0.60 | 5.00 | 2.45 | 7.14 | 1.72 |
| bc/V decade−1 | −0.263 | −0.274 | −0.225 | −0.179 | −0.203 | −0.207 | −0.213 | −0.127 | −0.217 | −0.222 | −0.213 | −0.224 |
| SD/V decade–1 | 0.018 | 0.022 | 0.009 | 0.012 | 0.011 | 0.009 | 0.029 | 0.053 | 0.017 | 0.015 | 0.009 | 0.005 |
| Rp,Ecorr, LSV/Ω cm2 | 3270 | 5158 | 2860 | 9640 | 4997 | 4330 | 25830 | 37323 | 16320 | 5415 | 2279 | 4370 |
| SD/Ω cm2 | 690 | 579 | 860 | 4790 | 2458 | 1570 | 7210 | 8892 | 1190 | 1590 | 995 | 1730 |
| Rp,OCP,SACV/Ω cm2 | 3867 | 5000 | 2851 | 839 | 332 | 392 | 16852 | 18158 | 15932 | 229 | 124 | 251 |
| RP, OCP,EIS/Ωcm2 | 2910 | 3002 | 3079 | 889 | 242 | 207 | 14827 | 22961 | 11025 | 295 | 161 | 175 |

Figure 5. The change of the open circuit potential (OCP) in time for particular experiments during first two hours after the immersion in the electrolyte (0.5% sodium chloride solution saturated with magnesium hydroxide), red color—base material, green color—heat-affected zone, and blue color—fused zone.
Download figure:
Standard image High-resolution image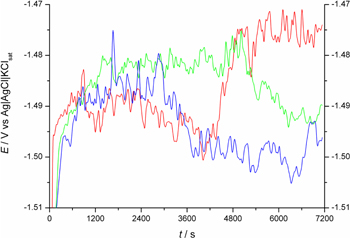
Figure 6. The change of the open circuit potential (OCP) in time during first two hours after the immersion in the electrolyte (0.5% NaCl) for a WE43 FZ material electrode (three independent experiments with the same electrode).
Download figure:
Standard image High-resolution image
Figure 7. LSV curves for the investigated alloys (BM) measured with the potential sweep rate of 1 mV s–1, starting from the potential of –0.3 V vs OCP in the anodic direction.
Download figure:
Standard image High-resolution image
Figure 8. Comparison of the LSV curves for BM, HAZ, and FZ materials measured with the potential sweep rate of 1 mV s–1 starting from the potential of –0.3 V vs OCP in the anodic direction.
Download figure:
Standard image High-resolution image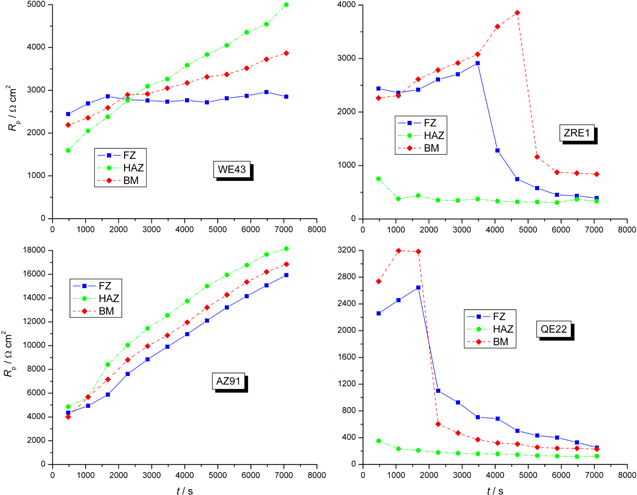
Figure 9. The course of Rp versus time, measured by SACV in one of the series for investigated alloys.
Download figure:
Standard image High-resolution image
Figure 10. Selected impedance spectra of the investigated alloys (all for fused zone material) measured in 0.5% NaCl solution saturated with Mg(OH)2, and the equivalent electrical circuit used to fit the impedance data. RS—solution resistance, CEDL—capacitance of the electrical double layer, RCT1, RCT2—charge transfer resistance of the anodic and cathodic processes, respectively, C1 and L1—pseudocapacitance and pseudoinductance of the anodic process, respectively, RC1 and RL1—pseudoresistances associated with pseudocapacitance and pseudoinductance. In fitting process capacitances and inductance were replaced by constant phase elements.
Download figure:
Standard image High-resolution image
OCP behavior
The repeatability of OCP was good for all alloys except WE43 (see below). Except few cases SD of OCP measured after 2 h was below 15 mV (see Table III). However, in the case of WE43 alloy (for both FZ, HAZ and BM) the course of OCP in time group in two branches, removed from each other by approximately 55 mV in the case of FZ and 30 mV in the case of BM and HAZ. Within each branch, the scatter of the results did not exceed 5 mV (see Fig. 5a). All results presented in Fig. 5a were obtained using the same electrode, polished shortly before the measurement, and at virtually the same conditions. The most probable explanation for that division is the macroscopic inhomogeneity of the alloy. In the case of the AZ91 alloy, the course of OCP versus time was qualitatively the same as in the case of WE43 alloy, but good reproducibility was achieved (Fig. 5b). A quite different course of OCP versus time was observed in the case of ZRE1 alloy (see Fig. 5c). OCP first increased then after sudden drop stabilized. The time at which that sudden drop occurred was, however, different for each experiment. For QE22 alloy, the course of OCP in time was qualitatively the same as in the case of ZRE1 alloy (Fig. 5d).
In the case of all investigated alloys fluctuations of OCP were observed, however incomparably lower than those registered in the case of the NaCl solutions without Mg(OH)2 (compare Figs. 5 and 6). The fluctuations of OCP in NaCl solutions (Fig. 6) are attributed to unstable pH near the electrode surface, the occurrence of local corrosion events, formation/liberation of small hydrogen bubbles, and formation of corrosion products.43,44 Note that the saturation of the solution with Mg(OH)2 stabilizes not only the Mg2+ concentration but also pH, both strongly influencing the course of magnesium alloy corrosion. Only in the case of WE43 alloy FZ, HAZ and BM materials showed a significant difference in OCP values (161 mV between BM and FZ and 45 mV between BM and HAZ), which suggests better corrosion resistance of the FZ material. In the case of other alloys, the difference was either negligible or even opposite.
The behavior of alloys in potentiodynamic experiments
Our preliminary experiments showed that prolonged cathodic polarization changes significantly the properties of the alloy and generates hydrogen bubbles on the surface of the electrode resulting in partially blocked metal surface. Therefore, LSV curves were traced with relatively high potential sweep rate (1 mV s–1) to shorten the time of the measurement. Ecorr covered a wide span of potentials, being the lowest for WE43 alloy and the highest for QE22 alloy (see Table III and Fig. 7).
In all cases, Ecorr was significantly more anodic than OCP (see Table III). FZ material always showed bigger difference between OCP and Ecorr than either BM or HAZ. In the case of QE22 and ZRE1 alloys that difference was much bigger (between 153 and 248 mV) than in the case of either WE43 or AZ91 alloys (between 60 and 89 mV). Only in the case of WE43 alloy Ecorr for FZ material was significantly more anodic (by 161 mV) in comparison to BM. In other cases, the difference was much lower or even negligible (AZ91). Note, that the change of Ecorr to more positive ("more noble") value is commonly assumed as a proof of better corrosion resistance.
The sudden increase of current density was observed on the anodic branch of polarization curves. This can be attributed to the breakdown of the passivating film on the surface.43,45–48 No breakdown was observed in the case of BM and FZ samples of WE43 alloy and HAZ of ZRE1 alloy (Fig. 8a). In the case of other alloys breakdown potential (Eb) was more anodic for FZ material than for BM (see Table III and Fig. 8), which suggests that FZ material shows better corrosion resistance than BM. However, Rp measured at Ecorr was always higher for BM in comparison to FZ material, which means opposite tendency, and in two cases (WE43 and AZ91) Rp measured at Ecorr for HAZ was higher than either for BM or FZ. However, it must be said that in almost all cases the differences are statistically insignificant due to the high scatter of the results (see Table III). Similarly, icorr measured at Ecorr by extrapolation of the linear segment on the cathodic part of the polarization curve traced in the semi-logarithmic coordinates to Ecorr was always lower in the case of BM in comparison to FZ material, however, the differences again were statistically insignificant. Note the self-consistence of the Rp and icorr data, which were calculated independently from each other.
No matter what was the difference in Ecorr between BM, HAZ and FZ materials of the same alloy, the current density in the anodic part of the LSV curve was always significantly higher for BM in comparison to either HAZ or FZ (see Fig. 8). It suggests the higher susceptibility to corrosion of BM in the conditions of anodic polarization. The most probable explanation of the decrease in anodic current in the case of FZ and HAZ materials in comparison to BM is the formation of thicker Mg(OH)2 layer (remember also the increase in Eb). At the same time the current density in the cathodic part of the LSV curve was lowest for BM (except AZ91, for which the currents were close to each other). Evidently, welding increases the catalytic activity of the alloys in hydrogen evolution reaction (HER). The last effect is negligible for AZ91 alloy (Fig. 8c), which suggests that the reason for the enhanced catalytic activity in HER may be ascribed to the higher density of grain boundaries in the case of FZ material. Note, that RE containing precipitates are located mainly at the grain boundaries.
Note also the very good reproducibility of the cathodic Tafel slope (CTafel). In almost all cases (except AZ91 alloy, BM and HAZ) SD did not exceed 10% of the calculated value of CTafel (Table III).
Changes of polarization resistance measured by SACV in time
In the case of all investigated alloys, the difference between OCP and Ecorr was significant, and in the case of two of them (ZRE1 and QE22) very large. Although measurements of either Rp or icorr at Ecorr are commonly used to evaluate the corrosion resistance of magnesium and its alloys, it must be said that in practice magnesium alloys do not corrode at Ecorr but at OCP, while OCP changes significantly in time. One may anticipate that when OCP changes, Rp changes too. Therefore, the course of Rp in time was studied using SACV. The results are presented in Fig. 9 and in Table III. The corrosion current density from the measured Rp was not extracted because, according to our opinion, no reliable data on anodic Tafel slope for all investigated alloys exist and even the cathodic Tafel slopes, measured at the potential significantly cathodic to OCP might not be applicable at OCP. Fortunately, for a particular alloy, a comparison of Rp values should be sufficient.
Figure 9 presents the course of Rp versus time for all investigated alloys in one of two series of such measurements. It is interesting to note that at the beginning of the experiment Rp of all alloys assumed values similar to each other, between 0.5 and 3.0 kΩ cm2 (value extrapolated to t = 0). It may be postulated, that this value reflexes the corrosion resistance of the Mg α-phase, which constitutes most of the surface of all the alloys under study. Later on, Rp increases, most strongly in the case of AZ91 alloy. It may be ascribed to the forming of the composite oxide/hydroxide layer on the surface of that alloy composed mainly of Al2O3·xH2O.41,49 After two hours of corrosion test Rp of AZ91 alloy attain the value similar to the value registered in the LSV experiments (see Table III). Note that in the case of AZ91 alloy OCP and Ecorr differ by less than 90 mV both in the case of BM, HAZ and FZ materials. WE43 alloy showed similar behavior like AZ91 alloy, but the final Rp after two hours was much lower than in the case of the latter (but still close to the value measured by LSV). Completely different behavior was observed in the case of both ZRE1 and QE22 alloys. After some time (different in particular experiments) sudden drop of Rp was observed. That drop correlated in time with the drop of OCP. After two hours, Rp attained the value of an order of magnitude lower than that measured by LSV at Ecorr. The direction of OCP change during the sudden drop of Rp (towards more cathodic potential) together with the decrease of Rp suggests the increase in the anodic reaction rate (dissolution of the alloy) and constancy of the cathodic reaction rate (HER). Note the different behavior of HAZ material in the case of ZRE1 and QE22 alloys as compared to BM and FZ materials.
Electrochemical impedance spectroscopy
The primary condition to apply EIS is the stationarity of the measured system. In view of the fast changes of Rp and OCP observed at least in the initial period of time in the case of all investigated alloys (see Figs. 5 and 9) the time of the spectrum acquisition should be as short as possible. On the other hand, Rp is the low-frequency limit of the electrode impedance. Therefore, to obtain this low-frequency limit, acquisition should be continued to sufficiently low frequency. That seems to be an unresolved problem because acquisition to the low frequency requires long time.
The measured EIS spectra had a rather complex shape with at least two capacitive time constants in the high-to-medium frequency range and an inductive loop in the low-frequency range (Fig. 10).
Such EIS response of Mg alloys is typically observed in corrosion tests under similar exposure conditions.50–54 The shape of the spectra in the low-frequency part suffered from significant scatter, which can be explained by a rather complex corrosion mechanism of Mg alloys in Cl−-containing media.52,53 Mg alloys corrode non-uniformly, thus actively corroding and passivated regions exist simultaneously on the surface.53 A porous layer of corrosion products covers weakly passivated regions. This layer is non-uniform and allows penetration of aggressive ions (in our case Cl–), causing further corrosion attack.52,55 It must be underlined here that there is no consensus on the exact corrosion mechanism of Mg alloys, nevertheless it is stated fairly precisely that inductive response in the low-frequency domain is due to the relaxation processes of adsorbed species.52,55
Reliable qualitative and quantitative interpretation of the obtained EIS spectra is complicated and several different equivalent electrical circuits (EECs) are reported in the literature.51–53 Less noisy spectra we were fitted using EEC presented in Fig. 10.
The equation describing that EEC has so many adjustable parameters, that the statistical validity of the parameters obtained from such a fit is questionable. However knowing all parameters of EEC one may calculate polarization resistance of the electrode process. For EEC presented in Fig. 10 RP may be calculated from the following equation:
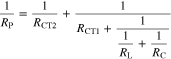
Variables appearing in Eq. 1 are explained in the caption to Fig. 10. Selected, representative values of RP are showed in Table III. In the case of all alloys under study, the results of EIS measurements agree (in the limits of measurement accuracy) with the results of SACV measurements, supporting eligibility of the interpretation approach used.
Discussion
The most striking observation emerging from the presented results are the great differences between Rp obtained by LSV method and those obtained by SACV and EIS methods in the case of ZRE1 and QE22 alloys. Considering either icorr (evaluated by the extrapolation of the Tafel line in the cathodic region of the polarization curve to Ecorr) or Rp (measured as the slope of the LSV curve at Ecorr) one may arrange investigated alloys, according to their increased resistivity to corrosion as follow: WE43 < QE22 < ZRE1 < AZ91. Considering Rp at OCP, obtained from SACV or EIS measurements one obtains the following order: QE22 < ZRE1 < WE43 < AZ91. Note that both for QE22 and for ZRE1 alloys RP estimated from LSV is more than 10 times higher than Rp estimated from SACV. Evidently, at OCP both alloys are in the active state and undergo passivation when polarized anodically to Ecorr. In the case of AZ91 and WE43 alloys, RP measured at OCP and at Ecorr are close to each other.
AZ91 alloy confirmed its good reputation in respect to the corrosion resistance. That alloy shows highest RP, no matter how measured, and lowest icorr of all investigated alloys. However, AZ91 alloy showed rather low breakdown potential and very high current flows (highest of all investigated alloys) under anodic polarization (see Fig. 7). WE43 alloy is unusual in this respect, as it shows much lower OCP than other investigated alloys. As a consequence, rather high anodic current flows when WE43 alloy is polarized anodically to the potentials equal to OCP of other alloys. No breakdown was observed in the case of that alloy (see Fig. 8a).
A thorough analysis of several factors, such as microstructure, second phase composition and distribution is essential for sound interpretation of the obtained electrochemical data. The common belief in the literature is that welding causes the refinement of the grains of the alloy with a decrease in the grain size and homogenization of the alloy composition.11,34,56 The refinement of the grain size in the case of all investigated alloys (see Fig. 4) was observed, however, the interpretation of the results of the electrochemical measurements (Figs. 5–10) is not so straightforward. Some data (higher Ecorr or Eb) give evidence that FZ shows superior corrosion resistance in comparison to BM. Nevertheless, in almost all cases BM showed higher Rp (both at OCP as well as at Ecorr) and lower icorr in comparison to FZ. Similar observations have been reported by other researchers.57–60 Grain refinement influences the formation of the oxide/hydroxide passivating layer at the surface, which, in turn, influences the corrosion rate. Note, that in our case three of the investigated alloys showed the occurrence of surface film breakdown (Fig. 8). Thus, the grain size is not the decisive factor in the corrosion resistance of the studied materials.
A review of the literature suggests that the composition of second phases and distribution thereof have a significant impact on the corrosion resistance of heterophase surfaces.39,61–66 However, this aspect has been almost ignored when considering corrosion of Mg TIG welds. It is well known that large micrometer-sized particles are driving force of local corrosion initiation.62,67 Since Mg has very low standard electrode potential its alloying with RE metals (or, generally, almost every impurity) results in formation of noble second phase particles acting as local cathodes. As a result, galvanic coupling occurs at the alloy matrix/second phase interface, leading to enhanced corrosion rate and local corrosion initiation.65 Our results (Fig. 4) show that the size and amount of RE-rich second-phase particles ((Mg,Ag)12Nd, Mg12Nd, etc.) formed in the BM and FZ zones vary significantly. Consequently, their corrosion behavior is affected too. From the microstructure examination, it seems that FZ and HAZ zones have more second phase precipitates, thus should corrode faster. The nature of RE-rich second-phase particles makes them the most active cathodic zones in the microstructure, increasing the cathode-to-anode ratio and dissolution of the α-phase. The proposed mechanism is consistent with the recent data published on corrosion of Mg-RE alloys.39,66 Summarizing, the observed inconsistencies in the electrochemical behavior of BM, HAZ and FZ of the TIG-welded RE-Mg alloys are the result of the reciprocal action of microstructure and nature of the second phase precipitates.
Conclusions
The goal of this work was to investigate, how the process of TIG welding influences the corrosion susceptibility of the RE-containing magnesium alloys. Positive conclusion from our work is that welding does not deteriorate the corrosion resistance of those alloys. All investigated alloys containing REs showed inferior corrosion resistance in comparison to the most frequently used magnesium alloy, AZ91, containing Al and Zn as the alloying additions. The large difference between the value of corrosion potential Ecorr extracted from LSV and OCP was observed for ZRE1 and QE22 Mg alloys. Comparison of RP extracted from LSV or from EIS/SACV measurements for those alloys showed significantly lower values in the latter case. This indicates that the application of LSV to the estimation of the corrosion rate of RE-containing magnesium alloys may lead to the overestimation of their corrosion resistance. Our electrochemical data show that corrosion resistance of FZ is lower than that of either HAZ or BM, however, in most cases the difference is in the range of the standard deviation. At the same time, BM shows much higher anodic current in comparison to FZ or HAZ upon polarization. The difference in the electrochemical behavior of BM, HAZ and FZ of the TIG-welded RE-Mg alloys could be the result of the reciprocal action of microstructural changes and the number of the second phase precipitates in these zones observed in our work.
Acknowledgments
AT and JA acknowledge the partial financial support of this study by the National Science Centre within the project No 2442/B/T02/2011/40. DK acknowledges the partial financial support of this study by the National Science Center (Poland), project no. 2019/03/X/ST4/00749. PN and MM acknowledge the partial financial support of the project by the statutory research fund of ICSC PAS for the year 2018.