
Abstract
Ammonia (NH3) is the primary alkaline gas in the atmosphere that contributes to formation of secondary particles. Emission of NH3 from vehicles, particularly gasoline powered light duty vehicles equipped with three-way catalysts, is regarded as an important source apart from emissions from animal wastes and soils, yet measured emission factors for motor vehicles are still not available in China, where traffic-related emission has become an increasingly important source of air pollutants in urban areas. Here we present our tunnel tests for NH3 from motor vehicles under 'real world conditions' in an urban roadway tunnel in Guangzhou, a central city in the Pearl River Delta (PRD) region in south China. By attributing all NH3 emissions in the tunnel to light-duty gasoline vehicles, we obtained a fuel-based emission rate of 2.92 ± 0.18 g L−1 and a mileage-based emission factor of 229.5 ± 14.1 mg km−1. These emission factors were much higher than those measured in the United States while measured NOx emission factors (7.17 ± 0.60 g L−1 or 0.56 ± 0.05 g km−1) were contrastingly near or lower than those previously estimated by MOBILE/PART5 or COPERT IV models. Based on the NH3 emission factors from this study, on-road vehicles accounted for 8.1% of NH3 emissions in the PRD region in 2006 instead of 2.5% as estimated in a previous study using emission factors taken from the Emission Inventory Improvement Program (EIIP) in the United States.
Export citation and abstract BibTeX RIS

Content from this work may be used under the terms of the Creative Commons Attribution 3.0 licence. Any further distribution of this work must maintain attribution to the author(s) and the title of the work, journal citation and DOI.
1. Introduction
Ammonia (NH3) is the third abundant nitrogen-containing gas in the atmosphere, after N2 and N2O (Seinfeld and Pandis 1998). As the primary alkaline gas in ambient air, NH3 can neutralize nitric and sulfuric acid to form ammonium nitrate and sulfate (Pinder et al 2007), which are important constituents of airborne fine particles or PM2.5 (Chow et al 1994). China, for example, has serious air quality problem due to PM2.5 pollution in the recent decade (Chan and Yao 2008, Zhang et al 2012a), and ammonium alone had contributed over 5% of the PM2.5 mass in its megacities (He et al 2001, Pathak et al 2009, Ianniello et al 2011, Meng et al 2011, Yang et al 2011, Wang et al 2012). Another important role played by NH3 is that it enhances the nucleation of sulfuric acid particles, and thus influences new particle formation events (Ortega et al 2008, Kirkby et al 2011). In addition, wet and dry deposition of NH3 and ammonium may cause eutrophication and even perturbation of ecosystems (Pearson and Stewart 1993, Seinfeld, Pandis 1998).
The major sources for atmospheric NH3 include animal wastes, biological processes in soils and ammonia-based chemical fertilizers, followed by biomass burning, and sewage treatment plants (Bouwman et al 1997, Asman 1998). The contribution of on-road mobile sources has been considered to be negligible (Pierson and Brachaczek 1983). However, recent highway tunnel (Moeckli et al 1996, Fraser and Cass 1998, Emmenegger et al 2004, Kean et al 2000, 2009) and classis dynamometer (Durbin et al 2002, Huai et al 2003) studies indicate that NH3 emissions from vehicles may be larger than previously estimated, which is mainly attributed to the chemistry over three-way catalysts (TWC) equipped on gasoline powered light duty vehicles (Bradow and Stump 1977, Cadle and Mulawa 1980). Therefore, road traffic is now recognized as an important source of NH3 in the urban environment (Sutton et al 2000, Battye et al 2003). Chitijian et al (2000) estimated mobile sources might be responsible for as much as 18% of total NH3 emissions in the South Coast Air Basin of California. US EPA concluded mobile sources contributed 8% of NH3 emissions nationwide in 2006 (US EPA 2007).
In China, however, NH3 emissions from vehicle exhaust were rarely measured and estimated. Huang et al (2012) estimated road traffic only contributed 1% of the total NH3 emissions in 2006 in China. A high-resolution NH3 inventory developed by Zheng et al (2012) for the Pearl River Delta region of China in 2006 indicated that on-road mobile source accounted for 2.5% of the total NH3 emissions. The above-mentioned two studies in China all adopted emission factors from the same research by Roe et al (2004): Zheng et al (2012) used the factor for three-way catalyst light-duty gasoline vehicles (63.2 mg km−1) while Huang et al (2012) used the average (26 mg km−1) of non-catalyst, oxidation catalyst, and three-way catalyst gasoline vehicles. Though both Huang et al (2012) and Zheng et al (2012) got negligible contributions from vehicle exhausts to the total ammonia emissions, Ianniello et al (2011) and Meng et al (2011) suggested that traffic was an important source of ammonia in urban areas of Beijing, China. Since NH3 in vehicle exhausts may strongly impact the early chemical evolution of exhausts in the ambient, the lack of measured NH3 emissions factor for vehicles in China would not only result in large uncertainty about the role of on-road motor vehicles in NH3 emission inventories, but also impede deep understanding of tropospheric chemistry in urban areas.
In the present study, we measured concentration changes of NH3 and NOx against CO2 and CO inside an urban roadway tunnel in the PRD region, the same region for which Zheng et al (2012) had estimated NH3 emissions from on-road mobile source based on emission factors by Roe et al (2004). With the assumption that NH3 emission from diesel trucks is negligible, fuel-based (mg L−1) or mileage-based (mg km−1) NH3 and NOx emission factors for light-duty gasoline vehicles under 'real world conditions' were thus calculated and used to estimate and re-evaluate the contribution of on-road vehicles to the total NH3 emissions in the region.
2. Methods
2.1. Sampling
NH3 emission from motor vehicles can be influenced by many factors, such as vehicle and fuel types, emission control technology and driving patterns (Moeckli et al 1996, Fraser and Cass 1998, Kean et al 2000, 2009, Baum et al 2001, Durbin et al 2002, Heeb et al 2006, 2008, Livingston et al 2009). NH3 emission factors for vehicles can be estimated in road tunnels (Moeckli et al 1996, Fraser and Cass 1998, Emmenegger et al 2004, Kean et al 2000, 2009) or obtained from classis dynamometer studies (Durbin et al 2002, Huai et al 2003). Road tunnels are excellent locations to measure vehicle emissions as the influence of meteorological conditions is minimized and the emissions undergo 'real world' dilution effects with minimal interference from other sources, enabling the vehicle emission factors to be determined. More importantly, road tunnel studies provide emissions from a large number of vehicles under 'real world conditions', that is, vehicles operating at hot and stable conditions when going through a road tunnel.
We conducted our tests in the Zhujiang Tunnel. It is an underwater tunnel crossing the Pearl River in the western urban area of Guangzhou, the central city in the Pearl River Delta. Figure 1 shows the layout of the tunnel. The tunnel is 1238 m long with a 721 m flat underwater section and two 517 m open slope sections outside both ends; it has two traffic bores of two lanes with traffic in the same direction each (He et al 2008). The vehicle speed limits in the tunnel are 15–50 km h−1, and the typical vehicle speed is 40–50 km h−1. It is worth noting that during rush hours (7–9 am and 5–8 pm) all trucks are banned; trucks of Guangzhou with vehicle payload weight higher than five tons and trucks from other cities with vehicle payload weight higher than 0.6 tons are banned from 7 am to 10 pm. During this study, the ventilation fans in the tunnel were turned off to prevent the influence of air turbulence.
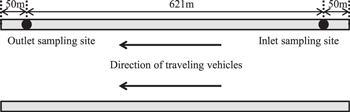
Figure 1. Schematic diagram of the western bore of the Zhujiang Tunnel.
Download figure:
Standard image High-resolution imageA video camera was placed at the exit to record the passing vehicles. Numbers of different types of vehicles were determined from the video tapes. Motor vehicles are classified into taxi, cars, mini-trucks (MTs), light-duty trucks (LDTs), medium-duty trucks (MDTs), heavy-duty trucks (HDTs), light-duty buses (LDBs), medium-duty buses (MDBs), heavy-duty buses (HDBs) and motorcycles. During the sampling period, the traffic densities varied between 105 and 2641 vehicles per hour, with an average of 1782 vehicles per hour.
2.2. Pollutant measurements
Sampling points were located 50 m from both ends of the tunnel inside the western bore with a cross-sectional area of 52.8 m2. Sampling time lasted from 3 am 10 August to 0 am 15 August 2013, with an average temperature of 33.4 ± 3.4 °C and relative humidity of 53.9%. Measured pollutants included NH3, NOx , CO and CO2.
NH3 and NOx were continuously measured by a chemiluminescence analyzer (EC9842, Ecotech, Austria). The EC9842 chemiluminescence NH3 analyzer combines a high performance ammonia converter (HTO-1000) and proven chemiluminescence detection to measure NH3, NOx and total nitrogen compounds (Nx ). Nx is the sum of NO, NO2 and NH3. To measure Nx concentration, NO2 and NH3 are converted to NO in a quartz converter by Pt catalyst at a temperature range of 580–820 °C. In a separate reaction, NOx is passed through a molybdenum converter heated to approximately 325 °C to convert NO2 to NO. NO is then detected by the analyzer. The resulting NH3 concentration is determined by subtracting the Nx result from the NOx . Measured NH3 concentration may be interfered by basic gases, such as organic amines or the like. McCulloch and Shendrikar (2000) compared experimental results of concurrent sampling using this method with a Model 17C analyzer (Thermo Environmental Instruments, Franklin, MA) and collocated citric acid denuders (URG, Chapel Hill, NC). Their results demonstrated that this method reliably measured ambient NH3 concentrations with a high degree of accuracy. This method was also successfully employed to measure NH3 in the southeastern US (Hansen et al 2003, Edgerton et al 2007). The instrument was calibrated using a certified cylinder of NO (Foshan Kodi Gas Chemical Industry, China). NH3 converter efficiency was determined to be 91.28% using a certified cylinder of NH3 (Beijing AP BAIF Gases Industry, China). The detection limit and accuracy of the NH3 instrument are 0.5 ppb and ±0.5%, respectively, and the time resolution is 1 min.
For accurately determining CO2 and CO concentrations during a time interval, two-hour integrated air samples were collected by pumping air into the cleaned aluminum foil bags at a constant rate of 100 ml min−1. Samples were collected every two hours from 6 am 10 August to 4 am 11 August and from 4 am 12 August to 0 am 13 August for two days. CO concentrations in these air samples were determined using a gas chromatography (Agilent 6980GC, USA) with a flame ionization detector and a packed column (5A Molecular Sieve 60/80 mesh, 3 m × 1/8 inch). Details of this instrument can be found elsewhere (Zhang et al 2012b). CO2 was analyzed with HP 4890D gas chromatography (Yi et al 2007). For CO and CO2 the detection limits were <30 ppb and the relative standard deviations were all less than 3% based on seven duplicates running with CO and CO2 standards of 1.0 ppm.
3. Results and discussion
3.1. Diurnal variations of NH3 and NOx concentrations
Concentrations of NH3 and NOx measured at the tunnel inlet and outlet are presented in table 1. Averaged concentrations of NH3 and NOx measured at the outlet were 13.8 and 8.0 times that at the inlet, respectively. The average concentration of NH3 at the tunnel outlet was 729 ppb, much higher when compared to ∼390 ppb reported by Moeckli et al (1996) at the outlet of Gubrist Tunnel for a one-day exposure period, or 34 μg m−3 (48.9 ppb NTP) measured by Fraser and Cass (1998) inside the Van Nuys Tunnel, or 369 ppb observed by Kean et al (2000) at the exit of Caldecott Tunnel from 4–6 pm.
Table 1. NH3 and NOx concentrations (ppb) measured at the tunnel inlet and outlet.
| Outlet | Inlet | |||
|---|---|---|---|---|
| NOx | NH3 | NOx | NH3 | |
| Minimum | 52 | 40 | 40 | 21 |
| Median | 1492 | 756 | 128 | 46 |
| Average | 1458 | 729 | 182 | 53 |
| Maximum | 4232 | 2776 | 2519 | 225 |
| Std. Dev | 851 | 497 | 311 | 31 |
As shown in figure 2, NH3 and NOx at the tunnel outlet all exhibited diurnal patterns quite similar to that of the total traffic density. Each day both NH3 and NOx concentrations had two peaks at the rush hours of 7–9 am and 5–8 pm, and they were higher during evening rush hours than during the morning ones, consistent with about 10% higher total traffic densities during evening rush hours. The maximum concentrations occurred during the evening rush hours with levels over 4000 ppb and 2500 ppb for NOx and NH3, respectively. The concentration valleys were reasonable during the nighttime of 0–6 am when traffic density was also the lowest.

Figure 2. (a) Concentration-time plots of NOx and NH3 at the tunnel outlet during the sampling period with a time resolution of 1 h. (b) Profile of the total traffic density and traffic densities of taxi, cars, light-duty buses (LDBs) and heavy-duty buses (HDBs) during the sampling period. (c) Profile of traffic densities of mini-trucks (MTs), light-duty trucks (LDTs), medium-duty trucks (MDTs), heavy-duty trucks (HDTs), medium-duty buses (MDBs) and motorcycles during the sampling period. (d) Light-duty vehicles (LDV) and heavy-duty vehicles (HDV) percentages of the total traffic density during the sampling period.
Download figure:
Standard image High-resolution imageFigures 2(b) and (c) show the traffic density profiles for taxi, MTs, LDTs, MDTs, HDTs, cars, LDBs, MDBs, HDBs and motorcycles inside the tunnel. Diurnal patterns of cars and LDBs exhibited two peaks in rush hours, the same as that of the total traffic density. Taxi showed a quite different pattern with a peak at midnight. Densities of MDTs and HDTs showed no significant differences between rush hours and other time periods. As MDTs and HDTs only contributed about 0.5% of the total traffic, the restrictions on trucks might have a negligible effect on the composition of vehicle fleet. Percentages of light-duty (LD) vehicles (cars, taxi, MTs, LDTs and LDBs) were relatively stable during 10 am–10 pm (figure 2(d)) and the sum of cars, LDBs and taxi contributed approximately 82.5% of the total traffic, which was quite near a share of 79.6% for small passenger vehicles in all civil vehicles in Guangzhou in 2012 (Guangdong Provincial Bureau of Statistics (GPBS) and Guangdong Survey Office of National Bureau of Statistics (GSONBS) 2013). This consistency means, if cars and LDBs were major contributors of NH3 as discussed below, our tunnel test results would be largely representative ones for Guangzhou.
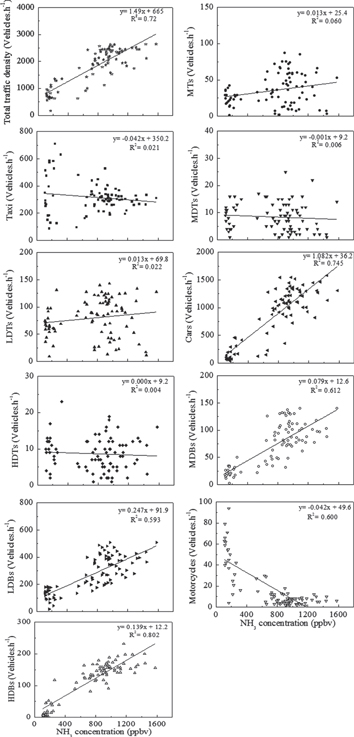
Figure 3 shows the scatter plots of NH3 concentrations against traffic densities of different types of vehicles. NH3 concentrations show a good positive correlation with the total traffic density. Poor correlations between NH3 concentrations and densities of diesel trucks were probably related to the negligible ammonia emission from diesel vehicles (Burgard et al 2006). Although taxi contributed about 14.3% of the total traffic in the tunnel from 10 am to 10 pm, its density was also poorly correlated with NH3 concentration. A probable reason is that NH3 concentrations varied with that of major NH3 contributors like cars, and that ammonia emission from taxi was negligible as over 90% of taxis in Guangzhou were LPG-powered instead of gasoline-powered. The negative correlation between motorcycle densities and NH3 concentrations might be resulted from the fact that motorcycle densities peaked during nighttime when densities of major NH3 contributors, like cars, had valleys instead. The good positive correlations (p < 0.001, R2 > 0.5) between NH3 concentrations and densities of cars and buses (LDBs, MDBs and HDBs) might imply that cars and buses were largely responsible for NH3 emissions in the tunnel.
Figure 3. Scatter plots of NH3 concentrations against traffic densities of Taxi, MTs, LDTs, MDTs, HDTs, Cars, LDBs, MDBs, HDBs and motorcycles.
Download figure:
Standard image High-resolution image
3.2. Emission factors
Light-duty vehicle emission factors were calculated by carbon balance, using the following equation the same as previous studies (Kirchstetter et al 1999, Kean et al 2000, Martins et al 2006):
where  is the emission factor of pollutant P in unit of mg kg−1 of fuel burned. Δ[P], Δ[CO2
] and Δ[CO] represent the increase in concentration of pollutant P, CO2 and CO between the tunnel inlet and outlet, respectively. MWp
and MWc
are molecular weight of pollutant P and carbon, respectively. wc
= 0.85 is the mass fraction of carbon of gasoline fuel and ρf
is the gasoline density (here ρf
= 740 g L−1). Since in the vehicle exhausts contribution of hydrocarbons to the total carbon concentrations is known to be negligible compared to that of CO2 (Kirchstetter et al 1998), hydrocarbons have been ignored in equation (1). As measured CO2 and CO concentrations were 2 h averages for two days, NOx
and NH3 concentrations recorded during the same time intervals at the tunnel inlet and outlet were also averaged to calculate Δ[P]. As shown in figure 2(d), percentages of light-duty (LD) vehicles (cars, taxi, MTs, LDTs and LDBs) and heavy-duty (HD) vehicles (MDTs, HDTs, MDBs and HDBs) were relatively stable from 10 am to 10 pm, so data from 10 am to 10 pm were used to calculate the emission factors of NOx
and NH3.
is the emission factor of pollutant P in unit of mg kg−1 of fuel burned. Δ[P], Δ[CO2
] and Δ[CO] represent the increase in concentration of pollutant P, CO2 and CO between the tunnel inlet and outlet, respectively. MWp
and MWc
are molecular weight of pollutant P and carbon, respectively. wc
= 0.85 is the mass fraction of carbon of gasoline fuel and ρf
is the gasoline density (here ρf
= 740 g L−1). Since in the vehicle exhausts contribution of hydrocarbons to the total carbon concentrations is known to be negligible compared to that of CO2 (Kirchstetter et al 1998), hydrocarbons have been ignored in equation (1). As measured CO2 and CO concentrations were 2 h averages for two days, NOx
and NH3 concentrations recorded during the same time intervals at the tunnel inlet and outlet were also averaged to calculate Δ[P]. As shown in figure 2(d), percentages of light-duty (LD) vehicles (cars, taxi, MTs, LDTs and LDBs) and heavy-duty (HD) vehicles (MDTs, HDTs, MDBs and HDBs) were relatively stable from 10 am to 10 pm, so data from 10 am to 10 pm were used to calculate the emission factors of NOx
and NH3.
Given that diesel trucks are found to contribute very little to ammonia (Burgard et al 2006) and that gasoline powered vehicles shared an average of 88.2% in the total traffic densities in the Zhujiang tunnel, gasoline powered vehicles would be the main source of ammonia in the tunnel. Diesel trucks did contribute to CO2 and might have different fuel efficiencies with gasoline powered vehicles. The fraction of fuel burned by light-duty gasoline vehicles is needed when calculating the ammonia emission factor. Using the fuel efficiencies of different kinds of vehicles reported by He et al (2005) and Huo et al (2012) and the fleet distribution in the tunnel, we obtain a rough estimate of 74.2% of fuel burned by light-duty gasoline vehicles. The emission factor of NH3 is thus determined to be 2.92 ± 0.18 g L−1 (mean ± 95% C.I.) when all ammonia emission is attributed to light-duty gasoline vehicles. Reported on-road or dynamometer-based NH3 emission factors for motor vehicles in other countries ranged 88.8–503.2 mg L−1 (Moeckli et al 1996, Fraser and Cass 1998, Kean et al 2000, Baum et al 2001, Durbin et al 2002, 2004, Huai et al 2003, Burgard et al 2006), less than 1/5 of that determined in this study. Recently, Carslaw and Rhys-Tyler (2013) reported an NH3 emission factor 0.48 g L−1 for Euro IV passenger cars in London, and Sun et al (2014) observed an average on-road NH3 emission factor 0.36 ± 0.04 g L−1 in California. These factors were quite near that reported by Fraser and Cass (1998) and Kean et al (2000).
Ammonia emission factor based on mg km−1 can be estimated using the fuel efficiency. Wagner et al (2009) estimated the 2006 average fuel consumption of cars in China to be 7.95 L/100 km and projected a 2009 new passenger car average fuel consumption of 7.87 L/100 km. Using 7.87 L/100 km as the average fuel efficiency, we obtained ammonia emission factor of 230 ± 14 mg km−1 (mean ± 95% C.I.) for the light-duty gasoline vehicles. A comparison of ammonia emission factor with those from other tunnel studies is given in table 2. Also ammonia emission factor in mg km−1 measured in the Zhujiang tunnel was the highest among the studies (Moeckli et al 1996, Fraser and Cass 1998, Kean et al 2000, Emmenegger et al 2004).
Table 2. Comparison of NH3 and NOx emission factors (EF) with other tunnel studies.
| NH3 | NOx | |||||
|---|---|---|---|---|---|---|
| Year | Location | (mg km−1) | (g L−1) | (g km−1) | (g L−1) | References |
| 2013 | Zhujiang Tunnel, Guangzhou | 230 ± 14 | 2.92 ± 0.18 | 0.56 ± 0.05 | 7.17 ± 0.60 | This study |
| 1993 | Van Nuys Tunnel, California | 61 | 0.38 | — | — | Fraser and Cass (1998) |
| 1993 | Gubrist Tunnel, Switzerland | — | — | 2.25 | — | Staehelin et al (1995) |
| 1995 | Gubrist Tunnel, Switzerland | 15 ± 4 | — | — | — | Moeckli et al (1996) |
| 1998–1999 | Söderleds Tunnel, Stockholm | — | — | 1.4 | — | Kristensson et al (2004) |
| 1999 | Caldecott Tunnel, California | 49 ± 3 | 0.48 ± 0.03 | 0.32 ± 0.01 | 3.16 ± 0.11 | Kean et al (2000) |
| 2000 | Taipei Tunnel, Taipei | — | — | 0.9 ± 0.18 | — | Hwa et al (2002) |
| 2002 | Gubrist Tunnel, Switzerland | 31 ± 4 | — | — | — | Emmenegger et al (2004) |
| 2005 | Chung-Lian Tunnel, Taiwan | — | — | 0.73 ± 0.15 | — | Chiang et al (2007) |
| 2006 | Hsuehshan Tunnel, Taiwan | — | — | downslope: 0.15 ± 0.07 upslope: 0.33 ± 0.17 | — | Chang et al (2009) |
| 2009 | Loma Larga Tunnel, Monterry | — | — | 0.11 ± 0.07 | 4.7 ± 2.1 | Mancilla et al (2012) |
Since NH3 is present in human breath in levels ranging 100–2000 ppb (Španěl et al 1998, Kearney et al 2002), how much NH3 could be attributed to passengers inside the vehicles? Assuming inhalation rate of 10–15 L min−1 for an adult, and taking the NH3 level in human breath as its upper limit of 2000 ppb, the emission of NH3 would be 13.7–20.3 μg min−1 for an adult, quite near that of 18.7 μg min−1 as reported by Ament et al (1999). Even with the emission rate of 20.3 μg min−1, emission factor of NH3 from human breath would be 0.16 mg km−1 assuming an average of five passengers per vehicle and an average vehicle speed of 45 km h−1 in the tunnel. This factor was negligible compared to the 230 mg km−1 from vehicles. Moreover, vehicles passing the tunnels had their windows closed, with a quite limited portion of NH3 from human breath entering the tunnel through indoor/outdoor exchange. The higher gasoline sulfur levels in China may impact the NH3 emission. As observed by Durbin et al (2004), NH3 emission rates were approximately five times higher over the more aggressive US06 test cycle compared to the federal test procedure (FTP) cycle, and sulfur did not affect NH3 emissions over the FTP, but higher NH3 emissions were found for increasing fuel sulfur levels over the US06. Malfunctioning three-way-catalysts might be a major factor causing higher ammonia emissions. Fraser and Cass (1998) reported ammonia emission factors ranging from 67.0 to 166.6 mg km−1 for light-duty vehicles equipped with malfunctioning three-way-catalysts. Nevertheless, it is a question that needs further investigation whether the much higher NH3 emission factor in this study was resulted from fuel quality, performance of catalytic converters or driving conditions.
NOx (as NO) emission factor was determined to be 7.17 ± 0.60 g L−1 (0.56 ± 0.05 g km−1) (mean ± 95% C.I.) when averaged over the entire fleet in the Zhujiang tunnel. As shown in table 2, NOx emission factor in the Zhujiang tunnel is within the range of other studies. Che et al (2009) estimated a NOx emission factor of 1.40 g km−1 for light-duty gasoline vehicles in 2006 in the PRD region using MOBILE and PART5 model, and Liao et al (2011), using COPERT IV model, estimated a NOx emission factor of 0.51 g km−1 for light-duty gasoline vehicles in Guangzhou in 2008. Our NOx emission factor was quite near that by Liao et al (2012) but less than half of that by Che et al (2009).
3.3. Implications
The most comprehensive NH3 emission inventory for on-road mobile source in the PRD region was recently compiled by Zheng et al (2012). This inventory, however, was based on the emission factors taken from the Emission Inventory Improvement Program (EIIP) by Reo et al (2004), which were 63.2, 4.2, 28.0, 16.8, and 7.0 mg km−1 for light-duty gasoline, light-duty diesel, heavy-duty gasoline, heavy-duty diesel vehicles, and motorcycles, respectively. They obtained NH3 emission of 4.9 kt yr−1, or 2.5% of the total NH3 emissions, from on-road mobile source in the PRD region in 2006. If we just replace the emission factor for light-duty gasoline vehicles with 230 mg km−1 determined in this study, NH3 emission from on-road mobile sources by Zheng et al (2012) would then reach 16.8 kt yr−1 and account for 8.1% of the total NH3 emission in the region, comparable to 10% obtained by Yao et al (2013) near a highway with the highest traffic density in Canada. As all newly manufactured light-duty vehicles in China are equipped with TWC for exhaust control, and meanwhile in recent decades vehicle population in the PRD region is increasing rapidly at a rate of over 10% per year (Che et al 2011), NH3 emission from vehicle exhausts would become increasingly important. Applying this emission factor to the vehicle population in 2012 in the PRD region, for NH3 emission from on-road mobile source we would get an estimate of 44.2 kt yr−1, which is about 2.6 times that in 2006. If the total agricultural NH3 emissions in 2012 were the same as that in 2006 as estimated by Zheng et al (2012), NH3 emission from vehicle exhausts would occupy a share as high as 18.8% in the total NH3 emission. In urban areas where on-road vehicle density is relatively higher and there is much less agricultural activity, NH3 emission from on-road vehicles would be more distinctive and thus greatly influence the near-surface atmospheric chemistry. Further studies are needed to make clear the reason for the much higher emission factors determined from our tunnel tests in Guangzhou.
Acknowledgments
This study was supported by National Natural Science Foundation of China (Project No. 41025012/41121063), Strategic Priority Research Program of the Chinese Academy of Sciences (Grant No. XDB05010200) and NSFC-Guangdong Joint Funds (U0833003).