
Abstract
The rapid growth of streaming video entertainment has recently received attention as a possibly less energy intensive alternative to the manufacturing and transportation of digital video discs (DVDs). This study utilizes a life-cycle assessment approach to estimate the primary energy use and greenhouse-gas emissions associated with video viewing through both traditional DVD methods and online video streaming. Base-case estimates for 2011 video viewing energy and CO2(e) emission intensities indicate video streaming can be more efficient than DVDs, depending on DVD viewing method. Video streaming benefits from relatively more efficient end-user devices than DVD viewing, though much of that savings is lost when accounting for the additional energy from network data transmission. Video streaming appears distinctly favorable when compared against any DVD viewing that includes consumer driving, which significantly increases the energy and CO2(e) emissions per viewing hour. Total US 2011 video viewing required about 192 PJ of primary energy and emitted about 10.5 billion kg of CO2(e). Shifting all 2011 DVD viewing to video streaming reduces the total primary energy use to about 162 PJ and the CO2(e) emissions to about 8.6 billion kg, representing a savings equivalent to the primary energy used to meet the electricity demand of nearly 200 000 US households each year. Sensitivity analysis indicates that results are most influenced by the end-user DVD player power demand, data transmission energy, and consumer travel for store DVDs. Data center energy use—both operational and embodied within the IT equipment—account for <1% of the total video streaming energy use. Results from this study indicate that designers and policy makers should focus on the efficiency of end-user devices and network transmission energy to curb future increases in energy use from the proliferation of video streaming.
Export citation and abstract BibTeX RIS

Content from this work may be used under the terms of the Creative Commons Attribution 3.0 licence. Any further distribution of this work must maintain attribution to the author(s) and the title of the work, journal citation and DOI.
Introduction
Data centers, house servers and other electronic devices necessary to provide the information and communication technology (ICT) services are pervasive throughout our society. The rapid proliferation of these buildings has received much attention and increased scrutiny [1, 2], given that their energy demand has grown to about 1.3% of global electricity use [3, 4]. However, great strides have been made recently to reduce the energy associated with providing ICT services by better utilizing data center servers and consolidating those servers in larger, more energy efficient facilities [5]. Furthermore, ICT services may also yield net reductions in societal energy use and environmental impacts as these services augment or replace traditionally non-ICT activities [6, 7], such as utilizing teleconferencing to reduce business travel [8]. One strategy available with ICT is the dematerialization associated with replacing physical goods with equivalent services provided through the internet [9–11]. Streaming music and video entertainment are examples of this type of dematerialization that have recently experienced rapid growth and have received attention as possibly less energy intensive alternatives to the manufacturing and transportation of physical goods, such as digital video discs (DVDs) and compact discs (CDs) [12–14]. This study aims to better understand the net energy and emissions implications of the growing shift from DVD use in the United States to video streaming services. A life-cycle assessment (LCA) approach is utilized to estimate the energy use and greenhouse-gas emissions of present day (2011) streaming video systems compared to present day physical DVD systems. The methods and results presented in this study illuminate the streaming video system components that most affect life-cycle energy use and emissions, which can help focus future research towards reducing the impact of these components as the widespread shift to streaming video continues.
Approach
This study applies the Cloud Energy and Emission Research (CLEER) model [5] to estimate the primary energy use and carbon dioxide equivalent (CO2(e)) emissions associated with replacing in-home DVD viewing with internet video streaming services in the United States. The CLEER model provides a systems-wide perspective of the energy use and CO2(e) emissions across different components of ICT services; from data centers to end-user devices. The model also includes non-IT modules, such as product manufacturing, transportation, and building energy use, to allow for the comparison of services that influence different economic sectors [15].
Input values characterizing present day US home video viewing of both DVDs and internet streaming content were entered into the CLEER model. For many of these inputs, ranges of values were applied to provide a high, low, and base-case input value, and to serve as a sensitivity analysis range. The base-case input values are derived from literature estimates and are intended to represent a typical or median value across a possible range of values within the US. As such, the base-case represents the authors' best estimates of US average energy use and CO2(e) emissions per viewing hour. When scaled up by total viewing hours, the base-case provides a best estimate of total national energy use and CO2(e) emissions attributable to each viewing method. Given that US average values for each modeling parameter are best estimates with appreciable uncertainties, high and low cases for each modeling parameter were also established. The high and low case values are meant to provide a plausible range for the US average value chosen for each parameter in the base case. As such, the high and low cases should not be interpreted as extreme bounds on the technically-possible values for each parameter; rather, they should be interpreted as plausible uncertainty ranges for the US average point values chosen for each parameter in the base-case. A summary of all high, low, and base-case input values used in this analysis is presented in the Supporting Online Material (SOM). Results normalized by viewing hour were also compared with a scenario in which all 2011 US DVD viewing is shifted to a streaming video service, to shed light on the potential primary energy use and CO2(e) emissions implications of the ongoing trend from DVDs to streaming video. Streaming video in this study is limited to content typically found on DVDs, such as full-length movies or television programs, while short internet video clips, such as those found on YouTube, are excluded since they are assumed to not represent a direct replacement of viewing content from physical DVDs. The term DVD is used to describe both regular and high definition (i.e., Bluray) discs throughout this article. DVDs are separated into two rental and two purchase categories: (1) 'Mail Rented' represents a Netflix model for mail service subscriptions, where DVDs are mailed directly to the consumer from centralized warehouses; (2) 'Store Rented' represents brick-and-mortar DVD stores (e.g., Blockbuster) or kiosks (e.g., Redbox) where the consumer travels a short distance to pick up and return rental discs; (3) 'Mail Purchased' represents DVDs purchased online and mailed directly to the consumer (e.g., via Amazon); and (4) 'Store Purchased' represents DVDs purchased from a brick-and-mortar store (e.g., Walmart).
DVD system assumptions
Figure 1 depicts the energy consuming processes and devices required in providing DVD video service to the in-home viewer. The process steps in figure 1 include DVDs being transported by freight from the manufacturing plant to a storefront or distribution warehouse. For rentals, DVDs are then removed from their manufacture case and placed in a company-specific case (Store Rental) or rental sleeve (Mail Rented). DVDs at distribution warehouses are then transported to the consumer through postal delivery, while DVDs at storefronts are picked up directly by the consumer. A playback device (e.g., a DVD player) is then coupled with a viewing device (e.g., a television) to watch the video.

Figure 1. System diagram of DVD viewing analysis. Various components evaluated within each process step required in providing DVD video service. Boxes with double lines represent components where embodied energy and embodied CO2(e) emissions are also included in the analysis.
Download figure:
Standard image High-resolution imageTable 1 presents estimates of 2011 US DVD activity that are used in this study to estimate national energy use, separated by DVD category. An approximate 2.2 million DVDs mailed per day by Netflix [13, 16] is assumed to represent the whole mail rental industry, since Netflix dominates the market as a rent-by-mail provider [17]. Each DVD is assumed to contain two hours of video content and be viewed once per mailing, resulting in an estimated 1.6 billion viewing hours annually for US mail rentals. US store rented DVDs are estimated to account for 3.6 billion viewing hours, based on the market distribution of movie rentals shown in figure 2 [17].
Table 1. 2011 US DVD characteristics.
| DVD type | New DVDs bought in 2011 (millions) | Average annual views per DVD | Average disc lifetime (years) | Warehouse shipping, by truck (km) | USPS shipping (km) | Consumer travel (km) |
|---|---|---|---|---|---|---|
| Mail rented | 14 | 20 | 3 | 1,825 | 420 | — |
| Store rented | 30 | 20 | 3 | 1,825 | — | 5.4 |
| Mail purchased | 600 | 1 | 5 | 1,825 | 210 | — |
| Store purchased | 600 | 1 | 5 | 1,825 | — | 17 |
| Total | 1,240 | — | — | — | — | — |
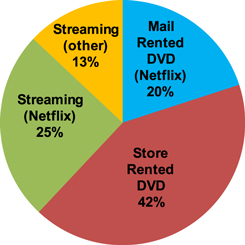
Figure 2. Estimated 2011 distribution of movie rental shares. Movie rental share distribution interpreted from NPD market estimates for the first half of 2012 (NPD, 2012)
Download figure:
Standard image High-resolution imageUS rental DVDs are assumed to have an average lifetime of two to five years, with a base-case estimate of three years, which matches the short-life property classification assigned to DVDs [18, 19]. The lifetime for purchased DVDs (i.e., before obsolescence) is extended to three to eight years, with a base-case estimate of five years, to account for reduced use and handling relative to rental DVDs.
Annual US consumer purchases of DVDs are estimated at about 1.2 billion, based on market analysis data [20]. Lacking additional data, consumer DVD sales are equally divided between mail purchased and store purchased DVDs (600 million each). For rental DVDs, one-third of the rental DVD stock is estimated to be replenished each year, assuming a near steady-state in rental DVD stock and a three year average rental DVD lifetime. Assuming each DVD is rented 20 times per year [21], the number of DVDs bought by rental companies annually in the US for the Mail Rented and Store Rented categories, is estimated at 14 million and 30 million, respectively.
Consumer purchased DVDs are assumed to be viewed an average of once per year over a five-year average lifetime, corresponding to 3.0 billion annual views from each the Mail Purchased and Store Purchased DVD stock. The sum of annual DVD viewing hours from all four categories equals approximately 17.2 billion, or a per capita viewing of about five hours per month, which is consistent with recent US consumer media usage estimates [22].
Table 2 presents DVD characteristics, embodied energy estimates, and shipping distances that are utilized as base-case values this study [13, 23, 24]. A distance of 1825 km for shipping a DVD from manufacturing plant to store location is assumed based on previous work [22] and applied to all four DVD types, assuming a broad placement of stores and distribution centers across the US. Primary energy and CO2(e) emissions associated with transport from the manufacturing plant are based on fuel intensity estimates normalized by shipment mass for diesel fueled combination trucks [25].
Table 2. Mass and embodied energy values of DVD components.
| DVD component | Mass (g) | Embodied energy (MJ/component) | Embodied CO2 (g CO2(e)/component) | Component use by DVD type |
|---|---|---|---|---|
| Disc | 18 | 1.35 | 48.8 | All four types |
| Case | 85 | 0.18 | 8.8 | All four types, with an additional case in store rented |
| Sleeve | 3 | 0.13 | 6.3 | Only in mail rented |
A postal service transport of 210 km (round trip) is assumed to deliver the mail purchased DVDs from distribution warehouse to consumer [23] in diesel trucks, with the primary energy and CO2(e) emissions of transport again estimated from [25]. A 17 km (round trip) distance is assumed by personal vehicle for Store Purchased, based on estimates by [24] for the average round trip distance to retail CD stores in the US. Also consistent with [24], 50% of the trip is apportioned to the DVD transport to account for multiple purchases and errands per trip in the base-case, while 90% and 10% are used in the high and low cases, respectively. Outlets for DVD rentals are assumed to be in closer proximity than DVD purchases and a round trip distance of 2.7 km is used, corresponding to the US national average household distance to the nearest supermarket [26], which is a common location for DVD rental kiosks. Energy use and emissions due to consumer travel are based on gasoline intensity estimates [25]. Vehicle fuel efficiency for a mid-size sedan, minivan, and compact hybrid vehicle are used in the base-case, high case, and low case, respectively [27]. For rental DVDs, one round trip for DVD pickup and one round trip to return the DVD is assumed, corresponding to distances of 420 km by postal service for Mail Rented DVDs and 5.4 km by consumer for Store Rented DVDs. Again, 50% of the consumer trip for Store Rented DVDs is apportioned to the DVD transport to account for multiple rentals (or renting and returning DVDs simultaneously) and additional errands conducted per trip.
Streaming video system assumptions
Figure 3 depicts the energy using processes and devices associated with providing streaming video service to the in-home viewer. The process steps in figure 3 show video files originating from servers in data centers. The video files are then sent across the network transmission infrastructure; from a core/metro network to an access network connection pathway. The transmission then reaches a router or cable box (i.e., customer premise equipment) within the home before being sent to a playback device (e.g., set-top box) that is coupled with a viewing device (e.g., television) to watch the video.
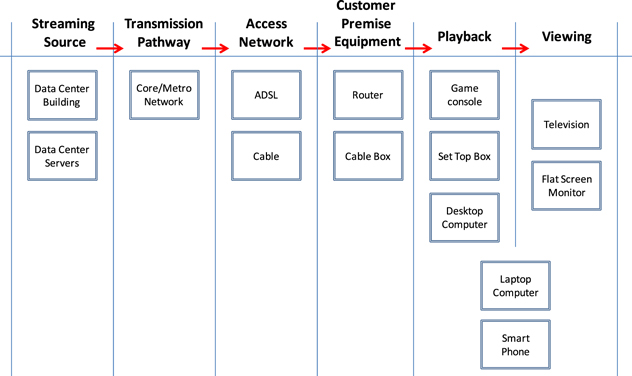
Figure 3. System diagram of streaming analysis. Various components evaluated within each process step required in providing streaming video service. Boxes with double lines represent components where embodied energy and CO2(e) emissions are also included in the analysis.
Download figure:
Standard image High-resolution imageTable 3 presents the server and network characteristics assumed as base-case estimates for the 2011 US streaming video delivery system. Total current US streaming viewing hours for full-length movies or television programs are estimated at 3.2 billion h, which is based on the Rental DVD viewing hour estimates in table 1 and the distribution of movie rental shares shown in figure 2 [17], and is consistent with other market analysis data [20]. An average streaming rate of 2.33 Mbps [28] is applied to the annual hours of video content to estimate the total bits of streamed content. To allocate server power (including idle power) across data flows, each server is assumed to draw an average power of 300 W and stream content at a maximum sustained rate of 1.5 Gbps based on the configuration of Netflix content delivery network devices [29]. Data centers hosting streaming video are assumed to have the characteristics of cloud data centers, where the number of servers in use scales with demand [30], allowing the number of servers to be estimated by applying the bits processed per server to the total bits streamed annually of video content. A power use effectiveness of 1.3 is assumed to represent the efficient use of infrastructure equipment in larger centers [5, 31]. When including an average utilization rate of 40% for servers in cloud data centers [32], approximately 1400 dedicated servers are estimated to meet current US streaming video demand with an average data streaming electricity intensity of 1.1 Wh GB−1. Given the large storage capacity of servers configured for video streaming [33], video storage demand is assumed to be met solely by the servers and no external hard disk drives (HDDs) within data centers are included in this analysis. Cradle-to-gate primary energy and CO2(e) emission factors of 13.65 MJ and 0.69 kg CO2(e) for each kWh of electricity consumed during operation are used as base-case estimates to represent a national average electricity grid mix and account for the energy and emissions during fuel extraction, refining, and transport as well as combustion and transmission losses [34]. The embodied energy and CO2(e) intensity of data center IT equipment are derived from values in the CLEER model, which are based literature estimates [35–37] and are presented in the SOM.
Table 3. 2011 US streaming video characteristics.
| Streaming video characteristics | |
|---|---|
| Annual video viewing (billion h) | 3.2 |
| Average streaming rate per video (Mbps) | 2.3 |
| Total bits streamed annually (petabits) | 26.2 |
| Average power per server (W) | 300 |
| Average cloud server utilization | 40% |
| Annual processed data per server (terabits/server) | 19 |
| Simultaneous videos streamed per server | 260 |
| Average server streaming electricity intensity (Wh/GB) | 1.1 |
| Total number of servers to meet current demand | 1,400 |
This analysis uses an estimated network energy intensity range of 0.15 to 0.43 kWh per GB of data transferred across the core/metro, access, and customer premise equipment, representing a range consistent with literature values observed in [38–42]. Specifically, a base-case estimate of 0.29 kWh GB−1 is derived from measurements in [38] from 2010 and 2013, and scaled to 2011 based on a 20% annual reduction in network energy intensity observed in that same study. The low case estimate of 0.15 is based on 2009 network energy intensity measurements from [42] of transmission equipment between large institutions. This low case 2009 estimate from [42] is again scaled to 2011 based on a 20% annual reduction in network energy intensity observed in [38]. The range between the base-case and the low case was used to define a high case value of equal range from the base-case, at 0.43 kWh per GB transferred. Overall embodied energy and CO2(e) intensity across the core and access network is estimated at 0.3 MJ and 30 g CO2(e) per GB transferred, again based on literature values utilized in the CLEER model [36, 40, 43] and presented in the SOM.
End-user device assumptions
Table 4 presents the assumed time use distribution of video viewing devices for both DVD and streaming video. Personal computers are assumed to make up only a small portion of DVD viewing, estimated at 10% [44] and equally split between laptop use and using a desktop computer with a monitor. The remaining 90% of DVD viewing is assumed to occur on a television accompanied with a DVD playing device. Along with DVD players, video game consoles are also assumed to operate as playback devices for DVDs [45]. The 90% of DVD playback time from these devices is apportioned at 14% and 76% for game consoles and DVD players, respectively, based on annual hourly electrical appliance usage data [46] and estimates of video games console use dedicated for playing DVDs [47].
Table 4. 2011 distribution of video viewing time by device.
| % time watched with viewing device | ||||
|---|---|---|---|---|
| Device | DVD | Streaming | ||
| Monitor | Console | Monitor | Console | |
| Desktop computer | — | 5% | — | 10% |
| Laptop computer | 5% | 5% | 10% | 10% |
| Flat panel monitors | 5% | — | 10% | — |
| Smart phones | — | — | 3% | 3% |
| DVD players | — | 76% | — | — |
| Set top boxes | — | — | — | 21% |
| Televisions | 90% | — | 77% | 6% |
| Video game systems | — | 14% | — | 50% |
The percentages of total video streaming viewing time attributable to computers, televisions, and mobile devices are estimated at 20%, 77%, and 3%, respectively [48]. Similar to the DVD viewing assumptions, computer use is split equally between using a laptop and using a desktop computer with a monitor. Internet enabled television viewing only accounts for 6% of the playback device time for video streaming [49], while the remaining television viewing time is assumed to be paired with another device for video playback. Video playback through game consoles with internet access is assumed to account for 50% of all streaming video playback hours [45], with the remaining 21% of video playback hours applied set-top boxes, which are assumed to include internet-enabled DVD players [49].
Operational energy use for each of the end-user devices in table 4 is based on US DOE Building Energy Data Book values [46] in the base-case estimate. The base-case values are increased or decreased by 50% to represent the high and low case estimates, respectively, which is consistent with the efficiency ranges observed comparing Building Energy Data Book values with other estimates [50] and US EPA Energy Star products criteria [51]. Operational energy use is distinguished for devices in 'on' mode, 'off' mode, and 'idle' mode, when applicable. Idle- and off-mode energy use is allocated to the viewing time based on the proportion of device on-time applied to video viewing. The embodied energy and CO2(e) intensity of end-user devices is again based on literature estimates contained in the CLEER model [37, 52–54] and presented in the SOM.
Results and discussion
Figure 4 presents estimates of the life-cycle primary energy use and CO2(e) emissions attributable to video viewing in the US, based on the base-case input assumptions described in the previous sections. These results indicate that video streaming is somewhat more efficient than DVD viewing in the base-case, requiring 7.9 MJ of primary energy and emitting 0.42 kg of CO2(e) per viewing hour, compared to 7.8–12.0 MJ of primary energy and 0.40–0.71 kg of CO2(e) per viewing hour for DVDs, depending on DVD viewing method. Streaming appears similar in efficiency to mail-delivered DVD viewing, but more efficient when compared to Store Rented and Store Purchased DVDs, owing to the impact associated with consumer driving. The energy and CO2(e) emissions from consumer driving for Store Rented DVDs, where driving is associated with each DVD viewing, is significant and similar in scale to that of the end-user devices. The embodied energy associated with the manufacturing and shipping of the DVDs themselves (excluding consumer transport) account for about 1–2% of the total primary energy use for purchased DVDs, and well below 1% for rented DVDs, indicating that even significant increases in shipping impact (e.g., long distance air-mail express delivery) have minimal impact on the overall primary energy demand and CO2(e) emissions. In general, the operational energy use required for end-user viewing devices dominates the energy demand, accounting for nearly all of the energy use associated with mail-delivered DVD viewing. The noticeable drop in end-user device operational energy for video streaming is due to a shift away from older less efficient DVD players, which typically have significant idle energy demand while also being devices dedicated for the single purpose of DVD viewing (i.e., idle energy is apportioned to relatively few viewing hours). The improvement in end-user device operational energy with video streaming is nearly offset by the energy dedicated to the data transmission network. About 90% of the streaming video energy is dedicated to operating both end-user devices and the data transmission network. The embodied energy of the end-user devices and of the data transmission network equipment account for most of the remaining 10% of total energy use. Interestingly, the energy use associated with data centers, both operational and embodied, account for <1% of the total energy use required for video streaming. The nearly negligible relative energy contribution from data centers is due to the large capacity and high utilization of video streaming available from cloud-based IT equipment.

Figure 4. Estimated per viewing hour primary energy use and CO2(e) emissions associated with US video streaming and DVD viewing. Primary energy and CO2(e) emissions estimates attributable per hour of video viewing in the US, based on the base-case input assumptions. Video steaming requires 7.9 MJ of primary energy and emits 0.42 kg of CO2(e) per viewing hour. Primary energy for DVD viewing is 7.8, 12.0, 7.9, and 10.6 MJ per viewing hour for Mail Rented, Store Rented, Mail Purchased, and Store Purchased, respectively. CO2(e) emission for DVD viewing is 0.40, 0.71, 0.41, and 0.60 kg per viewing hour for Mail Rented, Store Rented, Mail Purchased, and Store Purchased, respectively.
Download figure:
Standard image High-resolution imageFigure 5 estimates of the 2011 US total life-cycle energy use and CO2(e) emissions attributable to video viewing, based on total viewing hour estimates and the base-case input assumptions. For physical DVD systems in 2011, an estimated 167 PJ of primary energy was consumed and 9.2 billion kg of CO2(e) were emitted to provide about 17.2 billion h of DVD viewing in US homes. For video streaming, figure 5 shows that the 3.2 billion h viewed in 2011 required about 25 PJ of primary energy and emitted 1.3 billion kg of CO2(e). Combined, 2011 viewing of physical DVDs and streaming video amount to an estimated 192 PJ of primary energy and 10.4 billion kg of CO2(e). For context, 192 PJ is equivalent to the amount of primary energy used to meet the electricity demand of about one million US households each year [55].
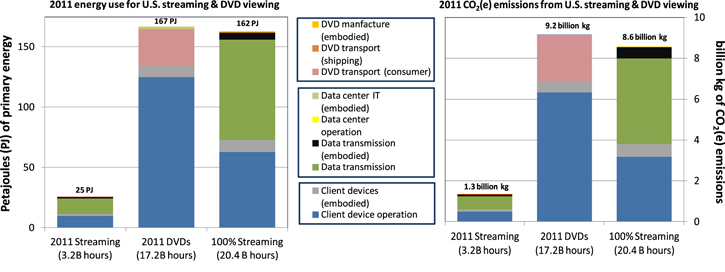
Figure 5. Estimated 2011 total US primary energy use and CO2(e) emissions attributable to video streaming and DVD viewing. 2011 DVD and video streaming together account for about 192 PJ of primary energy and about 10.5 billion kg of CO2(e) emissions. Shifting all DVD viewing to streaming video represents a potential energy and savings of about 30 PJ and 2 billion kg of avoided CO2(e) emissions.
Download figure:
Standard image High-resolution imageFigure 5 also presents the hypothetical energy use and CO2(e) emissions if the 17.2 billion h of DVD viewing were shifted entirely to streaming video, which is indicative of the trend away from DVDs and toward streaming that is underway. In this case, a total of 20.4 billion h of streaming would occur in the US, where such a shift to streaming video represents a potential energy savings of almost 30 PJ and about 2 billion kg of avoided CO2(e) emissions compared to the base-case for DVDs. Much of the energy use reduction in shifting from DVD to streaming video is due to the change in end-user devices away from DVD players. Interestingly, the results in figure 5 suggest that the total energy use for the data transmission of streaming video would be greater than the energy associated with the current transport of DVDs.
A sensitivity analysis using Crystal Ball [56] on the primary energy use and CO2(e) emissions from DVD viewing and video streaming was performed by varying all the inputs parameters presented in the SOM across the high, low, and base-case estimates. Varying the input parameters by these ranges indicates that the results are most sensitive to inputs associated with three components of the CLEER model; (1) the end-user DVD player power demand; (2) the electricity use to operate the data transmission network; and (3) consumer travel for the Store Purchased and Store Rented DVDs.
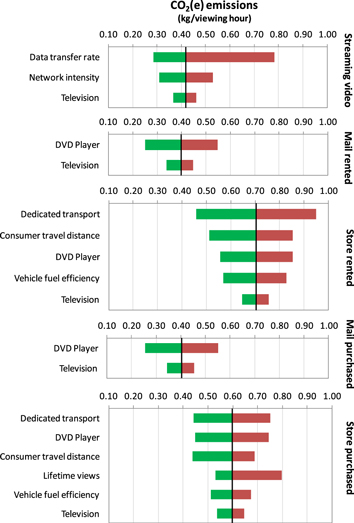
Figure 6 presents the variation in average US CO2(e) emissions from DVD and streaming video per viewing hour when varying key input drivers among the high, low, and base-case estimates. Inputs significantly affecting video streaming include the data transfer rate, the network energy intensity, and the power demand of end-user devices. The data transfer rate is shown to create a wide range of potential CO2(e) emissions when varied from the low case of 1 Mbps, representing standard definition streaming, to the high case of 6 Mbps, representing Netflix Super HD streaming rate [57]. To place these streaming rates in context, digital high-definition video downloads typically have files size around 2 GB per hour of video, representing an equivalent streaming rate of about 4.5 Mbps [58]. The significant increase in CO2(e) emissions associated with the higher data transfer rates shown in figure 6 highlights that improvements in network energy efficiency must accompany any future increases in data transfer rates for streaming video to remain a lower energy and CO2(e) alternative to DVD viewing.
Figure 6. Range of US average US CO2(e) emissions per hour of video viewing under different sensitive input assumptions. Horizontal axes represents emissions of CO2(e) per viewing hour (0.1 to1.0 kg/viewing hour). The vertical black lines are set to the CO2(e) emission estimate that results from the base-case input estimate for each viewing method: 0.42, 0.40, 0.71, 0.41, and 0.60 kg of CO2(e) per viewing hour for Streaming Video, Mail Rented, Store Rented, Mail Purchased, and Store Purchased, respectively. (i.e., the same estimates presented in figure 4). System component input parameters are listed on the vertical axes. For each parameter, the input estimate is changed from the base-case to the high and low case, with all other inputs held constant. The impact on CO2(e) emissions from applying the high and low case value is presented by the red and green bars, respectively. Only parameters that change the emissions results by more than ±10% are listed. All high, low, and base-case input assumptions are presented in the SOM. The significant regional variation in CO2(e) intensity of electricity generation is not included here and is separately addressed in the SOM.
Download figure:
Standard image High-resolution image
Figure 6 shows that the CO2(e) emissions from mail-delivered DVD viewing is primarily impacted by end-user devices, where the efficiency of DVD players is significant. Along with end-user devices, CO2(e) emissions from Store Rented and Store Purchased DVD are also significantly affected by characteristics of consumer travel, such as driving distance, fuel efficiency, and percentage of travel dedicated to DVD transport. Store Purchased DVDs also appear sensitive to the lifetime views of the DVD, since the number of views affect how the consumer travel impacts are apportioned. The sensitivity results for DVD viewing in figure 6 indicate that possible future increases in DVD equipment efficiency, urbanization (i.e., shorter driving distances), advances in vehicle efficiency, and more environmentally conscious consumer driving trips could significantly reduce the energy and CO2(e) emissions associated with all methods of DVD viewing.
Key assumptions and future work
While the results presented in this study can provide insight into the magnitude of energy use and CO2(e) emissions from video streaming and DVD viewing, as well as the relative contributions of different video system components, the lack of user data, variability of equipment characteristics, and rapid evolution of video viewing technology confine any estimates to the specific assumptions applied to this study. Here are brief statements regarding assumptions and anticipated changes to video viewing that warrant further research.
Variations in electricity grid mix
The primary energy use and CO2(e) emissions estimates presented in the base-case assume electricity generation from US average electricity grid mix. While the US electricity grid mix is appropriate for estimating the average primary energy use and emissions per viewing hour for all US residents in the base case, how each viewing method compares at the local level for any US individual is highly dependent upon the local electricity grid mix. For example, a household located in the state of Washington is supplied with electricity generated largely by hydropower, whereas a household located in the state of Wyoming relies on electricity generated by coal-fired power plants. The primary energy and CO2(e) intensities of these two electricity mixes differ greatly. The effect of local grid mix on US individual results has been assessed in figure S1 in the SOM, which presents results for the primary energy use and CO2(e) emissions per viewing hour for these two drastically different electricity mixes. The results demonstrate how differences in electricity mix lead to differences in the primary energy use and emissions associated with a viewing hour, as well as relative differences in the contributing factors to primary energy use and emissions. In areas like Washington with significant hydropower, CO2(e) emissions are reduced across all viewing methods, but the comparison leans decidedly away from video viewing associated with consumer driving, where Store Rented viewing produces four times more CO2(e) emissions per viewing hour than video streaming. In fossil-fuel dominated electricity areas like Wyoming, the higher emissions electricity increases emissions across all viewing methods but the relative differences among the viewing methods begin to diminish, with Store Rented viewing producing about 50% more CO2(e) emissions per viewing hour than video streaming. See figure S1 and the accompanying text in the SOM for additional detail regarding this comparison. While this paper applies an average US electricity grid mix to examine the net effects of shifting from DVDs to streaming video at the national level, future work should consider how variations in local electricity grid mix impact the comparison of video viewing methods for any individual. Future research should also explore how electricity generation trends toward lower greenhouse-gas intensive fuels and renewables could help to reduce the national-level impacts of streaming video in the future.
Discrepancy in DVD and streaming video quality
While video streaming quality is rapidly improving, DVDs still offer a higher quality video and audio service (in the form of BluRay discs). While Netflix's maximum Super HD streaming rate is 6 Mbps, the typical streaming rate of a BluRay disc is approximately 20 Mbps. The analysis presented here does not account for this difference in utility and instead considers all video viewing methods as equivalent services to the consumer. The quality gap between streaming and DVD video may continue to close with improved data compression technology, however, if more complex video platforms gain popularity in the marketplace (i.e., ultra high-definition or three-dimensional video), streaming video may require greater data transfer rates while the change in manufacturing and transport of physical media would be minimal. Determining how improved levels of quality affect streaming and DVD video differently, and developing methods to normalize those differences, are opportunities for future research.
Evolution of data transmission networks
Network energy use in this analysis is based on a traditional core/metro/access network architecture and does not consider video distribution that retrieves content from various strategically located third-party content delivery networks. Additionally, growth in mobile device use and improvements in cellular data transmission may lead to more video viewing across cellular networks. Future analyses should explore how shifts in data transmission networks for video content affect overall energy use of video streaming.
Advances in end-user streaming devices
The operational energy demands of end-user devices account for the majority of primary energy use and CO2(e) emissions associated with both DVD and streaming video viewing. The energy demand for streaming end-user devices is much less than DVD viewing, owing to a shift away from less efficient DVD players. However, the potential for increased efficiency gains from streaming end-user device is still significant. Set-top boxes and video game systems, which support the majority of video streaming content, still include older less efficient models that require the same amount of power whether in active or idle modes [46]. Internet-enabled televisions, as well as new and emerging set-top boxes (e.g., Apple TV and Roku) that use drastically less power [59, 60], portend the possibility of significant improvements in video streaming efficiency. Future analyses should account for these newer end-user video streaming devices as they become more prevalent.
Rebound effect and alternative forms of video viewing
While the scope of this analysis is limited to comparing video streaming with DVD videos, the growth of video streaming can also be expected to serve as an alternative to other forms of video entertainment, such as cable and broadcast network television. Energy and CO2(e) analyses of these more traditional forms of television are needed to better understand the implications of video streaming beyond DVD replacement. Additionally the convenience, selection, and quality of video streaming may also lead to more video viewing hours. Future research should account for possible absolute increases in total viewing and compare this increase in video-related energy demand with the energy intensities of activities that video viewing may be replacing.
Device utilization dynamics
The network electricity intensity used in this analysis is derived by normalizing the total electricity of the network system by the amount of data transferred over a period of time. While the kWh GB−1 ratio implies linearity, in reality the network electricity remains primarily static during incremental increases in data transmission. Significant increases in electricity demand are only observed when greater data traffic requires an expansion of the network with additional equipment. Consequently, a given network with greater data transmission results in a lower network electricity intensity. Similarly, since equipment energy use throughout our analysis (from data center servers to end-user devices) includes the idle energy associated with that equipment, increasing the viewing hours on an end-user device reduces the number of idle hours apportioned to each viewing hour. This method causes the per-hour viewing energy to reduce as more videos are viewed per device. Developing other methods to account for network intensity and idle energy use, such as apportioning access networks and end-user device energy by household, may yield different insights and provides an opportunity for future research.
Other environmental burdens
The LCA applied in this research is limited to energy and CO2(e) emissions. Shifting from DVDs to video streaming may also lead to other environmental burdens due to changes in life-cycle resource use and emissions. Future LCAs of video streaming should include other environmental and human health impact categories for a broader assessment of environmental burdens and shifts between them.
Conclusions
This study estimates the primary energy use and CO2(e) emissions associated with video viewing through both traditional DVD methods and the growing use of online video streaming. 2011 DVD and video streaming energy intensities show video streaming similarly efficient to mail-delivered DVD viewing, while the efficiency of video streaming is more pronounced compared to Store Rented and Store Purchased DVDs, owing to the impact associated with consumer driving. Total US 2011 video viewing through both streaming and DVDs required about 192 PJ of primary energy and resulted in about 10.5 billion kg of CO2(e) emissions. Shifting all 2011 DVD viewing to video streaming reduces the total primary energy use to about 162 PJ and the CO2(e) emissions to about 8.6 billion kg, representing a savings equivalent to the primary energy used to meet the electricity demand of nearly 200 000 US households each year [55].
This study shows that end-user devices are responsible for the majority of energy use with both video streaming and DVD viewing. Much of the energy savings estimated in shifting to video streaming comes from precipitating a turnover in end-user devices to newer more efficient alternatives (i.e., away from old DVD players). This study also shows that data transmission energy and consumer travel account for significant portions of the total streaming video and DVD viewing energy use, respectively. Increases in data transmission to support more complex video content can drastically increase total video streaming energy use beyond that of DVD viewing. Additionally, any reductions in consumer travel energy, from both increased travel efficiency and reduced travel distances, will require more improvements in data transmission energy efficiency for streaming to remain a lower-energy video viewing alternative to DVDs.
While the rapid growth of data centers has received much attention, data center energy use—both operational and embodied within the IT equipment—account for <1% of the total video streaming energy use. Results from this study indicate that designers and policy makers should focus on the efficiency of end-user devices and network transmission energy to curb the energy use from future increases in video streaming. Proper innovation in video viewing devices and network technology can help video entertainment continually evolve towards becoming a more environmentally sustainable service.
Acknowledgments
This material is based upon work conducted by Lawrence Berkeley National Laboratory with support from Google. Lawrence Berkeley National Laboratory is supported by the Office of Science of the United States Department of Energy and operated under Contract Grant No. DE-AC02-05CH11231.