
Abstract
The El Niño–Southern Oscillation (ENSO) is a major driver of Northern Hemisphere wintertime variability and, generally, the key ingredient used in seasonal forecasts of wintertime surface climate. Modeling studies have recently suggested that ENSO teleconnections might involve both a tropospheric pathway and a stratospheric one. Here, using reanalysis data, we carefully distinguish between the two. We first note that the temperature and circulation anomalies associated with the tropospheric pathway are nearly equal and opposite during the warm (El Niño) and cold (La Niña) phases of ENSO, whereas those associated with the stratospheric pathway are of the same sign, irrespective of the ENSO phase. We then exploit this fact to isolate the two pathways. Our decomposition reveals that ENSOs climate impacts over North America are largely associated with the tropospheric pathway, whereas ENSOs climate impacts over the North Atlantic and Eurasia are greatly affected by the stratospheric pathway. The stratospheric pathway, which we here define on the basis of the occurrence of one or more sudden stratospheric warmings in a given winter, and whose signature projects very strongly on the North Atlantic Oscillation, is found to be present 60% of the time during ENSO winters (of either phase): it therefore likely plays an important role in improving seasonal forecasts, notably over the North Atlantic and the Eurasian continent.
Export citation and abstract BibTeX RIS

Content from this work may be used under the terms of the Creative Commons Attribution 3.0 licence. Any further distribution of this work must maintain attribution to the author(s) and the title of the work, journal citation and DOI.
1. Introduction
It is well established that El Niño–Southern Oscillation (ENSO) teleconnections cause important temperature and precipitation anomalies in the Northern Hemisphere in wintertime: as a consequence, ENSO is a fundamental component of most seasonal climate forecasts in the extratropics. Horel and Wallace (1981) showed that ENSO teleconnections resemble tropospheric Rossby wave trains forced in the tropical Pacific Ocean by slowly evolving anomalous sea surface temperatures (SSTs) via changes in precipitation. Many ENSO induced climate anomalies are, to first order, linear in character, i.e. their sign reverses as the tropical Pacific SST anomalies change from warm (El Niño) to cold (La Niña). In fact, over the Pacific and North American sectors, ENSO impacts can be largely accounted for with linear wave theory and simple ray tracing in the troposphere (Hoskins and Karoly 1981, Horel and Wallace 1981, Sardeshmukh and Hoskins 1988). We note, however, that over Europe and Asia the precise mechanism for ENSO impacts remains less clear (Greatbatch et al 2004, Toniazzo and Scaife 2006, Brönnimann et al 2007).
Because ENSO is a large perturbation of the climate system, it is not surprising that the stratosphere too is affected by anomalous tropical Pacific SSTs. The stratospheric response, however, is richer in character than the tropospheric response. On the one hand, the mean seasonal stratospheric response to ENSO is approximately linear: it is well documented that during El Niño winters the Northern Hemisphere polar vortex is anomalously weak as a consequence of enhanced planetary wave fluxes into the stratosphere (Van Loon and Labitzke 1987), resulting in a warmer stratosphere (Garfinkel and Hartmann 2007), and higher ozone concentrations in the polar regions (Randel et al 2009). Similar but oppositely signed anomalies are observed during La Niña winters, albeit with smaller amplitude (Manzini et al 2006, Garfinkel and Hartmann 2007, Free and Seidel 2009).
On the other hand, the extreme stratospheric response to ENSO is highly non-linear. This is clearly seen in the frequency of occurrence of so-called sudden stratospheric warmings (SSWs). During these events, the polar vortex is completely disrupted, the winds reverse from westerly to easterly, and the polar stratosphere warms by tens of degrees within a few days (Charlton and Polvani 2007). One might naïvely expect that SSWs would be enhanced during El Niño and suppressed during La Niña: however, as reported in Butler and Polvani (2011), the frequency of occurrence of SSWs is doubled during both phases of ENSO, compared with ENSO-neutral winters. This surprising fact is still poorly understood (Garfinkel et al 2012a).
The reason SSWs are important for surface conditions follows from the observation that significant tropospheric circulation anomalies can persist up to two months following the events (Baldwin and Dunkerton 2001). These anomalies resemble the negative phase of the North Atlantic Oscillation (NAO), or an equatorward shift of the mid-latitude jet, and are associated with a strong anomalous warming over the Arctic and Greenland, as well as strong cold air outbreaks over northern Eurasia (Perlwitz and Graf 1995, Thompson et al 2002, Kolstad et al 2009).
Since the majority of SSWs occur during ENSO winters (Butler and Polvani 2011), it is then natural to imagine the existence of a stratospheric pathway linking tropical Pacific SST anomalies to surface conditions over the North Atlantic and Eurasian regions. Unlike the familiar, quasi-linear, tropospheric Pacific–North American (PNA) teleconnection pattern, the stratospheric pathway consists of planetary waves that propagate primarily upwards, greatly perturbing the stratosphere and occasionally producing extreme events there (notably, SSWs), which subsequently affect surface conditions below, primarily in the North Atlantic sector and Eurasia. The sketch in figure 1 visually summarizes these two distinct ENSO pathways into the extratropics.
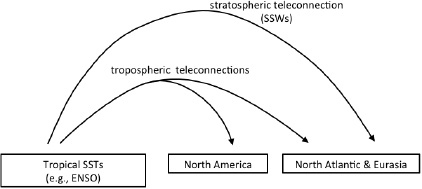
Figure 1. Schematic of possible pathways by which ENSO can influence the northern extratropics.
Download figure:
Standard image High-resolution imageWhile the study of tropospheric ENSO teleconnections has a long history (see, e.g., Trenberth et al 1998), the notion of a possible stratospheric pathway is relatively recent. It was hinted at by Brönnimann et al (2004), in a case study of the extremely cold Eurasian winters in 1940–1942, a strong and long-lasting El Niño with a highly perturbed stratosphere. Since then, several modeling studies (Toniazzo and Scaife 2006, Bell et al 2009, Cagnazzo and Manzini 2009, Ineson and Scaife 2009, Ortiz Beviá et al 2010) have suggested that the ENSO impacts onto the North Atlantic and Eurasian regions are, in fact, dominated by the stratospheric pathway.
The aim of our paper is to offer observational evidence for these modeling results. We accomplish this by examining, separately, ENSO teleconnections during winters with and without SSWs, and showing that the presence of the stratospheric pathway causes a very significant surface response over the North Atlantic region and Eurasia. Our results suggest that seasonal forecasts could be substantially improved if knowledge of stratospheric conditions were taken into account.
2. Methods
To define ENSO events we use the ERSST.V3B 'Oceanic Niño Index' (ONI) calculated over the Niño-3.4 region (5°N–5°S, 170–120°W) from the National Center for Environmental Prediction (NCEP) Climate Prediction Center (CPC). We define El Niño and La Niña winters following the NCEP/CPC convention: events must surpass the +0.5 °C (for El Niño) and −0.5 °C (for La Niña) threshold for a minimum of five consecutive overlapping seasons (NDJ, DJF, JFM, etc). Our results are not sensitive to changes in this definition, such as using the DJF Nino-3.4 index alone, or using higher thresholds.
To define major, mid-winter, sudden stratospheric warmings we follow Charlton and Polvani (2007) and simply detect reversals of the climatological westerly winds at 10 hPa and 60°N in the boreal winter months (November to March), using NCEP-NCAR Reanalysis from 1958 to 2013 (Kalnay et al 1996). To avoid double counting, we require that winds return to westerly for 20 consecutive days between independent events. Final warmings, in which the zonal winds become easterly and do not return to westerly for at least 10 consecutive days before 30 April, are excluded. The so-called 'central date' of each SSW is defined to be the day when the zonal mean zonal winds at 10 hPa and 60°N first become easterly.
To describe tropospheric conditions, we use daily surface temperature and 500 hPa geopotential height from NCEP-NCAR reanalysis, again over the period 1958–2013. To remove long-term trends and the annual cycle from daily data, we follow the procedure delineated in Gerber et al (2010). We also use the monthly mean North Atlantic Oscillation (NAO) index from the NCEP/CPC, standardized using the January–March mean and standard deviation.
Statistical significance for composites of monthly anomalies (figures 3 and 4) is calculated using the two-tailed Student t-test for the difference in means, and anomalies with p < 0.05 are shaded in all composites. For significance testing in composites of stratospheric events using daily data (figure 2), we sample 60 consecutive days following randomly selected years and dates within the November–March timeframe; the dates must be separated by 60 days. We sample the same number of dates as are observed for SSWs in each phase of ENSO (15 for El Niño, 13 for La Niña), then average each sample and take the difference. We then create a distribution of anomalies for each grid cell by repeating this process 500 times in a Monte Carlo test. Significant anomalies in the SSW composites are then defined for those grid cells exceeding two standard deviations (σ) of the anomaly distribution at that location.
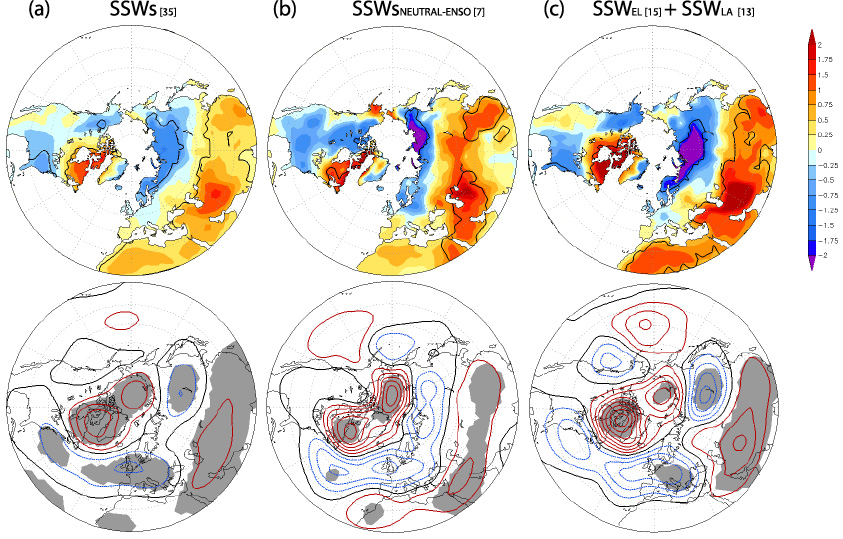
Figure 2. Composite of (top row) surface temperature (K) and (bottom row) 500 hPa geopotential height (gpm; contour interval 10 gpm) anomalies for days 1–60 following the onset of (a) the 35 major mid-winter SSWs in the historical record, (b) the 7 SSWs that occur during ENSO-neutral winters, and (c) the sum of 15 SSWs during El Niño winters and 13 SSWs during La Niña winters. The bold black lines (gray shading) indicate anomalies greater than two sigma relative to distributions generated in Monte Carlo simulations (see the text for details).
Download figure:
Standard image High-resolution image3. Results
To set the stage, we start by recalling the surface impacts that are observed following SSW events. In the period 1958–2013, a total of 35 SSWs are found using the methods detailed above, and their central dates7 are listed in table 1. The composite surface temperature and 500 hPa geopotential height anomalies, averaged over the 60 days following the central date of each SSW, are shown in figure 2(a) (left column, top and bottom panels, respectively).
Table 1. List of 35 central dates of SSWs in El Niño winters,La Niña winters, and ENSO-neutral winters in NCEP-NCAR reanalysis from 1958 to 2013, updated from Butler and Polvani (2011).
| SSWs (El Niño) | SSWs (La Niña) | SSWs (neutral) |
|---|---|---|
| 30 Jan 1958 | 23 Mar 1965 | 16 Jan 1960 |
| 30 Nov 1958 | 17 Jan 1971 | 22 Feb 1979 |
| 08 Dec 1965 | 20 Mar 1971 | 29 Feb 1980 |
| 24 Feb 1966 | 24 Feb 1984 | 04 Dec 1981 |
| 27 Nov 1968 | 02 Jan 1985 | 02 Jan 2002 |
| 13 Mar 1969 | 22 Feb 1989 | 07 Jan 2004 |
| 02 Jan 1970 | 15 Dec 1998 | 07 Jan 2013 |
| 02 Feb 1973 | 25 Feb 1999 | |
| 23 Jan 1987 | 20 Mar 2000 | |
| 08 Dec 1987 | 11 Feb 2001 | |
| 14 Mar 1988 | 21 Jan 2006 | |
| 18 Jan 2003 | 22 Feb 2008 | |
| 24 Feb 2007 | 24 Jan 2009 | |
| 09 Feb 2010 | ||
| 24 Mar 2010 |
The geopotential height anomalies following SSWs closely resemble the negative phase of the NAO (Baldwin and Dunkerton 2001), with positive heights over Greenland and the Arctic, and negative heights over the North Atlantic and extending across Europe; we also note significant positive heights over subtropical Asia. Concomitantly, the temperature patterns following SSWs (figure 2(a), top panel) likewise resemble what is typically seen in a negative NAO phase, with cold anomalies over northern Europe, Asia, and the eastern United States, and warm anomalies over eastern Canada and parts of Greenland, and also over much of China, the Middle East, and North Africa.
It should be clear to the alert reader that although the patterns in figure 2(a) are constructed by compositing the fields 1–60 days after SSWs, it would be naïve to state that these patterns are caused by SSWs. The reason is quite simple: SSWs are much more frequent during El Niño and La Niña winters than during ENSO-neutral winters (Butler and Polvani 2011). In fact, of the 35 SSWs used to construct the left column of figure 2(a), 15 events occur during El Niño and 13 during La Niña winters (see table 1). Therefore, one would have every reason to suspect that the anomalies in figure 2(a) might be due to a sampling of the ENSO signal, and not to SSWs. Obviously, one needs to disentangle SSWs from ENSO, to bring out the unique impacts of a perturbed stratosphere.
We do this in two ways. First, to eliminate any ENSO signal, we simply limit the composite to those SSWs that occur in ENSO-neutral winters. The result is shown in figure 2(b) (middle column): the key point is that both temperature and geopotential height anomalies look qualitatively similar to the composites of all SSWs. In particular, the significant warm anomalies over eastern Canada and the cold anomalies over Eurasia, as well as the high geopotential over the polar cap and low geopotential over the North Atlantic, are clearly present even during ENSO-neutral winters. We conclude that there exists a surface signal of stratospheric origin which has nothing to do with ENSO.
The skeptical reader will perhaps object that only seven SSW events were used to construct figure 2(b) (see the right column of table 1) and therefore may doubt the robustness our conclusion, in spite of the statistically significant response shown in that figure. To alleviate such doubts, we offer a second way of isolating the stratospheric impacts. Noting that the period 1958–2013 contains a comparable number of SSWs during El Niño and La Niña years (15 and 13, respectively), and recalling the relative linearity in the tropospheric ENSO response, one would expect large cancellations to occur if only those SSWs that occur in El Niño and La Niña years are composited (additively). Remarkably enough, no such cancellation occurs.
As shown in figure 2(c), adding opposite ENSO phases actually amplifies the anomalies following SSWs. Both surface temperature and geopotential height anomalies in figure 2(c) look qualitatively similar to those in figure 2(b)—from which all ENSO influence is absent by construction—but have approximately double the amplitude: this indicates that the impacts of SSWs on the troposphere and surface are very similar, irrespective of the ENSO phase. Figure 2(c), therefore, is a clear demonstration of the non-linear aspect of the surface response to ENSO, over the Atlantic and Eurasia, following SSWs. In the bottom panels of figure 2, furthermore, note the conspicuous absence of any PNA-like wave train originating in the tropical pacific and extending to North America: this is yet another confirmation that what is seen in that figure is the impact of greatly perturbed stratospheric conditions. Figure 2(c), therefore, offers clear evidence that a stratospheric pathway exists.
Having established the existence of that pathway, we next document its importance. To do so, we now turn our attention from SSWs to ENSO teleconnections. As summarized in table 2 we find 19 El Niño winters, 18 La Niña winters, and 19 ENSO-neutral winters in the 56 winters of the 1958–2013 record. The non-linear aspect of the stratospheric response to ENSO is also apparent in table 2: the frequency of SSWs in El Niño and La Niña winters is nearly equal (0.79 SSWs per El Niño winter versus 0.72 SSWs per La Niña winter), and far fewer SSWs are found to occur in ENSO-neutral winters (only 0.37 SSWs per ENSO-neutral winter), in agreement with Butler and Polvani (2011). Overall, while SSWs only occur in slightly more than half of all winters, there are more El Niño and La Niña winters with SSWs than without, and fewer ENSO-neutral winters with SSWs than without.
Table 2.
The number of winters that occur from 1958 to 2013 that are classified as El Niño, La Niña, and ENSO-neutral
| # of winters | Frequency of SSWs (# per winter) | #of winters with SSWs | # of winters without SSWs | |
|---|---|---|---|---|
| All years | 56 | 0.63 | 29 | 27 |
| El Niño | 19 | 0.79 | 11 | 8 |
| La Niña | 18 | 0.72 | 11 | 7 |
| Neutral | 19 | 0.37 | 7 | 12 |
Armed with this decomposition, we first recover the canonical 'linear ENSO response', shown in figure 3(a), by simply subtracting the 18 La Niña winters from the 19 El Niño winters in the record (irrespective of the stratospheric state). Note the expected cold United States and warm Canadian surface conditions (top), and the familiar PNA wave trains in the height field (bottom). More interesting yet, note that over Eurasia the ENSO response in figure 3(a) bears a substantial resemblance to the SSW composite in figure 2(a): this suggests that the stratospheric pathway is playing a role in the ENSO response in that region.

Figure 3. Top row: surface temperature (K) and bottom row: 500 hPa geopotential height (gpm; contour interval 10 gpm) anomalies associated with the composite difference of (a) all El Niño winters and all La Niña winters, (b) El Niño and La Niña winters in which at least one SSW occurs, and (c) El Niño and La Niña winters during which no SSWs occur. The black line (gray shading) indicates anomalies with p < 0.05 for a two-tailed Student t-test.
Download figure:
Standard image High-resolution imageTo bring out this role we next consider the same linear ENSO response but only for winters in which one or more SSWs occur, as shown in figure 3(b). Contrasting with figure 3(a) (top), one can clearly see how the cold anomalies over Eurasia are much deeper and cover a wider area when the stratosphere is perturbed. The warm anomalies over Greenland and eastern Canada are also stronger, while the warm anomalies over western North America appear weaker and less significant. The 500 hPa height anomalies in figures 3(a) and (b) (bottom) in general look similar, but one key difference needs to be highlighted: the height anomalies over the Atlantic extend much further into Europe when only winters with a stratospheric pathway are included.
The role of the stratospheric pathway can be brought out even more dramatically by simply omitting its signal. This is presented in figure 3(c), which shows the linear ENSO response but only for winters in which no SSW occurs. When the stratosphere is unperturbed, the cold temperature anomalies over Eurasia nearly disappear (only a narrow strip survives over the northernmost edge of the continent), and the warm anomalies over Greenland and eastern Canada are much weaker. Furthermore, the height anomalies no longer extend over the North Atlantic (contrast the bottom panels of figures 3(b) and (c)), in a manner that is highly reminiscent of what is seen in model experiments in which the stratosphere is unperturbed (Ineson and Scaife 2009), or of linear inverse models with stratospheric feedbacks removed (Newman and Sardeshmukh 2008).
The lesson from figure 3 is this: with the stratospheric pathway suppressed, what we see in figure 3(c) is simply the tropospheric component of the linear ENSO response. It shows the familiar PNA wave train and North American temperature anomalies, but over the North Atlantic and Eurasia it looks very different from the full ENSO response (figure 3(a)).
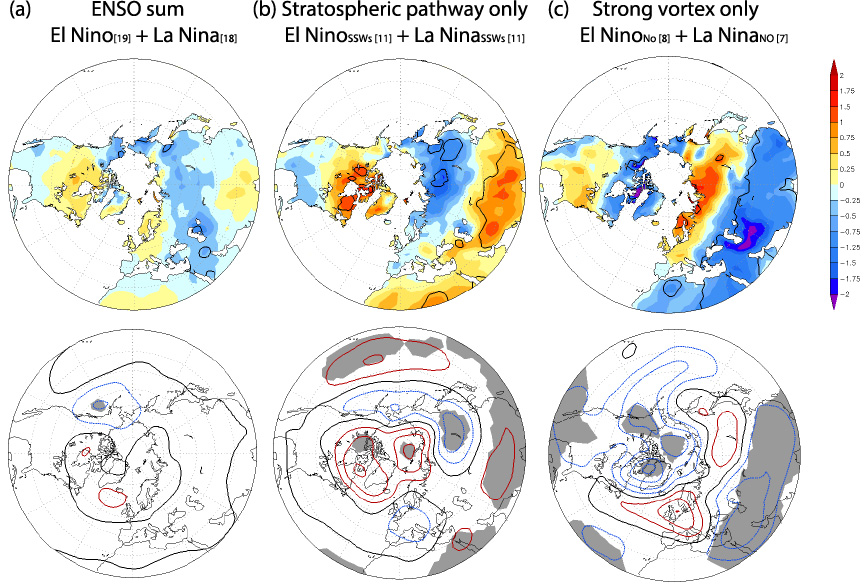
At this point it is natural to ask: why not suppress the tropospheric pathway, so as to clearly isolate the stratospheric pathway? As it happens, this is easily accomplished by taking the sum of El Niño and La Niña winters, rather than the difference. The results are shown in figure 4, and it represents the 'non-linear ENSO response', since any linear behavior is here eliminated by construction. Recall that the stratospheric pathway has the same sign response in El Niño and La Niña (figure 2(c)), whereas the tropospheric pathway has nearly equal and opposite responses during these phases: taking the sum of opposite ENSO phases, therefore, is a simple way to remove the tropospheric pathway and reveal the stratospheric pathway alone. (Similar results can also be obtained by looking at ENSO-neutral winters, with and without SSWs; not shown.)
Figure 4. Top row: surface temperature (K) and bottom row: 500 hPa geopotential height (gpm; contour interval 10 gpm) anomalies associated with the composite sum of (a) all El Niño and La Niña winters, (b) El Niño and La Niña winters in which at least one SSW occurs, and (c) El Niño and La Niña winters during which no SSWs occur. The black line (gray shading) indicates anomalies with p < 0.05 for a two-tailed Student t-test.
Download figure:
Standard image High-resolution image
The non-linear ENSO response in figure 4(a) appears to be largely non-existent. There is weak cooling over Eurasia and weak warming over northern North America, but these anomalies are not statistically significant; the same goes for the height anomalies. This result is in contrast to those of some earlier studies which show significant ENSO non-linearities (Hoerling et al 1997, 2001). Probably, the differences arise because: (a) we use a lower threshold for ENSO events, so the sample size is doubled in our study; (b) whereas the previous studies consider only December–February, we average over November–March, reducing non-linearities due to differences in the timing of ENSO SST anomalies; and (c) whereas the previous studies consider La Niña events mostly prior to 1975, we use ENSO events spread evenly over the observational record, which are less likely to be influenced by Pacific decadal variability (DeWeaver and Nigam 2002).
Now the key question becomes, why does figure 4(a) not show the stratospheric pathway, as one might expect from the logic above? The answer is simple: while roughly 60% of El Niño and La Niña winters (table 2) have SSWs, the other 40% do not. Since ENSO winters with no SSWs often have strong polar vortices, and since the impacts of a strong polar vortex are essentially equal and opposite (in sign) to the impacts of a weak polar vortex (Limpasuvan et al 2005), all we are seeing in figure 4(a) is a large cancellation. To bring out the stratospheric pathway we need to separate the non-linear ENSO response into winters with SSWs and winters without SSWs, as was done in figure 3.
The stratospheric pathway then emerges with great clarity. It is shown in figure 4(b), from the composite of the non-linear ENSO response during winters with SSWs: notice how the anomalies are very similar to those in the SSW composite in figure 2(a), confirming that our method successfully isolates the stratospheric pathway by removing the tropospheric pathway. We also note some differences in the height anomalies: in the 60 days following SSWs (figure 2(a), bottom) the heights resemble the negative NAO pattern and are centered over the North Atlantic and European regions, whereas in figure 4(b) (bottom) the heights are positive over the polar cap and negative over the North Atlantic, but there are also significant height anomalies over the Pacific sector. These are likely a result from precursor patterns of SSWs, which generally involve low height anomalies over the North Pacific and high height anomalies over the central Pacific (Garfinkel et al 2010, Cohen and Jones 2011). We also note that these anomalies, though weaker in magnitude, look very similar to ENSO non-linearities found in previous studies (Hoerling et al 1997, DeWeaver and Nigam 2002), perhaps providing an alternate interpretation for the non-linear ENSO response.
Lastly, in the absence of SSWs, figure 4(c) shows that the anomalies are essentially equal and opposite to those during winters with SSWs. This reflects the downward influence of a strong polar vortex, which is roughly equal and opposite to that of a weak vortex (Baldwin and Dunkerton 2001). Thus, in the full non-linear ENSO composite (figure 4(a)), the resulting weak anomalies are a consequence of both the removal of the tropospheric pathway and the major cancellation between ENSO winters with a stratospheric pathway and those without. However, since ENSO winters with a stratospheric pathway occur more frequently than those without, the overall pattern of anomalies in figure 4(a), though weak, generally resembles those associated with SSWs (figure 4(b)).
We conclude by quantifying the importance of the stratospheric pathway in table 3. Focusing first on the left column we see that, irrespective of SSWs, the surface temperature over Eurasia (30–120°E, 60–75°N) is colder and the NAO index is below normal during El Niño winters. Oppositely signed responses are observed during La Niña. This is the familiar linear ENSO response, graphically illustrated in figure 3(a).
Table 3. Top rows: the NDJFM mean surface temperature anomaly (K) for northern Eurasia (30–120°E, 60–75°N). Bottom rows: the standardized JFM mean North Atlantic Oscillation index for all winters, El Niño winters, La Niña winters, and ENSO-neutral winters.
| All winters | Winters with SSWs | Winters without SSWs | |
|---|---|---|---|
| NDJFM Eurasian surface temperature anomaly (K) | |||
| All years | ∼0 | −0.5 | + 0.6 |
| El Niño | −0.4 | −1.1 | + 0.5 |
| La Niña | + 0.3 | + 0.2 | + 0.5 |
| Neutral | + 0.1 | −0.7 | + 0.6 |
| JFM NAO index | |||
| All years | 0.00 | −0.17 | + 0.19 |
| El Niño | −0.26 | −0.44 | −0.01 |
| La Niña | + 0.17 | + 0.12 | + 0.24 |
| Neutral | + 0.10 | −0.22 | + 0.29 |
However, the left column in table 3 does not tell the whole story. If we consider separately winters with SSWs (middle column) and without SSWs (right column) we see that the surface climate response varies dramatically depending on whether the stratospheric pathway is present or not. Irrespective of the ENSO phase, Eurasian temperatures are colder and the NAO index is more negative during winters with SSWs compared to winters without SSWs. And the differences between winters with and without SSWs are in general larger than the differences between El Niño and La Niña winters. We note in passing that the surface climate during La Niña varies less than in the other ENSO phases: the stratosphere does not appear to impact the surface climate as strongly during La Niña winters.
The key message here is that while the ENSO phase is a robust climate predictor for much of North America, the state of the stratosphere is a greater predictor for the rest of the Northern Hemisphere. In parts of Eurasia (figures 3(b), (c)), this could mean the difference between a wintertime average of −1.5 °C below normal during a winter with SSWs and a wintertime average of nearly +2 °C above normal during a winter without SSWs. And over eastern Canada and Greenland, it could determine the extent and magnitude of ice loss or growth.
4. Summary and discussion
We have demonstrated that the presence—or absence—of the stratospheric pathway during ENSO winters makes a very significant difference in the surface climate response over large portions of the Arctic, North Atlantic and Eurasia. Because SSWs occur more frequently during ENSO winters, the warm anomalies over Greenland and eastern Canada and the cold anomalies over Eurasia, as well as a negative NAO-like pattern, could erroneously be associated with the tropospheric pathways of El Niño (and vice versa for La Niña). But, as we have shown, these anomalies only arise in those winters in which the stratosphere is severely perturbed; when no SSW occurs, the temperature and height anomalies over these regions are quite different.
We acknowledge that the sample size in our study is relative small (only 56 winters and only 35 SSWs), and that we have not accounted for other possible factors. For instance, the Madden–Julian Oscillation has been found to have impacts on Northern Hemisphere extratropical climate and the stratosphere itself (Garfinkel et al 2012b, Riddle et al 2013). The Quasi-biennial Oscillation (Baldwin et al 2001), Eurasian snow cover extent (Cohen et al 2007), and volcanic eruptions (Brönnimann et al 2007) also influence surface climate during boreal winter and could be affecting our analysis. Nonetheless, the strong stratospheric signature documented above is statistically significant in our analysis. And, more importantly, the importance of the stratospheric pathway has already been suggested by a number of modeling studies (e.g. Ineson and Scaife 2009): hence our findings are, in some sense, observational confirmation of earlier modeling work.
One might also wonder whether our strategy of focusing on SSWs for identifying the stratospheric pathway's influence over the North Atlantic and Eurasia is the best way of proceeding, given that SSWs are extreme events, and thus statistically more difficult to capture. An alternative way of proceeding would use, e.g. polar cap geopotential height anomalies, as a proxy for an anomalously strong or weak polar vortex, as was done in Thompson et al (2002). The advantage of that method is that more events, albeit of smaller amplitude, can be included, possibly resulting in better statistics. We have, in fact, carried out that calculation, and the results are very close to the ones presented here. For the interested reader, we include three figures describing those results in the supplementary material (available at stacks.iop.org/ERL/9/024014/mmedia).
Before closing we also wish to clarify that the causality link between ENSO and the stratospheric pathway is not completely understood. The simple fact that SSWs are known to occur during ENSO-neutral winters is clear evidence that ENSO is not the only cause of SSWs (their precise cause remains an open research question). It is thus not inconceivable that what we have been interpreting as the stratospheric ENSO pathway may be a totally unrelated mode of variability which has accidentally overlapped with ENSO in the last few decades: this, however, is highly unlikely. From table 1 one can see that the frequency of SSWs nearly doubles during ENSO years compared to ENSO-neutral years. The observational record is short, unfortunately, but a doubling in frequency seems to us a large enough anomaly to justify our interpretation. Nonetheless, to the main conclusion of this study, we add the caveat that the quantitative estimate of the stratospheric ENSO pathway reported above may, in reality, represent only an upper bound, since some fraction of the SSWs occurring during ENSO winters may be unrelated to ENSO itself.
Lastly, we recall that stratospheric anomalies associated with SSWs do not always propagate all the way down to the troposphere, and this adds to the difficulty in incorporating such information into actual forecasts. Nonetheless, since seasonal prediction is currently based largely on the state of ENSO, it is important to emphasize that stratospheric variability can both modulate ENSO impacts during active ENSO winters, and exert unique influences on surface climate during ENSO-neutral winters when predictive skill may be lacking. A recent modeling study by Sigmond et al (2013), in which dynamical forecast simulations were initialized during SSWs while sea surface temperatures were relaxed to climatology, showed surface impacts similar to those shown above as a consequence of SSWs during ENSO-neutral winters.
Acknowledgments
LMP wishes to thank Matthew Newman for a most enlightening conversation at Café Sole, which stimulated the present line of research. LMP was supported, in part, by a grant from the US National Science Foundation to Columbia University. NCAR is sponsored by the National Science Foundation.
Footnotes
- 7
We note two small differences between these dates and those given in table 1 of Butler and Polvani (2011). First, calculations for SSW central dates using the current version of NCEP-NCAR reanalysis no longer detect a SSW in January 1968, which also appeared in the table of Charlton and Polvani (2007); this is likely due to slight differences in versions of the data. Second, an additional SSW in March 2010 was missed in Butler and Polvani (2011) due to an error, but technically meets the Charlton and Polvani (2007) criteria; we include it here for completeness. The results herein do not depend on whether this event is included or not.
- a
The 19 El Niño winters are 1957/58, 1958/59, 1963/64, 1965/66, 1968/69, 1969/70, 1972/73, 1976/77, 1977/78, 1982/83, 1986/87, 1987/88, 1991/92, 1994/95, 1997/98, 2002/03, 2004/05, 2006/07, 2009/10. The 18 La Niña winters are 1964/65, 1970/71, 1971/72, 1973/74, 1974/75, 1975/76, 1983/84, 1984/85, 1988/89, 1995/96, 1998/99, 1999/00, 2000/01, 2005/06, 2007/08, 2008/09, 2010/11, and 2011/12.