
Abstract
Livestock is poorly represented in N budgets for the African continent although some studies have examined livestock-related N flows at different levels. Livestock plays an important role in N cycling and therefore on N budgets including livestock-related flows. This study reviews the literature on N budgets for Africa to identify factors contributing to uncertainties. Livestock densities are usually modelled because of the lack of observational spatial data. Even though feed availability and quality varies across seasons, most studies use constant livestock excretion rates, and excreta are usually assumed to be uniformly distributed onto the land. Major uncertainties originate in the fraction of manure managed, and emission factors which may not reflect the situation of Africa. N budgets use coarse assumptions on production, availability, and use of crop residues as livestock feed. No flows between croplands–livestock and rangelands reflect the lack of data. Joint efforts are needed for spatial data collection of livestock data, crowdsourcing appears to be a promising option. The focus of the assessment of N budgets must go beyond croplands to include livestock and crop–livestock flows. We propose a nested systems definition of livestock systems to link local, regional level, and continental level and to increase the usefulness of point measurements of N losses. Scientists working at all levels should generate data to calibrate process-based models. Measurements in the field should not only concentrate on greenhouse gas emissions, but need to include crop and livestock production measurements, soil stock changes and other N loss pathways such as leaching, run-off and volatilization to assess management practices and trade-offs. Compared to the research done in other continents on N flows in livestock systems, there are few data for Africa, and therefore concerted effort will be needed to generate sufficient data for modelling.
Export citation and abstract BibTeX RIS

Content from this work may be used under the terms of the Creative Commons Attribution 3.0 licence. Any further distribution of this work must maintain attribution to the author(s) and the title of the work, journal citation and DOI.
1. Introduction
Nitrogen (N) budgets are calculated at different levels from fields, to farm, regions, countries and continents. Methodologies to estimate these budgets improved in the last decades to include processes poorly understood as experimental data became available. Assessments on N budgets for Africa suggest that soils are depleted of N at rates representing a serious threat to productivity and food security (Sanchez 2002). Nitrogen budgets are still used to assess nutrient use efficiency of practices to increase food production.
In African farming, the production of crops is directly and indirectly related to livestock production. Direct relationship arises from the need for manure to sustain crop yields (Vanlauwe and Giller 2006). Indirect relationship arises from the competition for biomass to feed growing livestock populations or to restore degraded agricultural soils (Rufino et al 2011). This is different in the industrialized world, where livestock is mostly separated physically from the places where feeds are produced (Naylor et al 2005). Given the important role of livestock in N cycling, budgets at different levels have to include livestock-related flows (Bouwman et al 2005, Rufino et al 2006). This study reviews the literature on N budgets for African farming systems paying special attention to assumptions used to describe livestock systems. We analyse methods, discuss the reliability of the estimates, and how these can be used to assess N budgets at different levels. The aim of the study was to identify knowledge gaps on the estimation of livestock-related budgets, and to suggest improvements to N budgeting to increase its usefulness.
2. Models to estimate N budgets
We organized models according to the unit of analysis used in the applications from fields and individual animals, to farms, village-community-landscape, region, continent, and the world (table 1).
Table 1. Nitrogen budgets studies at different levels and how they have represented livestock and livestock systems. The summary of N budgets studies across scales includes a short description on how livestock and livestock systems were described.
| Scale or level | Purpose | Livestock included | Country | Reference |
|---|---|---|---|---|
| Plant/field/individuals | Quantify nutrient flows of selected plots to identify strategies for increasing nutrient use efficiency | Static model included livestock feeds and manure. N losses estimated | Tanzania | Baijukya and De Steenhuijsen Piters (1998) |
| Examine nutrient flows at small spatial scale | Managed nutrient flows estimated through measurements. Losses estimated through transfer functions | Ethiopia | Elias et al (1998) | |
| Formulate tentative recommendations for application of manure in different parts of farmers' fields. | Measurement of N leaching following corralling of sheep and cattle. N leaching averaged 91 kg N ha−1 for manure applications of 9–10 t manure ha−1. | Niger | Brouwer and Powell (1998) | |
| Study the effect of grazing management on nutrient intake and excretion | Measurement of nutrient intake and excretion of cattle | Niger | Ayantunde et al (2001) | |
| Explore the role of livestock in managing nutrient cycling in crop–livestock farming systems | Measurement of nutrient intake and excretion of cattle | Kenya | Delve et al (2001) | |
| Study the role of micro and macro-organisms in the decomposition of manure during the rainy season | Measurements of manure decomposition for cattle and small ruminants manure | Niger | Esse et al (2001) | |
| Study the effect of cattle diets and manure management on nutrient recovery | Measurements of cattle intake, excretion, and nutrient losses during storage of manure | Kenya | Lekasi et al (2001) | |
| Establish fertilizer rates that minimize leaching | Measurements of N leaching from fields after fertilizer and manure applications. Leaching losses were 12–19 kg ha−1 for maize plots, increased to 14–48 kg ha−1 with fertilization. Manure applications caused leaching losses of 24–40% in the first season with large rainfall events, and of 3–11% of applied N up to the third season. | Zimbabwe | Nyamangara et al (2003) | |
| Estimate N leaching and nitrous oxide emissions from plots fallowed with legumes | Measurement of soil emissions on plots fallowed with fodder legumes | Zimbabwe | Chikowo et al (2004) | |
| Analyse N cycling efficiency through manure collection and storage within smallholder systems | Estimation of losses of C and N from cattle manure during storage. Largest losses occurred within the first 60 days: the smallest losses were observed for heaps under roof and covered with a polyethylene film, and the largest in uncovered heaps kept on the open air. | Uganda | Rufino et al (2007) | |
| Estimate nitrous oxide emissions for croplands managed with organic manure and fertilizers | Measurement of emission from cropland fertilized and grazed during dry season | Mali | Dick et al (2008) | |
| Quantify C and nutrient losses from manure stored under traditional smallholder practices (manure stored in heaps and in pits) | Estimation of losses of nutrients during storage of manure under farmers practices | Kenya | Tittonell et al (2009a) | |
| Estimate nutrient losses through runoff under different land management | Estimation of nutrient losses included grazing land and exclosures | Ethiopia | Girmay et al (2009) | |
| Study residual effect of organic fertilizers on N emissions | Included soils fertilized with cattle and goat manures | Mali | Sanchez-Martin et al (2010) | |
| Quantify gaseous emissions of C and N from manure storage in urban crop–livestock systems | Included manure from cattle and small ruminants | Niger | Predotova et al (2010) | |
| Farm | Explore impact of agroforestry on soil nutrient balances | Livestock intake, excretion, and manure managed, and losses are included using fixed coefficients. Losses through manure management not estimated. | Kenya | Shepherd et al (1996) |
| Study sustainability of farm systems | Dynamic model included feed and manure flows between crop and livestock compartments. Losses during manure composting calculated using constant factors. The livestock module produces milk, offspring, and excreta, partitioned between faeces and urine. Manure managed and inflow of feeds calculated based on time spent grazing on- and off-farm. N losses calculated using transfer functions similarly to Stoorvogel and Smaling (1990). | Kenya | Shepherd and Soule (1998) | |
| Assess differences in soil fertility between farm types and changes over time | Partial nutrient balance included flows of feeds and manures, no losses included | Mali | Defoer et al (1998) | |
| Study biophysical sustainability, and the farm management that determines its levels | Measured manure application and its quality, and quantified manure deposition during grazing | Nigeria | Harris (1998) | |
| Estimate impact of alternative agricultural practices on nutrient balances | Full nutrient balance, using crop simulation model to estimate soil N losses. Fixed coefficients for livestock related N losses. | Uganda | Wortmann and Kaizzi (1998) | |
| Study determinants of the nutrient balances | Estimation of N flows for livestock based on survey data | Uganda | Nkonya et al (2005) | |
| Estimate nutrient balances and their impact on productivity | Partial nutrient balance included flows of feeds and manures, no losses included | Uganda | Esilaba et al (2005) | |
| Assess variability in soil fertility, management of nutrient resources and crop allocation patterns | Static model included feeds and manure flows | Zimbabwe | (Zingore et al 2007 2011) | |
| Evaluate biophysical performance of crop–livestock farms in terms of key flows determining resource use efficiency at farm scale | Dynamic model capture interactions between crops and livestock, including N losses. | Kenya | Tittonell et al (2009b) | |
| Village/community/landscape | Analyse transfer of nutrients at community scale and opportunities to improve resource management | Balances in cropland and grazing land, included measured flows of feeds and manure across seasons. Areas manured estimated. No losses | Cameroon | Dugue (1998) |
| Assess nutrient budgets related to land use and fertility management | Flows estimated using livestock itineraries and measured excretion rates. These authors estimated nutrient flows and spatial distribution of manure due to livestock management, measuring excretion rates in different land use units, but no nutrient losses. | Senegal | (Manlay et al 2002, 2004) | |
| Describe manuring practices and quantify the nutrient transfers from pastures and fallow lands to cropland | Measured manure deposition through corralling, and estimated areas manured. Estimated that farmers were manuring not more than 10% of the cropland area using corralling with a N transfer from fallow land (4 kg N ha−1) to cropland larger than that of pastures (0.2–1.2 kg N ha−1) to cropland. | Niger | Achard and Banoin (2003) | |
| Measure nutrient turnover rates due to livestock management, and nutrient redistribution in the landscape | Estimated manure deposition for livestock and wildlife. Measured leaching from manure deposited in rangelands | Kenya | Augustine (2003) | |
| Analyse differential impacts of input use inequality across groups of social actors in a landscape | Resource use maps allow depicting flows within and between households spatially. Nutrient losses estimated following Stoorvogel and Smaling (1990). | Mali | Ramisch (2005) | |
| Analyse the seasonal and temporal variation of manure deposition across the landscape | Tracked livestock grazing itineraries, and its grazing and excretion behaviour to show heterogeneity in the distribution of nutrients in the landscape due to feeding, herding and corralling. Across sites, livestock consumed on average 16–20 kg N ha−1, and returned to grazing land around 20–30% of the intake as faecal N. | Niger | (Schlecht et al 2004, 2006) | |
| Compare the influence of domestic and wild herbivores upon soil nutrient of a moist savanna | Estimated atmospheric deposition, N fixation, manure deposition, and losses through fire | Tanzania | Cech et al (2010) | |
| Assess the effect of village-level interactions on C and nutrient flows, and to explore their impact on the long-term productivity of different farm types | Dynamic model of crop, livestock and grasslands, include interactions and estimated losses of N. | Zimbabwe | Rufino et al (2011) | |
| Region | Reports NPK balances for a well inventoried area | Uses same assumptions as Stoorvogel and Smaling (1990) | Kenya | Smaling et al (1993) |
| Describe soil fertility decline | Input/output analysis for cropland. Livestock only provides manure. | Southern Mali | Van der Pol and Traore (1993) | |
| Country | Evaluate sustainability of the land use system | Livestock only included as consumer of crop residues and contributor of manure | Mozambique | Folmer et al (1998) |
| Assess nutrient depletion and regional differences | Livestock population data were used together with constant excretion rates to estimate manure input to cropland. | Ethiopia | Haileslassie et al (2005) | |
| Revisit the methodology developed by Stoorvogel and Smaling (1990). | Improved the estimation of N losses of original model updating the land use maps, and the transfer functions to calculate deposition, sedimentation, leaching, and erosion. Data spatially explicit with a resolution of 1 km, and results were aggregated and presented using a resolution of 20 km. Livestock density maps (Wint et al 2000) and fixed excretion rates used to estimate manure excretion. Rangelands were included only to capture the transfer of nutrients to croplands. The amount of manure transferred depended on population density and was calculated using an aggregation factor. Manure was subjected to losses: 15% lost to non-agricultural land or allocated to other purposes, and 15–40% lost during storage for different sort of management. Soil emissions were calculated using a statistical model (Bouwman et al 2002a,b). | Burkina Faso | Lesschen et al (2007) | |
| Continent | Describes a method for calculating nutrient balances for the arable land of 38 SS African countries | Include manure applied to fields, direct deposition, grazing of crop residues. The method included constant rates for manure application for each land use, a constant fraction of crop residues to be grazed, and constant excretion rates depending on estimated intake. N losses from urine ignored, whereas losses through erosion, denitrification and leaching calculated using transfer functions based on soil parameters and rainfall. Volatilization of NH3 from soils was considered negligible. | Africa | Stoorvogel et al (1993) |
| Assess the effect of agriculture on nutrient mining and land degradation | It used geo-referenced databases, included time-series of crop production, areas, mineral and organic fertilizer use and information on soils, land cover, climate and management data. Livestock populations (FAOSTAS) and manure application rates were used to estimate organic inputs onto croplands. Nutrient losses through erosion, leaching and volatilization were based on the approaches given by Stoorvogel and Smaling (1990). They produced maps and tables of average nutrient depletion at country level for the whole Africa. | Africa | Henao and Baanante (1999) | |
| Produce nutrient audits (depletion/enrichment) | Average livestock types, fixed excretion rates, losses included. Livestock excretion rates were assumed to be proportional to slaughtered weight A fixed amount of crop residues returned to the soils, and the rest fed to livestock. Fraction of manure recycled in agriculture was estimated, sources not indicated. The model included livestock populations, animal feeds, and animal products derived from FAOSTAT. It is not clear how the authors calculated nutrient losses and whether they included rangeland in their analysis They produced tables, with rates of depletion at national level. Nutrient losses estimated were relatively small compared to other estimates because N losses between excretion and application to the land were assumed to be 20–25% and only included erosion and leaching. | Sheldrick et al (2002), Sheldrick and Lingard (2004) | ||
| Global | Describe temporal and spatial changes in the sources and losses of N and P at regional scale | Livestock production derived from FAOSTATS aggregated to 24 regions to calculate current livestock populations on the basis of total production, and average production per head. Two livestock systems, constant excretion rates, diets according to requirements, statistical models to estimate emissions. Mass flows between croplands and grasslands are driven by supply, demand and trade of agricultural products using allocation rules. | World | Bouwman et al (2005) |
| Assess contribution of livestock to global emissions | FAOSTAT, GHG emissions for ten regions, and three livestock systems. Manure applied to soils calculated assuming nutrient losses, though the fraction lost is not indicated. Nitrous oxide emissions from applied fertilizers calculated with a constant emission factor. Ammonia emissions from fertilizer use were taken from Bouwman et al (1997). Constant factors used for emissions and volatilization from manure during grazing. | Steinfeld et al (2006) | ||
| Evaluate the environmental consequences of global fertilizer use | FAOSTAT, average livestock types, fixed excretion rates, no nutrient losses included. The authors estimated the global distribution of fertilizer applications and excreted manure using the GLIS (Wint and Robinson, 2007), with excretion rates taken from OECD estimates (OECD, 2008). Actual rates not presented. The study did not include estimates on N losses, justified on the difficulty to obtain data on manure management. | Potter et al (2010) | ||
| Assess global N flows in cropland to analyse N scarcity | FAOSTAT, livestock only considered to supply manure to croplands. Excretion rates taken from Sheldrick et al (2003) and manure partitioning coefficients from IMAGE (Bouwman et al 2006). Manure allocated using country data. Fraction of crop residues fed to livestock varied across countries with default values for developed and developing countries. Losses from manure calculated using constant coefficients from Bouwman et al (1997). Nitrous oxide emissions from soils calculated using the models of Stehfest and Bouwman (2006) and Bouwman et al (2002). | Liu et al (2010) |
2.1. Large scale models
These models aggregate data from soil or landscape units using a set of rules to calculate N budgets for countries, regions, continents, and the world. Stoorvogel and Smaling (1990) developed a method to calculate nutrient (NPK) budgets for croplands, including livestock-related flows of manure applied to fields and excretion during grazing of crop residues. Budgets were calculated for systems aggregated into land and water classes. Since Stoorvogel and Smaling (1990) others groups have implemented modifications to the method to make it applicable at other levels (Sheldrick et al 2002, 2003, Sheldrick and Lingard 2004), or to make the calculations spatially-explicit (Henao and Baanante 1999). Lesschen et al (2007) used process-based simulation models to estimate some of the flows; Liu et al (2010) used finer spatial resolution, and Potter et al (2010) used refined land cover layers.
Bouwman et al (2005) developed the livestock module of the land use model IMAGE (Bouwman et al 2006), which calculates N budgets for two livestock systems. IMAGE has been used for scenarios of change such as the Millennium Ecosystem Assessment (2005), and the International Assessment of Agricultural Knowledge, Science and Technology for Development (IAASTD) (McIntyre et al 2009), for which its resolution and main assumptions seem appropriate. However, for analyses of nutrient management in Africa, resolution appears too coarse, and the systems definition (pastoral, and mixed-landless) does not cover the diversity of livestock systems found in Africa. The FAO livestock's long shadow (Steinfeld et al 2006) assessed the role of livestock in the global N cycle estimating N2O emissions at sub-continental level for grazing, mixed and industrial systems. Steinfeld et al (2006) followed IPCC (1997) to estimate emissions from manure management using excretion rates by livestock type, fraction of manure managed, and emission factors for each manure management system. The authors produced tables and maps depicting emissions of N2O and N deposition following volatilization. Unfortunately, they did not present the data used for the calculations, neither do they refer to the sources used. Liu et al (2010) estimated global N flows for croplands using coarse assumptions on the management of feeds and manure and their spatial allocation, which may have influenced largely the N budgets calculated and conclusions drawn for Africa.
More than two decades after Stoorvogel and Smaling (1990), there has been progress towards reducing the uncertainty of large scale N budgets. However, the inclusion of livestock systems appears still rudimentary. Major short comes are: (a) livestock densities are usually modelled based on environmental factors because of the lack of recent livestock censuses, (b) land cover maps lack the resolution needed to capture the diversity observed in Africa, (c) constant factors to estimate livestock excretion rates are used, which also lack spatial distribution, (d) livestock excreta are usually assumed to be uniformly distributed onto the land, and (e) nutrient losses and emission factors are often guessed using estimates from other continents and climates. Moreover, all studies use coarse assumptions on production, availability, and the use of crop residues in livestock systems and mostly feedbacks between croplands and grazing lands are not considered, with some assessments assuming that rangelands are endless nutrient sources. All these pitfalls reflect not only that there are few data for livestock systems for Africa, but also that systems thinking is needed to address complexity and to reduce uncertainty.
2.2. Studies at plot, individual, farm and community level
We evaluated studies including livestock in N budgets at plot, farm and village and community level (table 1). In the 90s, N budgets for croplands focused on plot and farm level (e.g. Baijukya and De Steenhuijsen Piters 1998, Defoer et al 1998, Wortmann and Kaizzi 1998), with some extrapolations to regional or landscape level (e.g. Van der Pol and Traore 1993, Folmer et al 1998). These studies included livestock as consumer of crop residues and/or as a producer of manure for cropland. Some studies estimated N losses through erosion, leaching, and volatilization with field measurements (e.g. Baijukya and De Steenhuijsen Piters 1998), or with simulation models (e.g. Wortmann and Kaizzi 1998), concluding that soil mining through cropping must be compensated with fertilizers.
Partial N budgets estimated using information collected through farm surveys are common in the literature (e.g. Defoer et al 1998, Esilaba et al 2005). These studies do not include estimates of N losses, but are useful to compare farms and management practices. Livestock-related flows usually include on-farm and off-farm feeds, and manure production as reported by farmers (e.g. Wortmann and Kaizzi 1998, Elias et al 1998, Nkonya et al 2005), where losses are sometimes estimated using the transfer functions of Stoorvogel and Smaling (1990). Shepherd et al (1996) built a static model to estimate nutrient balances at farm level. The authors recognized that estimated nutrient losses were uncertain, and that the missing feedbacks between farm components limited the evaluation of the impact of alternative practices. Later on, Shepherd and Soule (1998) developed a simulation model to include biophysical and economic flows between farm components.
Mohamed Saleem (1998) discusses the potential contribution of livestock management to balance N in different livestock system. Some other studies quantified in more detail on crop–livestock interactions. For example, Dugue (1998) studied livestock-related nutrient transfers at community level in Northern Cameroon. The analyses included temporal characterization of manuring in cropland and grazing land, with records of livestock population, and intake of crop residues but no losses from manure management. Harris (1998) quantified N balances following Stoorvogel and Smaling (1990) measuring manure application rates and manure quality, and quantified excretion during grazing. Ramisch (2005) studied nutrient flows at household and community levels in Southern Mali using resource flow maps, which allowed householders to describe spatially management strategies.
The studies by Achard and Banoin (2003), Schlecht et al (2004, 2006), and of Manlay et al (2002, 2004) in West Africa showed that only 10–20% of the excreta can be used for cropping, manure which tends to concentrate in relatively small areas of cropland usually owned by the wealthiest communities members. This has also been shown in the work of Tittonell et al (2005, 2009b), and of Rufino et al (2011), where the potential for using manures to support crop production was explored. These studies concluded that livestock can play a role in increasing crop yields, but remains insufficient if manures are not combined with inorganic fertilizers and biological N2 fixation. Mapping landscapes, livestock grazing itineraries and excretion behaviour in livestock systems is time consuming and expensive, but crucial to understand nutrient flows, determine hot-spots for emissions, and to improve nutrient management. Manlay et al (2002) and Schlecht et al (2004) showed that livestock management creates areas of high concentration of nutrients, which are not efficiently used to produce crops and might contribute largely to nitrogen losses.
3. Measurements of N flows in livestock systems
At field level some flows have been measured or estimated in different systems, including N leaching (e.g. Chikowo et al 2004, Nyamangara et al 2003), N2O emissions (Chikowo et al 2004, Baggs et al 2006, Dick et al 2008, Predotova et al 2010), NH3 volatilization (Murwira 1995), N deposition (Augustine 2003, Cech et al 2010), and N in runoff (Girmay et al 2009, Descheemaeker et al 2006). Few studies measured the effect of diet on N excretion (Ayantunde et al 2001, Delve et al 2001, Lekasi et al 2006, Schlecht et al 2007). Unfortunately, none of these studies measured all the flows in the same system, and for a number of years. We discuss here studies that measured these flows.
3.1. N leaching and losses through runoff
Brouwer and Powell (1998) measured N leaching in micro plots following corralling in Niger. These measurements showed the heterogeneity of soil fertility and how this could be managed with livestock density of the corralling practices. Nyamangara et al (2003) measured in Zimbabwe N leaching losses for maize plots that increased largely when manure or fertilizers were applied. Turner et al (2005) showed that grazing management affects largely feed intake and excretion. Research in Kenyan savannas indicated that corraling increases largely soil organic matter, an effect that persists more than 30 years after corrals were abandoned (Augustine 2003). The large concentrations of N in surface soil resulted in 5–10 times larger N leaching rates in abandoned corrals than in adjacent soils. Losses of N through surface run-off are directly related to the management of the land. In Ethiopia, Girmay et al (2009) estimated losses larger than 30 kg of N ha−1 yr−1 for cultivated land, 8–10 kg N ha−1 for grazing land, and less than 1 kg N ha−1 for exclosures or plantations.
3.2. NH3 volatilization and N2O emissions
Few studies have quantified NH3 and N2O emissions in livestock systems. Murwira (1995) measured NH3 losses from manure which did not exceed 4% of total N for a 30 day incubation period. Nzuma and Murwira (2000) found that addition of straw to faeces reduced ammonia losses by up to 85%, and by 50% when added to combined faeces and urine. Few studies have estimated N2O emissions from manure or manured soils. In Zimbabwe, N2O emissions from sandy soils ranged between 0.1 and 0.3 kg N ha−1 depending on the organic fertilizer added, while N leaching ranged between 29 and 40 kg N ha−1 (Chikowo et al 2004). Adding manure to maize resulted in N2O emissions ranging from 0.06 to 0.4 kg N ha−1 (Mapanda et al 2011). In Mali, experiments showed that applications of manure and urea depressed N2O emissions and resulted in lower NH3 concentrations in the soils than in the crops that received only urea. Manure applications alone had no effect on the N2O emissions (Dick et al 2008). The onset of rains caused an increase (45–80%) in N2O emissions, whereas tillage increased N2O emissions by 34–86%.
3.3. N losses during manure storage
Process and materials added determine the quantity and quality of the final compost and the crop response to the manure N (Delve et al 2001). Manure decomposition is affected by macro-organism's activity. In Niger, Esse et al (2001) estimated that termites were responsible for up to 75% manure loss within ten weeks of exposure onto the soil. While it is possible to collect nearly all of the excreta, in practice the efficiency of collection of excreta N is much lower. In a study in Kenya manure stored in a covered concrete storage, lost up to 40% of the N before composting (Lekasi et al 2001). Manure is commonly left in corrals for many weeks before collection, and losses of urinary-N and labile faeces N through leaching and volatilization are usually very large. During 150 days storage of manure in humid tropical central Uganda 20–50% of the initial N was lost (Rufino et al 2007). Experiments in Kenya showed that pit storage conserved 20% more carbon than heap storage during a 180 days period. However, heaps conserved more N and K than pits (Tittonell et al 2009a). Predotova et al (2010) in Niger showed that roofing manure heaps had no effect on N2O emissions, and reduced NH3 losses only during the dry season. Practices that favour C conservation in manures can be detrimental for N losses (Tittonell et al 2009a), and justify the measurement of the main pathways for nutrient losses for different systems. Measurements of N flows in fields, rangelands and livestock facilities are needed to assess nutrient use efficiency for different management practices.
4. Scaling of N budgets
N budgets calculated for African farming systems do not include explicitly flows between livestock, croplands and grazing lands. Budgets at region, country and continental level often use estimates from different continents, which reflects data scarcity for livestock in Africa, and agreement on what livestock systems represent. Isolated experimental research to estimate flows is difficult to extrapolate to other systems or regions. Process-based modelling can be useful to calculate N budgets, when the processes controlling the flows are understood and models are parameterized for a range of systems.
Biogeochemical models such as DNDC (Li et al 1992a, 1992b), DAYCENT (Parton et al 1996, 1998), ECOSYS (Grant 2001), and WNMM (Li et al 2005) can be coupled with GIS to initialize and drive models if climate, soil and management data are available (Chen et al 2008). Regression models and environmental variables are often used for scaling nutrient flows to landscape, regional and global levels. Scaling point measurements to field level may introduce estimation bias. The risk of scaling results obtained at field level using regression models and a limited number of environmental variables is that of exceeding the validity of the models such as that of Stehfest and Bouwman (2006). A number of challenges remains: (i) the environmental factors driving microbiological processes involved in the N cycle and N losses have a high spatio-temporal variability and are not well understood, (ii) experimental data needed for parameterization of models for a wide range of conditions is missing, (iii) experimental data when complete (i.e. measure several flows and environmental variables) can often not be used to extrapolate to higher levels because they do not represent the broader agricultural systems. Experimental datasets miss thus either spatial or temporal resolution or both. The failure to represent systems results is a limitation of the models to link N budgets to management practices.
Global and regional N budgets estimated with models are useful to identify hot spots—systems where inputs exceed largely outputs suggesting a risk for environmental pollution (Seitzinger et al 2005). However, the result of broad-brush studies must be interpreted with caution: research efforts are needed to downscale global and regional explorative studies to local conditions. Surpluses expressed in tonnes of N per square kilometre for a given system must be related to farm type x having livestock species y, and management practices z. There is large uncertainty associated to farm, regional, and global estimates of nutrient flows. At farm level, Oenema et al (2003) estimated that denitrification and leaching losses are the largest uncertainties in N budgets. De Ridder et al (2004) concluded that negative farm budgets are often overestimated and meaningless because they hide spatial heterogeneity, and neglect or include poorly estimated lateral flows due to run-off and sedimentation. At the landscape level, Nol et al (2010) showed that the uncertainty in the estimations of N2O emissions depended mainly on the uncertainty in nutrient inputs and their spatial variability. At global level, Beusen et al (2008) found that N excretion and NH3 volatilization rates caused most uncertainty in NH3 losses estimated with IMAGE.
5. Reducing uncertainties in N budgets
We list here the most uncertain assumptions in N budgets for livestock systems:
5.1. Estimation of livestock populations and their spatial distribution
Livestock populations at country levels are collected by FAO. This data is disaggregated using various procedures (Kruska et al 2003, Robinson et al 2011). The gridded livestock of the world (GLIS) (Wint and Robinson 2007) uses environmental variables to spatially distribute national data. The authors of GLIS recognized that the main sources of uncertainty are the variability in spatial and temporal resolution of the data used, and therefore generated recently an improved database using sub-national data (Robinson et al 2014). Household surveys provide livestock numbers at household level, so the uncertainty around these numbers is usually small. Scaling household livestock numbers to community or regional levels is problematic without a farm typology and measures of variability among types (Tittonell et al 2010). The work of Cecchi et al (2010) using livelihood data collected by non-governmental organizations to define livestock production systems is a great step towards making spatial data useful for research. More detail could be added by splitting households into groups including the use of natural resources, and connecting spatially-explicit livestock populations to the land using process-based modelling.
5.2. Spatial and temporal variability of N flows
Nutrient budgets are snap-shots, and do not account for temporal variability driven by grazing management (Scoones and Toolmin 1998, Augustine 2003, Turner et al 2005, Schlecht et al 2006). Although livestock graze extensive rangelands, excreta concentrate in areas where livestock overnight, where feeds are more abundant or where feed quality is better. That modifies vegetation in the long term creating and maintaining emission hotspots in the landscape (Augustine et al 2003). Long-term monitoring is needed to capture peaks in N2O emissions and leaching. Wolf et al (2010) showed that missing short-lived pulses of emissions during spring thaw in the Mongolian steppe leads to large underestimations of the emissions for those systems. Unfortunately, there are no such data describing spatial and temporal variability of N flows for African systems, even though we can assume that re-wetting events at the onset of the wet season drives emission pulses (Brümmer et al 2008). Hickman et al (2011) questions the validity of IPCC emission factors to quantify emissions from African agriculture arguing that there are very few studies that looked at cropping practices, and none estimated all N flows on-farm. The same applies for livestock systems: there are no studies that look at the full balance using systems types that allow scaling to continental level. N budgets for African systems have mostly considered cropping and livestock being independent and having hardly any interaction. The inaccuracy of the estimates is partly a result of that flawed assumption. A multilevel systems typology that includes livestock (from fields, to farm and landscapes) can be used to encompass spatial variability.
5.3. Croplands and grazing land
Uncertainty in N budgets is also associated with the inaccuracy of the land cover maps. N flows estimated at field level or for individual animals are scaled to farm, region and continent using land areas. Efforts to improve quality of the N measurements, their frequency, and spatial spread, can be impaired by large disagreement in land cover maps. The choice of land cover database has a large effect on N budgets as it introduces a systematic error that propagates in the estimations (Nol et al 2008). The sort of information needed can be collected using comprehensive field surveys. There are initiatives aiming at improving the quality of spatial data. Geo-wiki (www.geo-wiki.org) (Fritz et al 2009) aims at using crowdsourcing to improve global land cover. Internet users are asked to recognize land cover features and report them online. The input is saved in a database with photographs to create an improved global land cover map.
5.4. Feedback cropland–livestock-grazing lands
In most large scale N budgets for Africa there is no interaction between livestock and crops, or these are extremely simplified. Crops are used to feed livestock and manures are applied to the land. However, both flows appear not to be constrained by the existence and availability of land or by the existence of livestock and their location. Amounts of crop residues fed to livestock are largely unknown, in spite of the wealth of research on crop residues and livestock (e.g. Renard 1997, Valbuena et al 2012). Besides, there has been much research on the use of organic residues as soil inputs, although with no good estimates of regional scope for manure utilization. Some research showed the importance of livestock for cropping, but not enough research quantified the importance of biomass production for livestock production (Rufino et al 2011, Herrero et al 2013).
5.5. Feed intake, manure excretion and utilization
Feed intake, livestock excretion and manure use are the main flows connecting crop and livestock systems. These flows can be estimated using calibrated models, given there is input data. Herrero et al (2013) developed a global livestock systems characterization that uses a nested system definition to include feeding and manure management using the livestock systems of Robinson et al (2011). The nested-systems definition allows using ranges for difficult-to-estimate flows, reflecting results obtained experimentally. The livestock systems characterization includes livestock diets that have been described for ten livestock systems: Livestock Grazing Temperate/tropical highlands (LGT), Livestock Grazing Humid-Subhumid Tropics and Subtropics (LGH), Livestock Grazing Arid/semiarid (LGA), Mixed Farming Temperate /tropical highlands (MRT), Mixed Farming Humid-Subhumid Tropics and Subtropics (MRH), Mixed Farming Arid/semiarid (MRA), and two landless systems (smallholder and industrialized). For each of these systems, the diets of cattle (dairy and non-dairy), small ruminants, poultry and pigs are described. For each combination of systems and livestock type, manure management and associated N losses are described (supplementary material, tables 1 and 2, available at stacks.iop.org/ERL/9/105008/mmedia).
The diets described for different systems in Herrero et al (2013), and livestock types and a process-based model were used to estimate excretion rates. Pathways for N losses in livestock systems differ from those of only crops systems. Herrero et al (2013) followed IPCC (2006) to estimate N2O emissions, though emission factors are mainly based on measurements in temperate regions. One of the most uncertain parameters in the regional and continental N budgets is the fraction of manure managed. This varies largely across and within systems, with systems recycling most manure excreted and others almost nothing. Our assessment including the most recent livestock population data of Robinson et al (2014) shows the geographic spread of available manure and its uncertainty (figure 1). Comprehensive surveys could be used to estimate proportion of manure used in croplands, or for other purposes by recording 'time spent' grazing in different land units, which can be cross-checked and geo-referenced. This data collected for all the range of systems and complemented with experimental data to estimate full losses for selected systems will improve the accuracy and usefulness of N budgets.
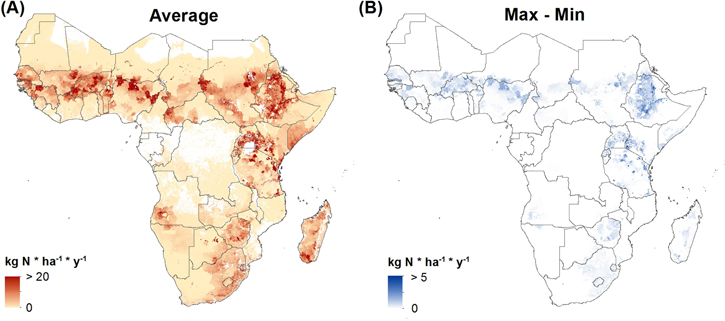
Figure 1. Available manure from cattle expressed as kg N per hectare and per year. (A) Spatial distribution of N when the fraction of manure managed (MS) as well as the total loss of N from management are kept at average values, and (B) Spatial distribution of differences in N between a maximum and a minimum value for MS for each cattle production system following the nested system description indicated in tables 2 and 3 of the supplementary material. The following formula was applied to calculate Available N: Cattle numbers * N excretion rate * [Average/Minimum/Maximum] Manure managed (MS) * [Average/Maximum/Minimum] Total N loss from MS.
Download figure:
Standard image High-resolution image
6. Conclusions
Livestock is poorly represented in N budgets for the African continent although there are some studies examining livestock-related N flows at different levels. Joint efforts are needed for spatial data collection of livestock data, crowdsourcing appears to be a promising option. The focus of the assessment of N budgets must go beyond croplands to include livestock and crop–livestock interactions. We propose a nested systems definition of livestock systems that links local, regional level, and continental level and therefore increases the usefulness of point measurements of N losses. Scientists working at all levels should generate data to calibrate process-based models. Measurements in the field should not only concentrate on GHG emissions, but need to include crop and livestock production measurements, soil stock changes and other N loss pathways such as leaching, run-off and volatilization to assess management practices and trade-offs. Finally, compared to the research done in other continents on N flows in livestock systems, there are few data for Africa, and therefore concerted effort will be needed to generate sufficient data for modelling.
Acknowledgements
We thank Bert Janssen and Lex Bouwman for useful suggestions to an early version of the manuscript. This work was funded by the Climate Change Agriculture, and Food security (CCAFS) program of the Consultative Group on International Agricultural Research.