
Abstract
Amplified Arctic warming is expected to have a significant long-term influence on the midlatitude atmospheric circulation by the latter half of the 21st century. Potential influences of recent and near future Arctic changes on shorter timescales are much less clear, despite having received much recent attention in the literature. In this letter, climate models from the recent CMIP5 experiment are analysed for evidence of an influence of Arctic temperatures on midlatitude blocking and cold European winters in particular. The focus is on the variability of these features in detrended data and, in contrast to other studies, limited evidence of an influence is found. The occurrence of cold European winters is found to be largely independent of the temperature variability in the key Barents–Kara Sea region. Positive correlations of the Barents–Kara temperatures with Eurasian blocking are found in some models, but significant correlations are limited.
Export citation and abstract BibTeX RIS

Content from this work may be used under the terms of the Creative Commons Attribution 3.0 licence. Any further distribution of this work must maintain attribution to the author(s) and the title of the work, journal citation and DOI.
1. Introduction
In projections of anthropogenic climate change the surface warming signal is considerably amplified in the Arctic region. Observations from the last decade in particular suggest that the Arctic amplification pattern of warming is already emerging, intimately linked to dramatic reductions of sea ice coverage in recent years (Screen and Simmonds 2010, Stroeve et al 2012). These sea ice reductions have arisen at least partly in response to anomalous atmospheric circulation patterns which have brought increased heat and cross-Arctic winds in recent years (Overland and Wang 2010, Lee et al 2011).
Sea ice variability is strongly influenced by atmospheric circulation (Deser et al 2000, Rigor et al 2002), and recent summer weather patterns have been particularly instrumental in driving sea ice loss (Overland et al 2012). However, wintertime patterns have also been unusual in recent years, featuring extreme cases of blocking (de Vries et al 2013) and jet variability (Seager et al 2010, Santos et al 2013). These have frequently led to severe cold spells in northern midlatitudes, in particular over Europe (Cattiaux et al 2010), and it has been suggested that the Arctic warming itself may have influenced the occurrence of these patterns (Overland et al 2011, Cohen et al 2012).
There is considerable modelling evidence that changes in sea ice can lead to a response of the large-scale atmospheric circulation which projects onto the North Atlantic Oscillation (NAO). A reduction in sea ice, especially to the east of Greenland, often leads to a negative NAO response, signalling an equatorward shift of the North Atlantic jet and storm track (Magnusdottir et al 2004, Deser et al 2007, Seierstad and Bader 2008, Strong et al 2009, Strong and Magnusdottir 2011, Sedlácek et al 2012). The response, however, appears quite sensitive to the basic state of the model (Bader et al 2011) and is generally weak compared to atmospheric natural variability (Screen et al 2013). By the end of the 21st century the Arctic warming is much stronger, and the associated reduction in the low level equator to pole temperature gradient is one of the key factors driving long-term changes in the midlatitude winds and storm tracks (Rind 2008, Deser et al 2010, Hwang et al 2011, Harvey et al 2013).
Some recent studies have suggested stronger influences of Arctic change on the midlatitudes which are already evident in observations. These fall into two categories. Firstly, Francis and Vavrus (2012) suggested that Arctic amplification has led to weaker westerly winds and hence to more persistent weather patterns. However, these results appear very sensitive to the methods used to define the weather patterns (Screen and Simmonds 2013, Barnes 2013) and the jets (Woollings et al 2013).
Secondly, several studies have suggested a more regional response, with increased Eurasian winter blocking and surface cold extremes as a result of sea ice loss in the Barents–Kara Sea region (Honda et al 2009, Petoukhov and Semenov 2010, Liu et al 2012, Tang et al 2013). These studies have provided both observational and modelling evidence for an influence of sea ice on the atmospheric circulation, including observed anticorrelations between Arctic and continental winter temperatures (Cohen et al 2013). However, it is difficult to determine causality in the observational record alone, and it is not clear to what extent different climate models agree on this hypothesised influence. In addition, these studies generally used a relatively basic definition of atmospheric blocking as a local positive geopotential height anomaly, and it is not clear how well this distinguishes Eurasian blocking from the canonical NAO response described above.
The aim of this letter is therefore to investigate these issues in a broad set of current climate models and using a more conventional index to define atmospheric blocking. Specifically we use models from the recent Coupled Model Intercomparison Project Phase 5 (CMIP5). We analyse data from present day and future climate projections to investigate whether the hypothesised links between Arctic warmth and Eurasian winter blocking and cold events are evident in the models. Yang and Christensen (2012, YC hereafter) performed a similar analysis of the CMIP5 models, concluding that there is an influence of sea ice variations on European cold spells, in particular in the near future when sea ice is declining rapidly. We revisit this analysis with a focus in particular on whether there is an influence on the detrended variability of temperature, and in addition we search for an associated influence on blocking.
2. Data
We use data from 12 climate models contributing to the CMIP5 project (Taylor et al 2012). These are the models for which blocking was diagnosed by Masato et al (2013a), and they are listed in table 1. We use surface air temperature data from the historical, RCP4.5 and RCP8.5 simulations, using only the first ensemble member for each model (apart from EC-EARTH, for which member 6 is used).
Table 1. The climate modelling centres and models considered for this study. The horizontal resolution and vertical levels of each model are also listed. The models marked * are used in figure 2.
| Acronym | Model | Centre | Horizontal Res | Vertical lev (above 200 hPa) |
|---|---|---|---|---|
| BCC | BCC-CSM1.1 | Beijing Climate Center | 1.9, 1.9 | 26(13) |
| CCCma | CanESM2 | Canadian Centre for Climate Modelling and Analysis | 1.9 (T63) | 35(12) |
| CNRM-CERFACS | CNRM-CM5 | Centre National de Recherches Meteorologiques (Toulouse) | 1.4 (T127) | 31(9) |
| EC-EARTH* | EC-EARTH | EC-EARTH consortium (Europe) | 1.125 (T159) | 91(19) |
| IPSL | IPSL-CM5A-MR | Institut Pierre-Simon Laplace (France) | 1.25, 1.25 | 39(22) |
| MIROC* | MIROC5 | Atmosphere and Ocean Research Institute (Tokyo) | 1.4 (T127) | 56(17) |
| MOHC* | HadGEM2-CC | Met Office Hadley Centre (UK) | 1.25, 1.875 | 60(37) |
| MPI* | MPI-ESM-MR | Max Planck Institute for Meteorology (Hamburg) | 1.9 (T63) | 95(47) |
| MRI | MRI-CGCM3 | Meteorological Research Institute (Japan) | 1.125 (T159) | 48(20) |
| NCAR | CCSM4 | National Center for Atmospheric Research (Boulder, USA) | 0.9, 1.25 | 27(13) |
| NCC | NorESM1-M | Norwegian Climate Centre | 1.89, 2.5 | 26(13) |
| NOAA | GFDL-ESM2M | Geophysical Fluid Dynamics Laboratory (Princeton, USA) | 2, 2.5 | 24(5) |
Blocking events are large-scale, quasi-stationary and persistent weather systems which obstruct the prevailing westerly winds and storm tracks. Here we use the two-dimensional (latitude–longitude) blocking index of Masato et al (2013a) which identifies blocking events as large-scale reversals of the meridional gradient of 500 hPa geopotential height. Events are constrained to remain quasi-stationary for at least five days. This index gives broadly similar results to other blocking indices when applied to CMIP5 data (Anstey et al 2013, Dunn-Sigouin and Son 2013). We use blocking diagnostics over periods of 44 years from each of the historical (1956–1999) and RCP8.5 (2056–2099) scenarios.
3. European winter temperatures
In this section we analyse the surface air temperature from the 12 models to determine if there is a relationship between Arctic warming and the occurrence of cold winter anomalies over Europe. We follow the approach of YC in defining a cold winter month (CWM) to occur when the surface air temperature averaged over the central European region (10–30E, 45–55N) falls below the climatological mean of the present day period. This region is marked in figure 1. We use 1971–2000 as the present day climatological period, and the anomalies are calculated with respect to each individual model's climatology. As in YC, this choice of climatological period leads to a decreasing occurrence of CWMs over time as greenhouse gases rise.
Figure 1(a) shows the multi-model composite anomalies of surface air temperature during CWMs in the present day simulations from the period 1971–2000. This composite shows cold anomalies over Europe which extend into Asia and also warm anomalies over Greenland. The Greenland anomalies suggest that CWMs in the models often occur in response to negative episodes of the North Atlantic Oscillation, which leads to anticorrelated temperatures in these two regions (van Loon and Rogers 1978). The pattern of temperature anomalies is very similar to that in figure 1 of YC.
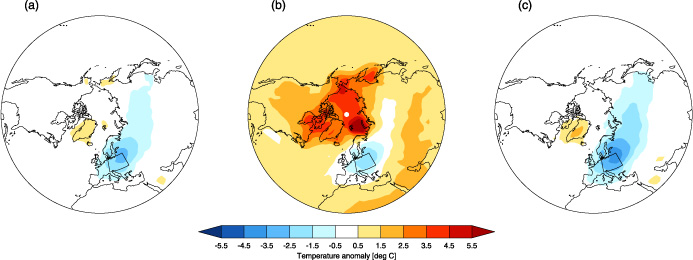
Figure 1. Multi-model composite anomalies of surface air temperature for European Cold Winter Months: (a) present day simulations, (b) RCP4.5 simulations using the present day climatology and (c) RCP4.5 simulations using the RCP4.5 climatology. All 12 models are used in the composites.
Download figure:
Standard image High-resolution imageIn figure 1(b) we mirror YC in showing composite anomalies of CWMs in the period 2006–2050 from the RCP4.5 simulations. These are again very similar to the results of YC (their figure 2(a)). Cold temperatures extend from Europe into Asia as before, but these are embedded in a global warming pattern of increased temperatures over both land and ocean. Strong warm anomalies are particularly evident in the Arctic, and this prompted YC to suggest an influence of amplified Arctic warming on the CWMs. However, because the present day climatology is used in constructing this composite, it is not clear from this whether or not European and Arctic temperatures are linked, in that they covary once the data is detrended.

Figure 2. Correlation maps of winter (DJF) blocking with time series of seasonal mean temperatures over the Barents–Kara Sea region. Correlation values are shown in colour with contour lines showing the climatology of DJF blocking in each respective model (drawn every 0.05 from 0.05). Correlations are shown with autumn (left) and winter (right) temperatures. The models used are marked in table 1.
Download figure:
Standard image High-resolution image
To demonstrate this, we repeat the analysis of figure 1(b) using the same set of CWMs but with the temperature anomalies calculated with respect to the climatological period of 2006–2050 from the RCP4.5 simulations. The result, shown in figure 1(c), is an anomaly pattern very similar to figure 1(a). This shows that the general warming of land and ocean and also the strong Arctic warming in figure 1(b) are features of the background warming pattern, and do not covary with the occurrence of CWMs. Greenland remains anomalously warm during CWMs but there are no anomalies in the Arctic. This shows that, relative to the climatology of that period, CWMs do not preferentially occur when the Arctic is anomalously warm. The cold anomalies over Eurasia are stronger than those in the present day simulations (figure 1(a)). This just shows that due to the warming, stronger cold anomalies relative to the RCP4.5 period are required to bring absolute temperatures below the threshold to classify as a CWM.
We have investigated this issue further by looking for correlations between Arctic and European temperatures in the detrended variability of the models. For this exercise we used the periods 1956–1999 from the historical and 2056–2099 from the RCP8.5 simulations, which match the data availability of the blocking diagnostics. We used the central European temperatures, averaged over the same region as before, and also the temperatures averaged over the region of the Barents–Kara Sea (30–80E, 65–80N). This is the region which was particularly suggested to influence European cold winters by Honda et al (2009) and Petoukhov and Semenov (2010). In addition, Magnusdottir et al (2004) found that the large scale atmospheric circulation is more sensitive to sea ice perturbations to the east of Greenland than to the west. For both regions, DJF-mean temperature time series were formed and these were then linearly detrended at each grid point prior to correlation.
The results are that, of the 24 simulations (both scenarios for all 12 models), none show a negative correlation between temperatures over Europe and over the Barents–Kara Sea (results not shown). Six simulations show significant positive correlations (using a two-tailed 95% T-test), indicating that both regions tend to warm and cool together in the interannual variability. These correlations are weak however, explaining at most 12% of the shared covariance. Wintertime temperature variations over the two regions are hence surprisingly decoupled in the interannual variability. There is also no clear indication that this relationship changes in the future period. Of the significant correlations, two are found in historical simulations and four in RCP8.5.
4. Blocking
In this section we search for relationships between Arctic temperature anomalies and Northern Hemisphere blocking. As before, we linearly detrend both the temperature and blocking time series before analysis. We proceed by searching for correlations between winter mean blocking frequency and the seasonal mean temperature over the Barents–Kara Sea region used above. Preceding autumn (SON) as well as winter (DJF) time series of Arctic temperatures are used in an attempt to emphasise any influence of the Arctic on the blocking. We focus on the historical simulations but also briefly describe results from the RCP8.5 simulations.
A well-known feature of climate models is a tendency to underestimate the occurrence of blocking, particularly over Europe. While some CMIP5 models perform better in this regard, there are still several with very low occurrence of blocking (Masato et al 2013a, Anstey et al 2013, Dunn-Sigouin and Son 2013). Here we follow Masato et al (2013b) in focusing on the four models which have the best simulation of the wintertime blocking climatology. These models have reasonable occurrence of blocking frequency over Europe, with around 80% of the observed occurrence of blocking. The analysis has been performed for all 12 models however, and these results are also briefly described.
Figure 2 shows the correlation maps of winter blocking with Arctic temperatures for these four models, using both autumn and winter Arctic temperature series. For this sample size, correlations greater than 0.3 in magnitude would be considered significant in a two-sided T-test. The strongest correlations are seen for the Met Office Hadley Centre model HadGEM2-CC in DJF. These correlations extend from Europe through into Asia, reaching values of 0.5 over eastern Europe. This is in agreement with the studies described in section 1, which suggested that Eurasian winter blocking occurs preferentially when the Arctic temperatures are anomalously high. Similar, albeit weaker correlations are seen when using autumn Arctic temperatures, adding support to the interpretation of a causal influence on the blocking. This European signal, however, is not seen as clearly in the other three models. EC-EARTH and, to a lesser extent, MPI have positive correlations over Eurasia, but significant values are limited to quite small areas. We also note that the causality underlying these correlations is not clear, since blocking over Eurasia might lead to warm southerly winds over the Barents–Kara Sea (similar to the mechanism of Woods et al (2013)).
All of the models have negative correlations of Greenland blocking with winter Arctic temperatures, and these are generally significant. Greenland blocking is closely associated with the negative phase of the NAO (Woollings et al 2008), so these correlations are consistent with the occurrence of positive NAO years (with low Greenland blocking) bringing warmer air to the Barents–Kara Sea region. The autumn correlations over Greenland in these models are small. None of the models show positive correlations over Greenland, which would be expected from the influence on the NAO described above. This supports the evidence that this NAO response in models is weak compared to the natural variability of the NAO.
In the RCP8.5 simulations (not shown), the correlations are generally weak, although some of the links above are also deemed significant in these runs, namely the positive correlations over Eurasia in EC-EARTH, MPI and MOHC (DJF only) and the negative correlations over Greenland in DJF for all four models. This suggests that within the models these links are robust to some extent.
We chose to focus on these four models due to their relatively satisfactory simulation of European blocking. Influences on European blocking might be underestimated in those models which produce blocking events less often. Correlations have been calculated for the other eight models (not shown) and these are generally very weak, with only a few isolated points achieving correlations above 0.3. The most noteworthy of these are CNRM (with a correlation of 0.4 over Scandinavia using SON temperatures) and IPSL (with a correlation of 0.4 over Greenland using SON temperature). There are therefore no robust correlations in this model set.
To summarise this section, there is no agreement between models on a significant link between Eurasian blocking and Barents–Kara Sea temperatures. There is some evidence of a weak relationship with Eurasian or Greenland blocking in a few of the models only, although these are the ones which best represent blocking. In addition, we note that even in HadGEM2-CC, which has the strongest correlations over Eurasia, there is no correlation between European and Barents–Kara Sea temperatures in the analysis of section 3.
5. Conclusions
Arctic amplification of global warming is clearly a dramatic environmental change which will have numerous impacts. As described in section 1, there is evidence that the long-term trend in Arctic warming will have a strong influence on midlatitude atmospheric circulation. The associated decrease in the lower tropospheric meridional temperature gradient is one of the competing factors driving changes in the midlatitude jets and storm tracks (Woollings 2010).
However, whether Arctic changes have influenced the midlatitudes in recent years, or whether they will do on the interannual timescale in the near future, is much less clear. Previous modelling work has shown the potential for sea ice perturbations to influence the midlatitude circulation but these signals are weak compared to the natural variability. The analysis of 12 current climate models presented here has not found any evidence of stronger links than this.
We focused on the detrended variability of Barents–Kara Sea temperatures and searched for links with mid-latitude blocking and with European winter temperatures. In contrast to previous work we found no evidence of an influence of a warm Arctic on cold European winters. Removing the long-term trend is key to this difference, and we consider it is more informative to remove this trend when looking for physical links.
Similarly there is only weak evidence in these models of an Arctic influence on Atlantic or Eurasian blocking on this timescale, as correlations are weak and generally not significant. There are positive correlations with Eurasian blocking in some of the models which have the best representation of blocking in CMIP5. However, the significance of these correlations is limited and the direction of causality is not clear.
The atmospheric circulation response to forcings such as sea ice changes is often quite sensitive to the basic state (Kushnir et al 2002, Bader et al 2011). Given that blocking is a feature which is still poorly simulated by many models, it is possible that an Arctic influence on the midlatitudes will become more apparent as models improve. For example, increases in horizontal (Berckmans et al 2013) and/or vertical (Anstey et al 2013) resolution have been shown to improve blocking and may enable a more trustworthy multi-model assessment in the future.
Acknowledgments
We acknowledge the World Climate Research Programme's Working Group on Coupled Modelling, which is responsible for CMIP, and we thank the climate modeling groups (listed in table 1 of this letter) for producing and making available their model output. For CMIP the US Department of Energy's Program for Climate Model Diagnosis and Intercomparison provides coordinating support and led development of software infrastructure in partnership with the Global Organization for Earth System Science Portals. We would also like to thank the anonymous reviewers for constructive comments.