
Abstract
Significant melting events over Greenland have been observed over the past few decades. This study presents an analysis of surface albedo change over Greenland using a 32-year consistent satellite albedo product from the global land surface satellite (GLASS) project together with ground measurements. Results show a general decreasing trend of surface albedo from 1981 to 2012 (−0.009 ± 0.002 decade−1, p < 0.01). However, a large decrease has occurred since 2000 (−0.028 ± 0.008 decade−1, p < 0.01) with most significant decreases at elevations between 1000 and 1500 m (−0.055 decade−1, p < 0.01) which may be associated with surface temperature increases. The surface radiative forcing from albedo changes is 2.73 W m−2 decade−1 and 3.06 W m−2 decade−1 under full-sky and clear-sky conditions, respectively, which indicates that surface albedo changes are likely to have a larger impact on the surface shortwave radiation budget than that caused by changes in the atmosphere over Greenland. A comparison made between satellite albedo products and data output from the Coupled Model Inter-comparison Project 5 (CMIP5) general circulation models (GCMs) shows that most of the CMIP5 models do not detect the significantly decreasing trends of albedo in recent decades. This suggests that more efforts are needed to improve our understanding and simulation of climate change at high latitudes.
Export citation and abstract BibTeX RIS

Content from this work may be used under the terms of the Creative Commons Attribution 3.0 licence. Any further distribution of this work must maintain attribution to the author(s) and the title of the work, journal citation and DOI.
1. Introduction
The Greenland ice sheet contains enough water to increase global sea levels by 6–7 m (Cuffey and Marshall 2000). Satellite observations have identified a warming trend in the Arctic since the early 1980s (Comiso 2003), and extensive and prolonged melt events over Greenland have also been observed by satellites in the last three decades (Mote 2007, Nghiem et al 2012, Abdalati and Steffen 1997, Steffen et al 2004).
Snow and ice surfaces usually have high reflectivity, but partial/complete melt can reduce the surface reflectivity significantly. According with the positive feedback mechanism, as the surface temperature increases the surface albedo decreases due to snow melt. The melted surface then absorbs more solar energy, which in turn increases the surface temperature. Thus, the melting of the Greenland ice sheet plays a key role in regional climate change and such an occurrence of albedo feedback serves as an indicator of global warming.
Surface albedo, which is defined as the ratio of outgoing to incoming radiation at the Earth's surface (Liang 2004, Liu et al 2012), is used in climate studies to quantify surface reflectivity. Assessments of Greenland albedo variability have been conducted using different datasets over different time periods (Stroeve 2001, Box et al 2012, Stroeve et al 2013), but owing to the limited data inconsistency between AVHRR and MODIS and general problems with AVHRR-derived albedo products (Box et al 2006), a continual evaluation of Greenland surface albedo over the past three decades has not been conducted. However, the production of 32-year consistent GLASS surface albedo product (Liu et al 2013b) provides the opportunity to examine the surface albedo changes over Greenland since the early 1980s, and to extend the work of previous studies. In this study, we investigate the 32-year summer albedo change, both temporally and spatially, using the GLASS albedo product, and then we discuss the impact on surface shortwave net radiation over Greenland ice sheet.
2. Data and methods
2.1. GLASS albedo product
The GLASS albedo product is derived from the advanced very high resolution radiometer (AVHRR) and moderate resolution imaging spectroradiometer (MODIS) observations (Liu et al 2013a, 2013b, Qu et al 2013, Liang et al 2013). It records surface shortwave broadband albedo every eight days at a spatial resolution of 0.05° from 1981 to 2012, which were used in this study. The GLASS albedo data with a resolution of 1 km is also available from 2000 to 2012. Validation of the GLASS albedo has been made globally using ground measurements and standard MODIS albedo products (MCD43, Schaaf et al 2002) (Liu et al 2013b). Efforts have been made to make these two products consistent, including: (1) using the same surface albedo spectra to train the regression; and (2) using temporal filter and climatological background data to fill the data gaps. We cross-compared the monthly averaged albedo data from GLASS-AVHRR and GLASS-MODIS in July 2000, 2003, and 2004. Figure 1 shows the comparison between the albedo anomalies derived from the two products in July 2000, which demonstrates the consistency of GLASS products from two sensors. There are some small differences in the northern part of inland Greenland, mainly in that GLASS-AVHRR has an underestimation of albedo anomalies (difference < 0.02) compared with GLASS-MODIS. Statistical comparisons of the July albedos from the two products on a pixel basis in 2000, 2003, and 2004 (table 1) show that the relative accuracy of the July GLASS-AVHRR albedo to GLASS-MODIS albedo is very consistent over time.
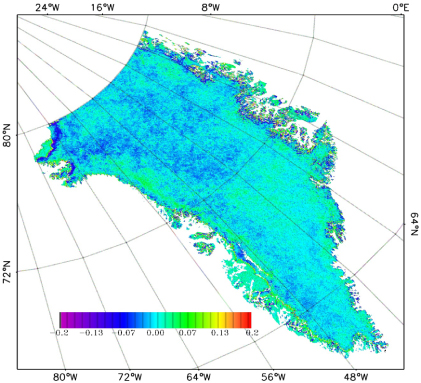
Figure 1. Difference of July albedo spatial anomalies in 2000 (GLASS-AVHRR minus GLASS-MODIS).
Download figure:
Standard image High-resolution imageTable 1. Statistical comparison of July GLASS data derived from AVHRR and MODIS in the overlap period on a pixel basis over Greenland.
| Year | RMSE | R2 |
|---|---|---|
| 2000 | 0.045 | 0.964 |
| 2003 | 0.041 | 0.970 |
| 2004 | 0.044 | 0.964 |
2.2. Spatial and temporal aggregation
The mean albedo in July was calculated for the analysis in this study. Areal aggregation was applied to calculate the mean albedo over the entire area of Greenland using the following equation:
where  is the monthly averaged local noon shortwave albedo for the entire area of Greenland; αi is the monthly averaged shortwave albedo for pixel i; and wa and ws are the area of and the downward shortwave radiation of the pixel, respectively. The 0.05° land/water mask was extracted from the MODIS land cover product (MCD12) for the year of 2000 to exclude water pixels in the calculation. It should be noted that the reliability of satellite albedo at very high latitudes is of concern because of the limitation of surface anisotropy models (Schaaf et al 2011), and that the contribution from the area at very high latitudes is quite small. In addition, current GLASS albedo product does not cover the high-latitudes (>80°N) area of Greenland in the MODIS era. Thus, we considered only part of Greenland (≤80°N) in the analysis in this study. Since the are of the high-latitudes (>80°N) part of Greenland is small, its albedo variation could not result in significant errors in the aggregated land albedo estimation over the entire Greenland. The monthly surface downward solar radiation was obtained from the Modern Era-Retrospective Analysis for Research and Applications (MERRA) at a spatial resolution of 1/2°-by-2/3° (Rienecker et al 2011).
3. Results and discussion
3.1. Validation of GLASS albedo products using ground measurements
To maintain consistent results, we used the 0.05° (∼5 km) resolution GLASS albedo products derived from AVHRR and MODIS data. Data from July were chosen here because: (1) the albedo data were less affected by the solar zenith than during other months; (2) the coverage of valid albedo data over Greenland is largest in July.
Ground measurements of surface albedo are available at 19 Greenland Climate Network (GC-Net) sites from 1995 (Steffen and Box 2001), although not all the sites have the same temporal coverage. Information on the spatial and temporal coverage of GC-Net sites can be found at http://cires.colorado.edu/science/groups/steffen/gcnet/GC-Net_info.pdf. Albedo was measured by the pyranometers at half-hour intervals. As the satellite products provide local noon albedo values, we generated the average ground measurements from 12 pm ± 1 h on a daily basis (He et al 2012) and then calculated the monthly mean of the daily albedo where there were at least 20 days of daily albedo data available.
GLASS albedo product is available every eight days. We calculated the mean value of July albedo based on the quality flags (QC) of GLASS products (only QC =0 and 1 were selected). To match the satellite data with the ground measurements, we chose the pixel nearest to the GC-Net site. Black-sky and white-sky albedos are provided in the GLASS products. These two concepts are defined under ideal conditions assuming either direct sunlight (black-sky) or diffuse skylight (white-sky) is available. The actual surface albedo is a combination of these two variables (Roman et al 2010, Pinty et al 2005).
The comparison made between GLASS albedo and the ground measurements at GC-Net sites (figure 2) showed that the satellite product used in this study can generally satisfy the accuracy requirements with a very small negative bias. GLASS-MODIS albedo has a slightly larger negative bias because there are more data at (partially) melted surfaces with albedo values smaller than 0.6. Most of the (partially) melted albedo values were observed at two sites: JAR1 and Swiss Camp. However, a direct comparison between GLASS products and ground measurements at these two heterogeneous sites may not be ideal for validating GLASS products because of large scale differences. After removing these two sites, the results were much improved (bias: −0.009; RMSE: 0.042; R2: 0.933).
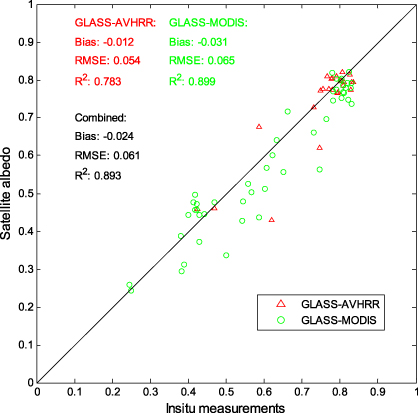
Figure 2. Comparison of July GLASS albedo with ground measurements at all GC-Net sites.
Download figure:
Standard image High-resolution image3.2. Albedo trend at GC-Net sites
Ground measurements of surface downward shortwave radiation, surface albedo and near surface air temperature were used in this study to help verify the trend and magnitude of albedo changes over Greenland. Based on the data availability of ground measurements, ten sites were chosen within the trend analysis in this section (sites listed in table 2). A time series of surface albedo anomalies and near surface air temperature comparison at the GC-Net sites is shown in figure 3 and table 2. Since both GLASS-AVHRR and GLASS-MODIS albedos were available in 2000, to further remove the possible bias between them the respective mean albedo values from 2000 were used as the reference for calculating the albedo anomaly.
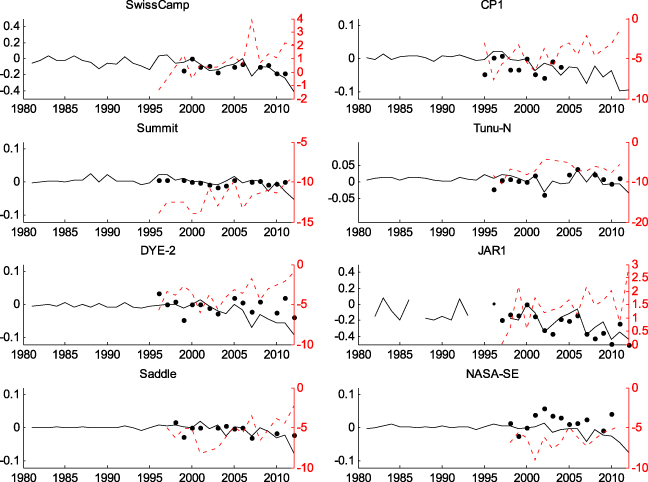
Figure 3. Time series of albedo anomaly (left axis) and near surface air temperature (° C) (right axis) at GC-Net sites in July (1981–2012). Black solid line: GLASS albedo products; black dots: ground albedo data; red dashed line: ground measured air temperature.
Download figure:
Standard image High-resolution imageTable 2. Trends of satellite observed surface albedo, ground measurements at GC-Net sites. (Note: significance level—*: 90%; **: 95%; ***: 99%, others are not significant at 90% level.)
| Site name | Satellite albedoa(decade−1) | Satellite albedob(decade−1) | Ground albedob(decade−1) | Air temperatureb (°C decade−1) | Ground downward radiationb(W m−2 decade−1) | Temporal range |
|---|---|---|---|---|---|---|
| Swiss Camp | −0.062*** | −0.125** | −0.088* | 2.90** | −56.2* | 1999–2011 |
| CP1 | −0.025*** | −0.060*** | −0.012 | 0.43 | −58.6* | 1995–2004 |
| (p = 0.67) | (p = 0.82) | |||||
| Summit | −0.007** | −0.020*** | −0.005 | 1.81 | −12.5 | 1996–2012 |
| (p = 0.22) | (p = 0.14) | (p = 0.24) | ||||
| Tunu-N | −0.005* | −0.009 | 0.013 | 2.26 | −9.3 | 1996–2011 |
| (p = 0.35) | (p = 0.26) | (p = 0.14) | (p = 0.22) | |||
| DYE-2 | −0.018*** | −0.049*** | −0.009 | 1.22 | −23.4 | 1996–2012 |
| (p = 0.45) | (p = 0.26) | (p = 0.34) | ||||
| JAR1 | −0.090*** | −0.099 | −0.236 | 0.49 | −29.9 | 1997–2012 |
| (p = 0.18) | (p = 0.21) | (p = 0.26) | (p = 0.59) | |||
| Saddle | −0.009*** | −0.037*** | −0.017 | 0.85 | −16.4 | 1997–2012 |
| (p = 0.11) | (p = 0.55) | (p = 0.21) | ||||
| South Dome | −0.007*** | −0.034* | −0.026 | 4.36** | 2.3 | 2003–2012 |
| (p = 0.57) | (p = 0.94) | |||||
| NASA-SE | −0.012*** | −0.025** | 0.010 | 0.71 | 1.6 | 1998–2011 |
| (p = 0.63) | (p = 0.53) | (p = 0.91) | ||||
| JAR2 | −0.006** | −0.010* | −0.008 | 0.46 | −71.8 | 1999–2012 |
| (p = 0.62) | (p = 0.24) | (p = 0.33) |
aSatellite observed albedo trend in 1981–2012. bTrend derived from GC-Net ground measurements and satellite data with overlap time specified in the last column; ground measurements in some years in the temporal range may not be available.
From satellite observations, over the last three decades, all the sites have experienced a decrease in surface albedo (table 2 and figure 3). In the overlap time periods specified in table 2, albedo decreases were observed from both satellite observations and ground measurements at most sites. It is evident that there has been an acceleration of albedo decrease because the decreasing trends have been much larger in recent years than in the years before ground measurements were available. However, due to data uncertainties in the ground measurements (e.g., bias from the reduced spectral coverage of some instruments) (Stroeve 2001, Stroeve et al 2013), trends from ground data in some sites were not significant at 90% confidence level. The two sites, Swiss Camp and JAR1, showed significant decreases from 1981 because they are located at lower elevations and are closer to the coast where there was higher surface temperature and expansion of bare ice occurred (Fettweis 2007). From as early as 1995, there has been an evident increase in the near surface air temperature at all the sites used in this study, which is like to have amplified the albedo change via the albedo feedback, particularly in the ablation area. In general, we found similar albedo trends to those reported by Box et al (2012) after 2000 at site levels. However, we did not find significantly decreasing trends from either the GLASS albedo product or ground measurements compared to what was reported by Stroeve (2001) using the AVHRR Polar Pathfinder (APP) data from 1981 to 1998.
3.3. Surface albedo trend over Greenland
Following the calculation using equation (1), the surface albedo for Greenland was generated using GLASS albedo products and the full-sky surface downward shortwave radiation from the MERRA (Rienecker et al 2011). Since less than 0.1% of the pixels was found missing or was of poor quality in the monthly aggregated albedo maps, the data for different years was used for comparison. Results reveal that from 1981 to 2012, the surface albedo for Greenland decreased at a rate of 0.009 ± 0.002 decade−1 (p < 0.01) (figure 4), and before 2000 the albedo fluctuated annually, reaching maximum and minimum values in 1992 and 1994, respectively. However, the general trend before 2000 is not statistically significant with a positive trend of 0.002 ± 0.003 decade−1 (p = 0.57). But the surface albedo has decreased at a rate of 0.028 ± 0.008 decade−1 (p < 0.01) since 2000, which is mainly associated with multiple extreme melting events over Greenland (Steffen et al 2004, Mote 2007, Nghiem et al 2012) (see figure 4). We have conducted the same analyses for June and August from 1981 to 2010, and found consistent decreasing trends in surface albedo (June: −0.004 decade−1; August: −0.004 decade−1) with the trends in July (−0.006 decade−1) in the same time period.
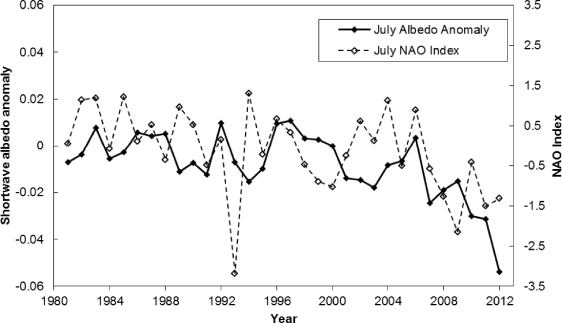
Figure 4. Surface albedo changes over the entire Greenland from GLASS data in July and NAO index (1981–2012).
Download figure:
Standard image High-resolution imagePrevious research has linked recent climate changes in Greenland to regional/global climate indices (Box et al 2012, Bromwich et al 1999, Stroeve 2001). The North Atlantic Oscillation (NAO) is believed to be the major source of multiannual climate change over Greenland, particularly in the western part (Appenzeller et al 1998). A positive correlation (r = 0.37) was found in this study between the July NAO index from the National Oceanic and Atmospheric Administration (NOAA) Climate Prediction Center (CPC) and the 32-year Greenland surface albedo anomaly (shown in figure 4). This result could be explained by the fact that the negative NAO index value in summer is related to the melting and the positive NAO value is linked to precipitation in Greenland (Box et al 2012, Bromwich et al 1999, Fettweis et al 2013).
Albedo trends were found to vary spatially. Greenland was divided into seven regions on the basis of Global Multi-resolution Terrain Elevation Data 2010 (GMTED2010) (Danielson and Gesch 2011) (figure 5). Statistical analysis shows significantly different trends before and after 2000 at each elevation range (table 3). Before 2000, areas below 2000 m do not show statistically significant albedo trends, while those over 2000 m show slight increasing trends owing to snow accumulation and less metamorphism (e.g., albedo reached its peak in 1992 followed by a volcanic eruption Abdalati and Steffen 1997). Surface albedo decreased in almost all the elevation ranges after 2000, with most significant changes occurring in the ablation area between 1000 and 1500 m, in which range the mean near surface air temperature was very close to the melting point.
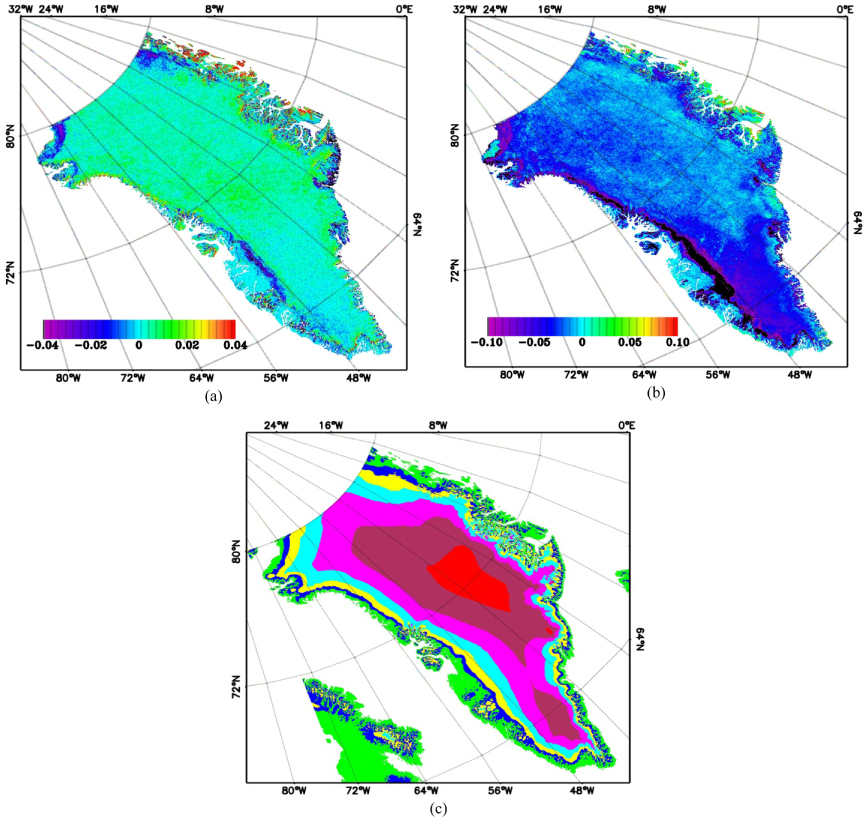
Figure 5. (a) Decadal July albedo change rate over Greenland from GLASS products in 1981–2000; (b) decadal July albedo change rate over Greenland from GLASS products in 2000–2012; (c) digital elevation model of Greenland from USGS GMTED data divided into eight levels: sea level and below (white), ≤500 m (green), 501–1000 m (blue), 1001–1500 m (yellow), 1501–2000 m (cyan), 2001–2500 m (magenta), 2501–3000 m (maroon), and above 3000 m (red).
Download figure:
Standard image High-resolution imageTable 3. Surface albedo changes over different elevations. (Note: significance level—*: 90%; **: 95%; ***: 99%, others are not significant at 90% level.)
| Elevation (m) | Decadal change rate | ||
|---|---|---|---|
| 1981–2000 | 2000–2012 | 1981–2012 | |
| ≤500 | 0.006 | −0.010 | −0.006** |
| 501–1000 | 0.000 | −0.041** | −0.019*** |
| 1001–1500 | −0.001 | −0.055*** | −0.020*** |
| 1501–2000 | 0.003 | −0.031** | −0.011*** |
| 2001–2500 | 0.003 | −0.025** | −0.008*** |
| 2501–3000 | 0.004* | −0.018** | −0.005** |
| >3000 | 0.004* | −0.013* | −0.002 |
The spatial distribution of annual albedo change shown in figure 3 indicates that the most albedo decreases during the last decade occurred in southwest Greenland, which may be the result of the greater anticyclonic conditions in Greenland and the warmer air advected in this area (Fettweis et al 2013). Larger trends at lower elevations (especially in the ablation area in the southwest), are very likely associated with the albedo feedback, because temperatures are warmer and snow/ice exposure are more likely to occur.
3.4. Radiative forcing from albedo changes
The July MERRA full-sky and clear-sky surface downward radiation data from 1981 to 2012 indicate a dimming trend (full-sky: −0.78 W m−2 decade−1, p = 0.47; clear-sky: −1.26 W m−2 decade−1, p < 0.01). The dimming trend was also observed in the ground measurements (listed in table 2). Regional or global physical models are often used to assess the radiative forcing from surface albedo changes. In this study, we used a simplified approach to conduct the analysis, relying solely on the remote sensing and reanalysis data sets. Assuming the surface albedo remains the average of all 32 years (0.684), the change in surface downward radiation would cause net shortwave radiation to decrease by 0.55 W m−2 decade−1 and 0.86 W m−2 decade−1 under full-sky and clear-sky conditions, respectively. Assuming the surface downward radiation does not change (303.42 W m−2 for full-sky and 339.84 W m−2 for clear-sky, which is the July average of all 32 years), the radiative forcing on net shortwave radiation caused by the surface albedo change would be 2.73 W m−2 decade−1 and 3.06 W m−2 decade−1 under full-sky and clear-sky conditions, respectively. This indicates that surface albedo changes may have a larger impact on the surface shortwave radiation budget than that caused by changes in cloud cover, and/or variations in aerosol and water vapor. Nevertheless, an accurate estimation of surface radiative forcing requires the inclusion of state-of-art physical models and the consideration of the effects of clouds related to the longwave radiation, which is beyond the scope of this letter.
3.5. Comparison of satellite product with CMIP5 model outputs
The Coupled Model Inter-comparison Project 5 (CMIP5) collects model outputs from the general circulation models (GCMs) that are included in the Inter-governmental Panel on Climate Change (IPCC) the 5th Assessment Report (AR5) (Taylor et al 2012). Monthly surface downward and upward shortwave radiation data simulated by the 15 GCMs were used in this study (table 4). We selected the model scenario of the 'historical runs' with decadal outputs from 1981 to 2010.
Table 4. List of GCMs used in the comparison.
| GCM | Research group/Institution | Spatial resolutiona |
|---|---|---|
| BCC-CSM1.1 | Beijing Climate Center, China Meteorological Administration | 128 × 64 (∼2.8° × 2.8°) |
| CCSM4 | NCAR Community Climate System Model, CCSM version 4 | 288 × 192 (∼1.3° × 0.9°) |
| CanCM4 | Canadian Center for Climate Modeling and Analysis | 128 × 64 (∼2.8° × 2.8°) |
| CFSv2 | NOAA/NCEP National Centers for Environmental Prediction, CFSv2-2011 | 384 × 190 (∼0.9° × 0.9°) |
| CNRM-CM5 | Centre National de Recherches Meteorologiques/Centro Europeen de Recherche et Formation Avancees en Calcul Scientifique (CNRM/CERFACS) | 256 × 128 (∼1.4° × 1.4°) |
| FGOALS-s2 | LASG, Institute of Atmospheric Physics, Chinese Academy of Sciences | 128 × 108 (∼2.8° × 1.7°) |
| GEOS-5 | NASA Global Modeling and Assimilation Office | 144 × 91 (∼2.5° × 2.0°) |
| GFDL-CM2.1 | Geophysical Fluid Dynamics Laboratory | 144 × 90 (∼2.5° × 2.0°) |
| HadCM3 | Met Office Hadley Centre | 96 × 73 (∼3.8° × 2.5°) |
| IPSL-CM5A-LR | Institut Pierre-Simon Laplace | 96 × 96 (∼3.8° × 1.9°) |
| MIROC4h | Atmosphere and Ocean Research Institute (The University of Tokyo), National Institute for Environmental Studies, and Japan Agency for Marine-Earth Science and Technology | 640 × 320 (∼0.6° × 0.6°) |
| MIROC5 | 256 × 128 (∼1.4° × 1.4°) | |
| MPI-ESM-LR | Max Planck Institute for Meteorology (MPI-M) | 192 × 96 (∼1.9° × 1.9°) |
| MPI-ESM-MR | 192 × 96 (∼1.9° × 1.9°) | |
| MRI-CGCM3 | Meteorological Research Institute | 320 × 160 (∼1.2° × 1.2°) |
aThe spatial resolution is represented in the number of total grids for each model.
The shortwave albedo for Greenland from each GCM was aggregated in the same way as that applied to the satellite data based on equation (1). As the spatial resolutions of these data sets are different, we applied the land/water mask extracted from MODIS land cover (MCD12) at 0.05° spatial resolution for the year of 2000 to keep our results consistent among different GCMs.
Figure 6 illustrates the comparison of GLASS albedo and albedo from the simulation of CMIP5 models (statistics are tabulated in table 5). The model simulations were significantly different from the GLASS albedo products in magnitude (absolute bias > 0.05) for seven of the 15 models selected in this study. For the other eight models that were less biased, there were hardly any similarities in the trends in surface albedo to that observed by satellite observations. Any differences between the different albedo datasets may have resulted from the differences in the spatial resolution of the models, including the land/water mask effect and the ability to reflect changes in the ablation area. Datasets with finer resolutions had smaller biases (including CCSM4, MIROC4h, MIROC5, MRI-CGCM3, CFSv2, and CNRM-CM5). One explanation is that finer resolution data sets are better at simulating the changes in the ablation area, and hence the albedo feedback. GEOS-5 matched the satellite data quite well although it has a spatial resolution coarser than 2.0°. Five of the 15 GCMs captured the decreasing trend of surface albedo changes in Greenland over the last decade (significant at 90% confidence level). Only GEOS-5 showed a decreasing trend similar to the satellite data and was within the albedo accuracy requirement when compared to the satellite observations (absolute bias < 0.02).

Figure 6. Comparison of July albedo time series from GCMs simulations and satellite products for the entire study area of Greenland.
Download figure:
Standard image High-resolution image
Table 5. Statistics of July albedo from GCMs and GLASS products in 1981–2010. (Note: significance level—*: 90%; **: 95%; ***: 99%, others are not significant at 90% level.)
| GCM | Mean | STD | Trend (decade−1) |
|---|---|---|---|
| BCC-CSM1 | 0.7739 | 0.0076 | 0.006*** |
| CanCM4 | 0.7817 | 0.0079 | −0.003* |
| CCSM4 | 0.7187 | 0.0228 | 0.002 |
| CFSv2 | 0.7157 | 0.0031 | 0.000 |
| CNRM-CM5 | 0.6720 | 0.0064 | 0.001 |
| FGOALS-s2 | 0.7464 | 0.0055 | −0.003*** |
| GEOS-5 | 0.6905 | 0.0019 | −0.001*** |
| GFDL-CM2p1 | 0.6284 | 0.0074 | −0.001 |
| HadCM3 | 0.7395 | 0.0042 | −0.002*** |
| IPSL-CM5A-LR | 0.6785 | 0.0054 | −0.001 |
| MIROC4h | 0.6933 | 0.0185 | −0.004 |
| MIROC5 | 0.7061 | 0.0255 | −0.001 |
| MPI-ESM-LR | 0.7894 | 0.0059 | −0.002 |
| MPI-ESM-MR | 0.7900 | 0.0060 | −0.002* |
| MRI-CGCM3 | 0.6738 | 0.0199 | 0.002 |
| GLASS | 0.6841 | 0.0106 | −0.006*** |
4. Conclusion
This letter is an extension of previous studies (Box et al 2012, Stroeve 2001) and presented a study of the analysis of the surface albedo trend over Greenland from 1980s, using the 32-year GLASS albedo product. We found a decreasing trend in the surface albedo since the early 1980s, mainly occurring in the ablation area in southwest Greenland. Since 2000, the Greenland albedo is now decreasing at an accelerated rate, and is accompanied by an increase in surface temperature. This suggests that if temperature continues to increase more snow will melt and the associated albedo decrease may occur at higher elevations in the future. The ablation area could then expand towards inner Greenland as a result of the amplifying effect of albedo feedback. However, we acknowledge that there was a minimal temporal coverage of ground measurements before 2000, and this limits the accuracy assessment of GLASS albedo product. In addition, the reduced accuracy of cloud detection from AVHRR data may have caused some underestimation of the albedo over snow surfaces. As a result, it is possible that in this study the actual decreasing trend of surface albedo from the 1980s could actually be underestimated.
It is likely that the decrease in surface albedo has offset the cooling effect in the shortwave range caused by changes in the atmosphere (such as cloud coverage, aerosol loading, and water vapor content), and it is further possible that the greening and/or thickening of vegetation may amplify the warming of Greenland in the future, based on the positive feedback mechanism. CMIP5 GCMs will be used in the Inter-governmental Panel on Climate Change (IPCC) the fifth assessment report (AR5). It is of particular concern that the difference in spatial resolution between satellite data and those used in GCMs cannot adequately explain the magnitude and trend of the differences in surface albedo over Greenland, and it is important that this trend is understood for modeling purposes, as most models failed to simulate the recent trends. Incorporation of a long-term satellite albedo product (such as the GLASS albedo product) into existing models will be useful in improving our understanding and simulation of climate change over high-latitude regions.
Acknowledgments
This work was supported by the NOAA grant (NA09NES4400006) to the University of Maryland and the Chinese 863 project (2013AA122800) to Beijing Normal University. USDA is an equal opportunity provider and employer. We thank the GLASS, MERRA, CMIP5, and GC-Net teams for providing the data used in this study. The GLASS albedo product is produced by the Chinese 863 project (No. 2009AA122100) and available at http://glass-product.bnu.edu.cn/en/ and http://glcf.umd.edu/data/abd/. We appreciate the valuable comments and suggestions from our three anonymous reviewers.