
Abstract
Brazil aims to increase palm oil production to meet the growing national and global demand for edible oil and biodiesel while preserving environmentally and culturally significant areas. As land use change (LUC) is the result of complex interactions between socio-economic and biophysical drivers operating at multiple temporal and spatial scales, the type and location of LUC depend on drivers such as neighboring land use, conversion elasticity, access to infrastructure, distance to markets, and land suitability. The purpose of this study is to develop scenarios to measure the impact of land conversion under three different enforcement scenarios (none, some, and strict enforcement). We found that converting 22.5 million hectares of land can produce approximately 29 billion gallons (110 billion liters) of biodiesel a year. Of that, 22–71% of the area can come from forest land, conservation units, wetland and indigenous areas, emitting 14–84 gCO2e MJ−1. This direct land use emission alone can be higher than the carbon intensity of diesel that it intends to displace for lowering greenhouse gas emissions. This letter focuses narrowly on GHG emissions and does not address socio-economic–ecological prospects for these degraded lands for palm oil or for other purposes. Future studies should carefully evaluate these tradeoffs.
Export citation and abstract BibTeX RIS

Content from this work may be used under the terms of the Creative Commons Attribution 3.0 licence. Any further distribution of this work must maintain attribution to the author(s) and the title of the work, journal citation and DOI.
1. Introduction
Brazil is one of the largest producers of ethanol and biodiesel and biofuels for transportation is one of the fastest growing industries. In 2006 Brazil produced 69 million liters of biodiesel; today, Brazil produces close to 3 billion liters of biodiesel, the majority of which is produced from soybean oil (Barros and Giles 2012). The increase in biodiesel production is due to a mandate requiring all diesel fuel to contain biodiesel, the percentage for which increases every few years. With the projected increase in diesel consumption and increase in biodiesel mix, biodiesel use could be up to 12 billion liters by 2022 (Barros and Giles 2012). This does not include the increase in global demand, which is projected to triple over the next 30 years (OECD/IEA 2011).
Brazil has a long history of deforestation, primarily for cattle production but more recently for biofuel crops, resulting in landscape fragmentation and greenhouse gas (GHG) emissions from deforestation (Numata et al 2011). In an effort to minimize deforestation without stunting economic growth, the Brazilian government approved a bill to expand 4.3 million hectares of previously deforested lands to oil palm plantations3 (Osava 2010). Archer Daniels Midland, mining giant Vale, the state-run oil company Petrobras Biofuels, and several other major companies have announced significant Amazon palm oil deals or expressed interest to expand production in the region (Butler 2011).
The Brazilian agricultural agency (EMBRAPA) has done a suitability study that maps out the lands available for oil palm plantations and found over 30 million hectares of land suitable for oil palm plantations (EMBRAPA 2010). However, despite this enthusiasm, to date there is no detailed study of the potential land use impacts of oil palm expansion in the Amazon.
This study focuses on Pará, the second largest state in the country, located in the northern part of Brazil (see figure 1). Investigating Pará is especially revealing because the majority of the land deemed suitable for oil palm expansion by the government is located in this state. This study intends to: (1) identify the suitable areas for oil palm production; (2) identify environmentally and culturally important lands (conservation units, indigenous lands, forestland, and wetland) then project likely converted areas under three different enforcement scenarios; and (3) estimate the associated carbon emissions from land use (LU) and land use change (LUC). We find that, depending on the level of enforcement, oil palm expansion could lead to 22–71% conversion of forest land, conservation units, wetland and indigenous areas, which may emit between 14 and 84 gCO2e MJ−1.

Figure 1. Study area: Pará, Brazil. In the smaller map (left), yellow is the national boundary for Brazil and red is the state boundary for Pará.
Download figure:
Standard image High-resolution image1.1. Biofuel and environmental policies
Over the past half-century the Brazilian government created several programs to respond to social and economic issues, such as the oil crisis of the 1970s, social welfare of small farm owners, and energy independence. For example, the Pro-Alcohol Program was created to promote ethanol production through subsidies and tax breaks to farmers and distributors in response to the oil crisis in the 1970s (César and Batalha 2010, Langevin 2010). In 2004 President Luiz Inácio Lula da Silva created Brazil's Biodiesel Production and Use Program (PNPB). The goals of the program include: increasing energy security, reducing inequality, generating jobs, improving the environment and spurring economic growth (César and Batalha 2010). The PNPB is responsible for programs like B2 and B5. The B2 and B5 programs are laws that mandate that mineral diesel contain 2% biodiesel; in 2010 the mandate was increased to 5% biodiesel, increasing biofuel demand to 3 billion liters (César and Batalha 2010).
In addition to the PNPB, Brazil pledged to reduce GHG emissions at the 2009 United Nations Framework Convention on Climate Change in Copenhagen. It sets a goal to reduce deforestation by 80% by 2020 and to reduce emissions to 1994 levels by 2020 (NRDC 2013). Recent estimates show that Brazil is the fourth largest emitter of GHG emissions with 2842 million metric tonnes of CO2 emissions, contributing 7% of the global emissions (NRDC 2013). The majority of the emissions comes from deforestation, most of which is for cattle ranching (Winrock International 2009). From 2000 to 2007 over 150 000 square miles of the Amazon was deforested (an area roughly equivalent to the size of California).
A significant and notable environmental policy in reducing land use change in Brazil is the forest code. The forest code is the preservation of certain environmentally significant areas, implemented in 1965 and has undergone various amendments (Sparovek et al 2010, Andrade and Miccolis 2011)—see table S1 in the supporting information (SI) (available at stacks.iop.org/ERL/8/044031/mmedia) for a more detailed review. There are two significant sections to this code—preservation of legal reserves and permanent preservation areas (APP). According to the forest code, landowners must preserve 20% of the forested land, also known as 'legal reserves'; the preservation requirement goes up to 80% for landowners in the Amazon (Andrade and Miccolis 2011). The second section of the forest code defines APP as: 'areas adjacent to rivers or natural or artificial reservoirs, and hilltops and hillside properties with an incline steeper than 45°' (Sparovek et al 2010). The APP buffers have also been decreased under the change in the forest code legislation in 2011—reducing the buffer of rivers to almost half and removing protection of steep lands (Nazareno 2013). The forest code has done poorly in practice because of weak enforcement; therefore some have voiced their skepticism of the efficacy of the revised legislation (Butler 2011, Andrade and Miccolis 2011).
1.2. Oil palm in Brazil: potential benefits
The environmental and economic benefits of oil palm make it a very attractive energy crop. Currently the oil palm market value is high and there are few competitors on the market (Andrade and Miccolis 2010). Oil palm also has a much higher yield than other oil crops, averaging 3.7 t ha−1 (with up to 5–6 t ha−1, here we assume 10 t ha−1 based on Lapola et al 2010), compared to other popular oil crops. For example, soybean where the yield of soybean oil averages 0.4 t ha−1 since it is a by-product and the main product is soybean meal for animal feeds (Andrade and Miccolis 2011, Basiron 2007). It requires little new technology, meaning it can use existing infrastructure and does not require expensive equipment to produce and harvest. Instead, oil palm is a very labor-intensive crop; this is seen as an economic benefit because it creates a demand for highly skilled workers, generating more income and job security. The low long-term production costs are associated with oil palm's significantly longer cycle than other oil crops: oil palm has a cycle of 20–25 years, compared to soybean which is a couple of months (Andrade and Miccolis 2010, Clay 2004, Wicke 2011).
As for the environmental benefits, oil palm is a perennial that can increase biodiversity if converted from degraded or pastureland (Fitzherbert et al 2008). It can also improve soil fertility, and reduce the potential of soil erosion and leaching (Gibbs et al 2008, Wicke 2011). It is a low maintenance plant, and grows well even in poor soil conditions with little fertilizer and pesticide needed (Andrade and Miccolis 2010, Clay 2004, Wicke 2011). Not only are oil palms considered a low maintenance plant, they are considered a carbon pool estimated to be around 35 t C ha−1, or as high as 55 t C ha−1 (Germer and Sauerborn 2006, Brinkmann 2009, IPCC 2006, Carlson et al 2012, Henson et al 2012).
1.3. Potential issues
Like other oilseed crops, fertilizers and pesticides are generally used for oil palm plantations. Oil palm plantations generally use less fertilizer than other oilseed crops (Clay 2004). However, tropical forest soils sometimes have nutrient deficiencies and acidity levels not suitable for agricultural crops—this may result in more fertilizer use for oil palm plantations (Smithson and Giller 2002). Studies show that oil palm can grow on degraded lands with little loss to yield but actual empirical data is scarce and there could be a need for fertilizer and pesticide use, which can contribute to water and air pollution (Wicke 2011, Clay 2004). Oil palm plantations generally do not need pesticides, but they were commonly used in Indonesia because of a rat infestation in the plantations (Clay 2004).
Also, when considering land conversion, forestland is highly desirable because trees can be cut and sold; in the case of Southeast Asia, many farmers took advantage of forestland as extra income from selling trees, whereas degraded lands may require more maintenance and preparation depending on the current land use (Clay 2004).
Some researchers and environmentalists are concerned that deforestation rates will increase with the expansion of oil palm plantation without stricter enforcement in the Amazon. Sparovek et al (2010) looked at existing policies, specifically the forest code, and used spatial data and analysis to determine if these policies were successful. They found that there is 'little protection' in some areas and some policy scenarios (such as reduction of the forest code) could change the protected area which could result in further deforestation and degradation.
A significant element missing from EMBRAPA's suitability study is proximity to transportation infrastructure. Extraction of palm oil must happen no longer than 24 h after harvest (Andrade and Miccolis 2011)—this means that the plantations must be close to the mills, potentially resulting in more mills and/or transportation infrastructure to meet the requirements for palm oil extraction.
2. Oil palm suitability and carbon estimates
2.1. Forest cover and carbon distributions
Brazil has one of the largest carbon pools in the world, with 76% forest cover (table 1). The land cover map used for this analysis is the Global Land Cover Map based on the SPOT-4 VEGETATION VEGA 2000 dataset (EC JRC 2010). The total area of land deforested in Pará since 1997–2011 is close to 19% of the land area of Pará, as shown in figure 2.
Table 1. Land area of Pará, Brazil and the breakdown by land type. (Note: estimates calculated using ArcGIS. Total is over 100% because there is overlap with forestland and conservation units and indigenous areas.)
| Per cent area of Pará (%) | Total area of Pará (sq. miles) | |
|---|---|---|
| Pará | — | 481 700 |
| Forest | 76 | 366 092 |
| Conservation units | 4.7 | 22 640 |
| Indigenous areas | 23 | 111 754 |
| Wetlands | 2 | 9 634 |
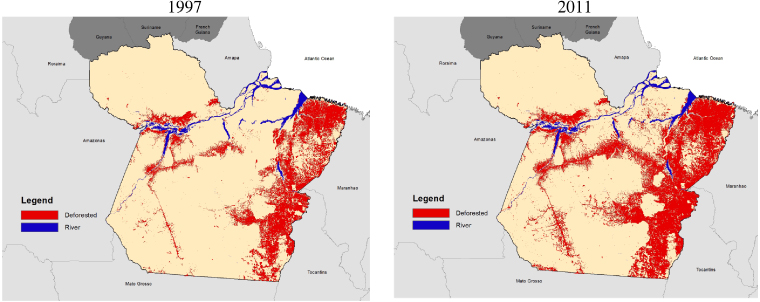
Figure 2. Deforested areas in Pará, Brazil (1997–2011).
Download figure:
Standard image High-resolution imageTable S2 in the SI (available at stacks.iop.org/ERL/8/044031/mmedia) lists our data sources. Spatial distribution of forest land, conservation units, indigenous areas, and wetlands are shown in figure S1 (available at stacks.iop.org/ERL/8/044031/mmedia). Biomass carbon data is from Ruesch and Gibbs (2008), and the soil carbon data is from the Harmonized World Soil Database (HWSD). We used ArcGIS to estimate the forest biomass and soil carbon stock for forestland, conservation units, indigenous lands, and wetlands (figure 3). We estimate that forest biomass carbon averages 158 t C ha−1 and soil carbon averages 52 t C ha−1 (for the top 30 cm). These values are in the lower range of values found in the literature (Hassan et al 2011, Bernoux et al 2002, Sommer et al 2000, Sisti et al 2004, Saatchi et al 2011, IPCC 2006).

Figure 3. Forest biomass and soil carbon.
Download figure:
Standard image High-resolution image2.2. Oil palm suitability in Pará, Brazil
EMBRAPA conducted a suitability analysis to identify the location and amount of land available for oil palm, but failed to include land type and proximity to infrastructure in their analysis, as well as potential areas of land conversion (Filho and Motta 2010). Oil palm suitability assessments are widely available for Southeast Asia and to a lesser extent in Africa, but such assessments are much less common for South America. The parameters of suitability for this assessment only measure land and climate suitability. It does not include social or political factors such as land rights. They are based on existing suitability studies for Brazil and Southeast Asia (Arshad et al 2012, Rahmawaty et al 2012, Ritung et al 2007, Corley and Tinker 2003) (see table S3 available at stacks.iop.org/ERL/8/044031/mmedia suitability criteria). The spectrum of suitability is applied to three land type parameters: slope, soil type, and drainage (figure S2 available at stacks.iop.org/ERL/8/044031/mmedia); and two climate parameters: temperature and precipitation (figure S3 available at stacks.iop.org/ERL/8/044031/mmedia). Our suitability map is consistent with existing studies—the majority of the undeveloped land in Pará ranges from moderately suitable to suitable for oil palm plantations (figure 4).
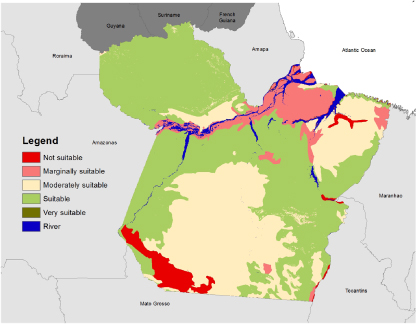
Figure 4. Combined land and climate suitability for oil palm in Pará, Brazil.
Download figure:
Standard image High-resolution image3. Land use change model: data and methods
3.1. Model and data
UPLAN is an open source model developed by the Department of Environmental Science and Policy at UC Davis for the California Department of Transportation (Johnston et al 2007). The model operates with ESRI ArcGIS to model land use patterns. The UPLAN model was chosen for this study because it is an open source model that has flexible parameters that can easily be adjusted for this study. The specific inputs are attractors, discouragers, masks, and the general plan. The attractors are elements that make development attractive (e.g. transportation infrastructure), discouragers are areas that are not attractive for development (e.g. unsuitable soil), masks are areas that are undevelopable (e.g. water bodies), and the general plan is used to determine where potential growth can occur.
The spatial data for this study is from MODIS, WHRC, HWSD, DIVAGIS, and WorldClim (see descriptions and sources in table S2 in the SI available at stacks.iop.org/ERL/8/044031/mmedia); the population and employment data were taken from IBGE census data. The source data years range from 2000 to 2010. One key element of suitability was added as an attractor in the model: transportation infrastructure. As stated previously, road proximity is a key in identifying the locations of which lands will likely be converted. The average oil palm plantation in Indonesia and Malaysia was within 15 km of a road, but also being as far as 60 km away (Clay 2004).
3.2. Method
To understand the potential impacts of land expansion, three scenarios based on enforcement were created: (1) no enforcement; (2) some enforcement; and (3) strict enforcement. All assume a base scenario of 2010 and 30-year time frame. For each scenario, there was a set of attractors, discouragers, and masks (table 2). An attractor is a parameter that makes an area more attractive for expansion, for example, roads. The level of attraction for an attractor is based on proximity—the farther away the pixel is to the attractor is less attractive for land use conversion. Each pixel is assigned a 'weight' for the attractor that determines the level of attractiveness; the weight assignment is based on intervals of proximity to the attractor. For example, consider the following road intervals: 0–15, 15–30, 30–45, 45–60 km, and over 60 km. Pixels that are within 15 km of an existing road are more likely to be converted and therefore are given a higher 'weight'. Discouragers work in a similar fashion, but instead of pixels being more attractive, they are assigned a negative weight (to discourage land conversion). Each proximity interval for an attractor or discourager was assigned a 'weight' that determines the level of attractiveness of the land. The weights range from 0 to 100 (with 0 being 'not suitable' and 100 being 'very suitable'). The weights were assigned to all suitability parameters (soil, slope, drainage, air, and temperature).
Table 2. UPLAN scenarios (no enforcement, some enforcement, strong enforcement) and the attractors, discouragers, and masks.
| Scenario 1 | Scenario 2 | Scenario 3 | |
|---|---|---|---|
| Level of enforcement | No enforcement | Some enforcement | Strong enforcement |
| Attractors | • Land and climate suitability | • Land and climate suitability | • Land and climate suitability |
| • Proximity to agriculture, roads, savannah | • Proximity to agriculture, roads, savannah | • Proximity to agriculture, roads, savannah | |
| • Previously deforested lands | • Previously deforested lands | ||
| Discouragers | None | • Conservation units | None |
| • Indigenous areas | |||
| Masks | None | None | • Conservation units |
| • Indigenous areas | |||
The level of enforcement is determined by the weight given to the discouragers and masks, which are: previously deforested lands, conservation units, and indigenous areas. In the 'no enforcement' scenario, there are no discouragers or masks; the likelihood of oil palm expansion is based on the land and climate suitability and proximity to transportation infrastructure (table 2). The 'some enforcement' assumes that some development will occur on previously deforested lands (added as an 'attractor'), conservation units and indigenous areas as 'discouragers', meaning it is less likely to be converted if there are other lands that are just as suitable. The 'strict enforcement' scenario shows that oil palm plantations can only occur on previously deforested lands, while conservation units and indigenous areas are strictly off-limits. Each scenario was then overlaid with forestland, conservation units, indigenous areas, and wetlands to determine the percentage and area of land lost under each scenario and its associated carbon emissions.
3.3. Assumptions and limitations
Note the following assumptions and limitations: the population and employment growth is based on historical data, the model assumed a starting population of 7.5 million people and average growth of 1% per year (IBGE 2010); dirt roads are not included because the data are unavailable so agricultural land is used as a proxy for dirt roads; growth is based on current infrastructure and development because a general plan was unavailable, therefore future projects or current construction (transportation infrastructure, new plantations) are not included. The model does not include any large scale or corporate development (or other economic parameters); this is important because large corporations have taken interest in oil palm production. For example, Vale, a Brazilian mining company, is looking to expand oil palm plantations in Pará to 60 000 ha by 2015 (Lane 2012). Finally, this suitability study only measures land and climate suitability, it does not include social or political factors such as land rights.
4. Analysis of results and discussion
4.1. Key results
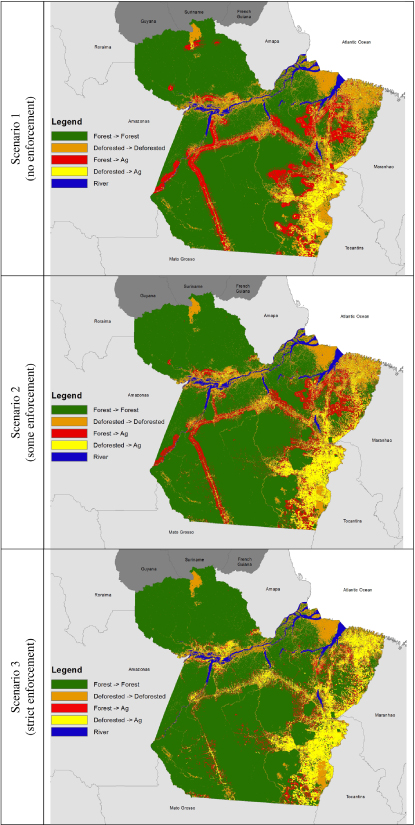
The total land conversions are fixed across all scenarios: 86 706 square miles of land (22.5 million hectares) for oil palm plantations, which translates to over approximately 29 billion gallons of biodiesel per year. Table 3 summarizes the loss of forest, conservation units, indigenous areas, and wetland. Loss of forest biomass carbon and forest soil carbon associated with the three scenarios are shown in table 4. Figure 5 shows the distribution of land converted under each scenario—the primary difference between the scenarios is a shift from most land conversion occurring on forested land in scenario 1, to almost a complete reversal in scenario 3.
Table 3. Land use change projections by scenario.
| Scenarios | ||||||
|---|---|---|---|---|---|---|
| (1) No enforcement | (2) Some enforcement | (3) Strict enforcement | ||||
| Per cent | Land area (sq. mi.) | Per cent | Land area (sq. mi.) | Per cent | Land area (sq. mi.) | |
| Land converted | 18% | 86 700 | 18% | 86 700 | 18% | 86 700 |
| Of the land converted | ||||||
| Previously deforested land | 29% | 25 000 | 46% | 40 000 | 78% | 68 000 |
| Forest | 62% | 54 000 | 48% | 42 000 | 22% | 19 000 |
| Conservation units | 0.5% | 400 | 0.3% | 300 | 0% | 0 |
| Wetlands | 2.1% | 1 800 | 1.7% | 1 400 | 0.4% | 400 |
| Indigenous lands | 1% | 900 | 0.9% | 800 | 0% | 0 |
Table 4. Carbon emissions by scenario.
| Scenario 1 | Scenario 2 | Scenario 3 | |
|---|---|---|---|
| Carbon loss/gain | |||
| Loss of forest biomass carbon (MMtC) | 2044 | 1590 | 719 |
| Loss of forest soil carbon (MMtC) | 392 | 305 | 134 |
| Oil palm plantations gained (MMtC) | −786 | −786 | −786 |
| Soil carbon loss from deforested land | 84 | 135 | 229 |
| Carbon emissions | |||
| Average loss of carbon (t C ha−1) | 77 | 55 | 13 |
| Average carbon intensity from direct LUC (gCO2 MJ−1) | 84 | 60 | 14 |
Depending on the type of enforcement, oil palm expansion can potentially be a source of more carbon emissions. This is seen most clearly in scenario 1, no enforcement, where less than a third of the land conversion will occur on previously deforested lands (figure 5). As enforcement becomes more stringent (scenarios 2 and 3) a larger percentage of oil palm plantations occur on previously deforested lands (46% and 78%, respectively). The results show that there is a significant drop in the amount of forest land lost to conversion from scenario 1 to 3 (62%, 22%, respectively), suggesting that encouraging oil palm plantations on deforested lands could drastically reduce the conversion of forest land, thus reducing emissions from deforestation.
Figure 5. Land use change projections by scenario: no enforcement, some enforcement, and strict enforcement.
Download figure:
Standard image High-resolution image
Direct land use emissions in scenario 1, without the consideration of additional emissions associated with cultivation, process and refining, and transport and distribution of 15.8–54.8 gCO2e MJ−1 depending on the processes and fuel types, is already close to the carbon intensity of diesel that it intends to displace, rated at 83.8 gCO2e MJ−1 by the European Commission (EC 2009). Therefore, the total lifecycle carbon intensity including direct land use emissions plus production and use will greatly exceed that of petroleum diesel in scenarios 1 and 2.
4.2. Uncertainties
In this analysis, the uncertainty comes from the following sources.
- (1)Climate and land data. This includes the assessment of land and climate suitability, status of previously deforested land, locations of conservation units and indigenous areas, and yield of different land types. Data were unavailable for suitability for oil palm in Brazil; therefore suitability for oil palm is based on studies based in Southeast Asia. The data used for this analysis are based on available spatial data, but most of the land cover and conservation data dates back to 2000. Other data, such as suitability parameters (soil, slope), are more recent, from 2010. We assume an average yield of 10 Mg ha−1 based on Lapola et al (2010), which is significantly higher than the 3.7–6 reported in the literature.
- (2)Model assumptions. Model uncertainty essentially overlaps with our scenario analysis. This includes the selection of weights assigned to land and climate suitability, and proximity to agriculture, roads and savannah. Transportation infrastructure is important when trying to identify areas that are vulnerable to land use change. For this study we used paved roads because data for dirt roads were not available. We recommend using data for dirt roads to improve the analysis.
- (3)Carbon estimates. A more extensive review of forest biomass carbon, soil carbon, carbon sequestration rate of oil palm, and carbon loss factors after land conversion is included in the SI (available at stacks.iop.org/ERL/8/044031/mmedia). Compared with the literature, our average forest soil and biomass carbon values are on the lower end. Soil carbon is assumed to be 50% loss from forest to cropland (Guo and Gifford 2002), but this can vary widely. Oil palm carbon sequestration values vary, 3–55 t C ha−1; we use the 35 t C ha−1 value because it was the average based on a study of 51 oil palm plantations in Southeast Asia (Germer and Sauerborn 2006). We assume the soil carbon value of deforested land is 50% of the original forest. If most of the deforested land is marginal or degraded land, the soil C value can be as low as 1–6 t C ha−1 (Wicke et al 2008, Hassan et al 2011). If these values were used, then soil C loss can be lower than we estimated here.
5. Conclusion
The importance of this study is in using a bottom-up approach and spatial data analysis to assess the potential impacts from biofuel policies. This model uses a physical process to identify land use change area and impacts. Economic models of land use change associated with biofuel policies rely on assumptions that the conversion of lands within a given region for biofuel production are driven solely by economics, which are determined by land transformation elasticities among different land types (e.g. forest, crop land, and pasture), and the profitability of land conversion, which depends on yields and the cost of conversion. These values typically lack regional specification, and are often the same across all crop types (Laborde and Valin 2012, Taheripour and Tyner 2013). In reality, as LUC is a result of complex interactions between social, economic and biophysical drivers operating at multiple temporal and spatial scales, the type and location of LUC depend on several biophysical and socio-economic drivers such as neighboring land use, conversion elasticity, access to infrastructure, distance to markets, and land suitability, which change in space and time (Wicke et al 2013).
Our study does not consider the impacts of indirect land use change due to oil palm expansion in Brazil. Lapola et al (2010) looks at the overall land use impacts within Brazil due to increased biofuel production in Brazil. They conclude that certain crops, particularly sugarcane ethanol and soybean biodiesel, can have very high indirect land use impacts by pushing the displaced food croplands into the Amazonian forests but the risk of such indirect land use change in Brazil is low for oil palm in Pará, Brazil.
This is a preliminary study and can be improved by using higher resolution spatial data for roads and land use, incorporating market and economic factors into the model, and including more social/political parameters. This letter focuses narrowly on GHG emissions and does not address socio-economic–ecological (i.e. sustainable) prospects for these degraded lands for palm-based edible oil or biofuel production or for other purposes. Though they are beyond the scope of the current study, future studies should carefully evaluate these tradeoffs.
Acknowledgments
The authors acknowledge funding support from the California Air Resources Board. The second author also acknowledges funding support by NextSTEPS, Institute of Transportation Studies, University of California, Davis. We are grateful for Nathan Roth's help with the UPLAN model. We are also grateful to the anonymous reviewers for their input.
Footnotes
- 3
Presidential Declaration No 7172 (2010). At the time of this letter enforcement and incentive programs have not been passed.