
Abstract
The United Nations Framework Convention on Climate Change (UNFCCC) defined the technical and financial modalities of policy approaches and incentives to reduce emissions from deforestation and forest degradation in developing countries (REDD+). Substantial technical challenges hinder precise and accurate estimation of forest-related emissions and removals, as well as the setting and assessment of reference levels. These challenges could limit country participation in REDD+, especially if REDD+ emission reductions were to meet quality standards required to serve as compliance grade offsets for developed countries' emissions. Using Panama as a case study, we tested the matrix approach proposed by Bucki et al (2012 Environ. Res. Lett. 7 024005) to perform sensitivity and uncertainty analysis distinguishing between 'modelling sources' of uncertainty, which refers to model-specific parameters and assumptions, and 'recurring sources' of uncertainty, which refers to random and systematic errors in emission factors and activity data. The sensitivity analysis estimated differences in the resulting fluxes ranging from 4.2% to 262.2% of the reference emission level. The classification of fallows and the carbon stock increment or carbon accumulation of intact forest lands were the two key parameters showing the largest sensitivity. The highest error propagated using Monte Carlo simulations was caused by modelling sources of uncertainty, which calls for special attention to ensure consistency in REDD+ reporting which is essential for securing environmental integrity. Due to the role of these modelling sources of uncertainty, the adoption of strict rules for estimation and reporting would favour comparability of emission reductions between countries. We believe that a reduction of the bias in emission factors will arise, among other things, from a globally concerted effort to improve allometric equations for tropical forests. Public access to datasets and methodology used to evaluate reference level and emission reductions would strengthen the credibility of the system by promoting accountability and transparency. To secure conservativeness and deal with uncertainty, we consider the need for further research using real data available to developing countries to test the applicability of conservative discounts including the trend uncertainty and other possible options that would allow real incentives and stimulate improvements over time. Finally, we argue that REDD+ result-based actions assessed on the basis of a dashboard of performance indicators, not only in 'tonnes CO2 equ. per year' might provide a more holistic approach, at least until better accuracy and certainty of forest carbon stocks emission and removal estimates to support a REDD+ policy can be reached.
Export citation and abstract BibTeX RIS

Content from this work may be used under the terms of the Creative Commons Attribution 3.0 licence. Any further distribution of this work must maintain attribution to the author(s) and the title of the work, journal citation and DOI.
1. Introduction
The United Nations Framework Convention on Climate Change (UNFCCC) has formally established that reducing emissions from deforestation and forest degradation (REDD+) is a legitimate mitigation option (UNFCCC 2010). Given the central role of REDD+ within the new climate regime, great importance has been given to technical aspects of REDD+. It has been agreed that REDD+ will be implemented in a three-phase approach: (1) readiness; (2) demonstration activities and capacity building; and (3) result-based actions that would be monitored and verified (UNFCCC 2010). The performance of result-based actions would be evaluated relative to a forest reference emissions level (REL) or forest reference level (RL) associated with a robust, consistent, transparent, and as accurate as possible national forest monitoring system and with an information system on social and environmental safeguards (UNFCCC 2010). In Durban, the REDD+ decision stipulates that these forest REL and/or RL expressed in tonnes of carbon dioxide equivalent per year are benchmarks for assessing each country's performance in implementing REDD+ activities, and that they should be updated periodically (UNFCCC 2011). REDD+ payments would then be made on the basis of the achieved emissions reductions or increased removals from forests.
In the short-term, major technical constraints hinder reliance on result-based payments for REDD+. Romijn et al (2012) assessed national forest monitoring capabilities in the context of REDD+ for tropical non-annex I countries and show that only 4 out of 99 countries (Argentina, China, India and Mexico) have a 'very high' capacity to monitor both forest area change and forest carbon inventory. Encouragingly, these authors noted improvements in the ability to report on carbon pools between 2005 and 2010 (Romijn et al 2012). It is hoped that on-going major REDD+ readiness efforts, which are supported by bilateral grants and loans, by the World Bank's Forest Carbon Partnership Facility and by UN-REDD, will further improve the situation.
The scientific challenges that have been identified pertain to the need for improved accuracy of estimates of emissions and removals from land use and the forestry sector and point to uncertainties with respect to measuring forest areas, forest area changes and trends (Achard et al 2007, Fearnside 2000, Grainger 2008, 2011, 2009, Achard et al 2004, Defries et al 2002), forest carbon density (Gibbs et al 2007, Houghton 2005, Pelletier et al 2012), the fate of carbon after deforestation and degradation (Earles et al 2012), and the activities and processes that are included in the accountability of land-use change fluxes (Houghton 2010, Ramankutty et al 2007). Concerted efforts are required to estimate forest carbon stocks and emissions with the accuracy needed to support a REDD+ policy (Baker et al 2010), something that may still take years to be achieved. At the same time, there is a real need to take action and tackle immediately this globally important source of emissions. Given the potential contribution of REDD+ in achieving the ultimate objectives of the UNFCCC and the high level of uncertainty that plagues emissions estimates from the forest sector, reliable but feasible performance indicators are urgently needed. Desirable characteristics of performance indicators should be in agreement with the five UNFCCC principles, also laid down in IPCC good practice guidelines, in terms of their transparency, consistency, completeness, comparability and accuracy (IPCC 2003) and efforts to reduce uncertainty around emission reductions should prioritize those sources of uncertainty that have the greatest influence on overall uncertainty (IPCC 2006), and for REDD+, on emission reductions.
Due to the aforementioned limitations, both in terms of countries' capabilities and existing scientific knowledge, simplified proxies could be needed to estimate REDD+ performance in the most cost-effective manner, as a first step towards stepwise improvement of monitoring capacities. In response to this need, Bucki et al (2012) developed a simplified REL model, which they termed the 'matrix approach,' to estimate emissions in the context of REDD+ and illustrated their approach using data from the Democratic Republic of Congo. The matrix approach entails three steps: (1) the use of land-cover maps to differentiate between intact and non-intact forests using fragmentation as a proxy for forest degradation; (2) construction of a simple transition matrix between intact forest lands, non-intact forest lands and other lands to estimate changes in area and to address the different REDD+ activities (see table 1); and (3) the development of simplified reporting for result-based REDD+ activities using default emission factors (Bucki et al 2012). These authors hope that the matrix approach would facilitate participation in result-based REDD+ payments favouring early actions and fostering a gradual build-up of capacities.
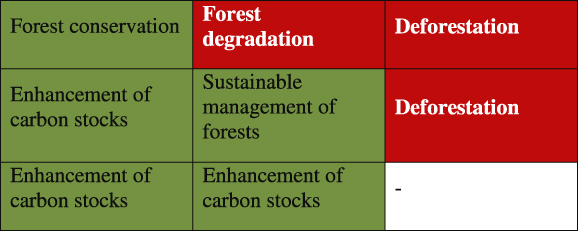
Table 1. Land-use change matrix with IPCC land-use change nomenclature (Bucki et al 2012) IFL: intact forest land, NIFL: non-intact forest land, OL: other land (= non-forest land). The nine land-use change areas associated with the matrix were coupled to a bookkeeping carbon model to compute emissions due to land-use change in Panama over the 1992–2000 period. Results are for (a) areas (103 ha) and (b) associated emissions (106 MgCO2 ha−1) computed for the REL and (c) corresponding REDD+ activities. Values in between parenthesis are the sensitivity for each matrix element. The two values of the key parameters selected to compute the total uncertainty were Emi = Maxj{ΔEmij}/REL: time interval (8/10 yrs), IFL stocks (168.6/204.6 MgC ha−1), IFL increment (−0.16/0.75 MgC ha−1 yr−1), NIFL stocks (120.0/102.3 MgC ha−1), NIFL increment (4.43/2.37 MgC ha−1 yr−1); for areas: edge width (1000/250 m), resolution (250/50 m), fallows (= forests/other lands).
| IFL 2000 | NIFL 2000 | OL 2000 | |
|---|---|---|---|
| (a) | |||
| IFL 1992 | 2829 (1374) | 311 (207) | 239 (173) |
| NIFL 1992 | 133 (175) | 521 (846) | 300 (182) |
| OL 1992 | 73 (161) | 396 (224) | 2596 (1156) |
| (b) | |||
| IFL 1992 | −7.77 (9.43) | 11.65 (9.03) | 17.49 (7.53) |
| NIFL 1992 | −4.97 (3.85) | −4.53 (3.93) | 10.69 (4.62) |
| OL 1992 | 0 | −16.72 (6.09) | 0 |
| (c) |
|
||
Conceptually, uncertainty stems both from random errors, which are inversely proportional to precision, and from systematic errors (or bias), which refer to a lack of accuracy (Frey et al 2006). Precision is the agreement among repeated measurements, while accuracy is the agreement between the true value and the average of repeatedly measured estimates. The two concepts are fully independent. Random errors are due to the variability in observations compared to the mean which can be reduced by taking sufficient observations (increase the sample size). This is not the case with systematic error. Additional observations do not reduce systematic error, and so generally it comes to dominate the overall error. Systematic errors, or the lack of accuracy, may arise because of imperfections in conceptualization, models, measurement techniques, or other ways to make inferences from the data. The lack of accuracy is often much harder to quantify, involving subjective processes, as we are unaware of the true value (Morgan and Henrion 1990). According to IPCC guidelines (2006), uncertainty analysis is an essential component of greenhouse gas emission and removal inventories. Being explicit about uncertainty entails estimating uncertainty around quantities, e.g., forest carbon stocks, about the appropriate functional form or models, e.g., allometric equations, and about disagreements among experts on both quantities or models (Morgan and Henrion 1990).
We chose to use the matrix approach in order to perform a sensitivity and uncertainty analysis using Panama as a case study. We acknowledge that other approaches could have been used but we consider that the Matrix approach has valuable qualities including its simplicity, its inclusion of the five REDD+ activities and its favour in earlier actions and wide participation by developing countries. Furthermore this research was stimulated by on-going discussions and exchanges with some of the proponents of the matrix approach. The use of this approach allowed us to characterize different types of uncertainties and discuss appropriate performance indicators. In an earlier paper, we estimated using probabilistic approach an overall uncertainty of ±43.5% between the 95% confidence interval and the mean estimated emissions due to land-cover changes in Panama using the country's own data (Pelletier et al 2011). The most important source of uncertainty that we uncovered was associated with forest carbon density. In this previous study, we specifically addressed uncertainty in input data, that is random and systematic errors in emission factors and activity data, hereafter called 'recurring' sources of uncertainty because they exist independently of the model used to calculate forest-related emissions and removals. In contrast, the present paper distinguishes between 'modelling' sources of uncertainty, which refers to model-specific parameters and assumptions and the 'recurring' ones. This study provides an evaluation of the overall uncertainty around emissions from land-cover change at a country level, is different from previous research in developing countries (except Pelletier et al 2011) which evaluated theoretical sources of error or/and addressed emissions from deforestation alone. We discuss our results in the light of the five UNFCCC principles for estimating and reporting emissions and removals of greenhouse gases (Transparency, Consistency, Completeness, Comparability and Accuracy) in terms of their relevancy for REDD+ estimation and reporting with the goal to achieve more robust and credible estimates.
2. Materials and methods
Panama is a small Central American country that encompasses 7.4 million hectares. Official forest assessment reports indicate that the territory, 55% of which was covered by forested lands in 2010, has been undergoing net deforestation rates amounting to −1.12% per year over the 1990–2000 period, and −0.35% over 2000–2010 (Forest Resources Assessment 2010) but which represents a relatively small share of C emissions in South and Central America deforestation (Eva et al 2012). While the first national inventory of greenhouse gases (GHG) identifies the land-use, land-use change and forestry (LULUCF) sector as the main source of GHG emissions in the country, the second national communication on GHG indicated that the LULUFC sector is a net sink. Reported fluxes thus changed from +8.9 × 10⁶ Mg CO2eq for the year 1994 (ANAM 2000) to −7.0 × 10⁶ Mg CO2eq for the year 2000 (ANAM 2011), which has a large effect on the country's carbon budget. It is not clear at this point however if this change is due to methodological modifications or to actual reductions.
2.1. Land-use/cover change emission model
The matrix approach relies on a three-category land-cover transition matrix including 'intact forest land' (IFL), 'non-intact forest land' (NIFL) and 'other land' (OL) (table 2; more details in the supporting information (SI) section S1, available at stacks.iop.org/ERL/8/034009/mmedia) to estimate land-use change emissions. As a benchmark comparison the REL model that we had developed earlier for Panama considered five land-cover classes and stratified the country into eight different life zones or forest types for a total of 40 land-cover categories (Pelletier et al 2011). To apply the matrix approach, we used two land-cover maps of Panama (1992 and 2000, based on Landsat TM and ETM+ images) that were produced by the National Environmental Authority of Panama (in Spanish: Autoridad Nacional del Ambiente, ANAM) and reclassified the ANAM land-cover categories into 'forest' and 'other land' (i.e., non-forest) rasterising the maps using ArcGIS v.10 (ESRI 1999–2010). The 'forest' category was then separated into IFL and NIFL based on a distance threshold or Edge width value using the Morphological Spatial Pattern Analysis algorithm (Soille and Vogt 2009) of GUIDOS v.1.3. (JRC 2012) (figure 1). This software package segments binary patterns (forests) into seven mutually exclusive categories: Core, Islet, Loop, Bridge, Perforation, Edge and Branch. The MSPA classification provides a proxy for distinguishing Intact forests and non-intact forests, and where IFL is represented by the core forests (Core category) while the NIFL is identified by non-core forests i.e. as forests possibly exposed or vulnerable to degradation (Bucki et al 2012). We then constructed a 3 × 3 land-cover transition matrix (IFL, NIFL, OL) and estimated land-cover changes between 1992 and 2000 (table 1; details in SI section S2 available at stacks.iop.org/ERL/8/034009/mmedia), using Grass toolbox v.6.4 (Grass 2011). The land-cover transition matrix was coupled with a bookkeeping carbon model that included carbon stocks and carbon stock increments for IFL and NIFL to compute emissions and removals attributable to land-cover change (details in SI section S3 available at stacks.iop.org/ERL/8/034009/mmedia).
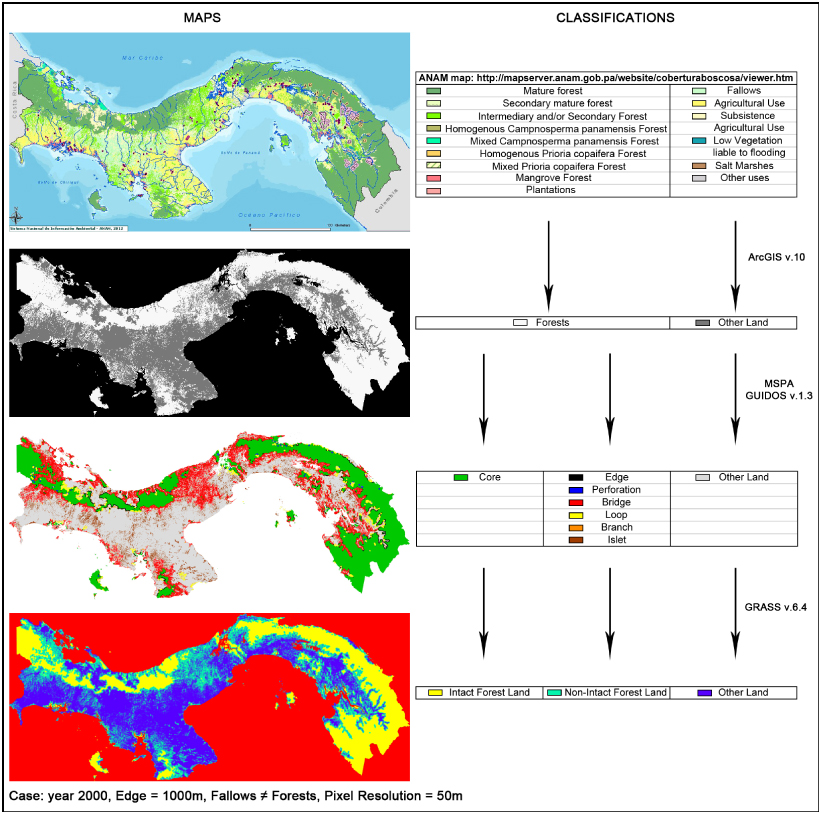
Figure 1. Maps of Panama illustrating the reclassification methodology in order to replicate the procedure described in Bucki et al (2012). The Morphological Spatial Pattern Analysis was used to distinguish between intact and non-intact forests, based on a distance threshold (edge width). The authors however specify that the MSPA is one of the many tools that could be used to distinguish between IFL and NIFL and obtain a proxy of degraded forests. Better stratification tools or more detailed land-cover assessment can be used if available. The forest degradation identified with the MSPA proxy depends on the observational window, including the spatial resolution and the periodicity of the input maps; fine resolution and high periodicity would possibly lead to capture finer land-use patterns (Bucki et al 2012).
Download figure:
Standard image High-resolution imageTable 2. Sources of uncertainty and values used in the uncertainty analysis.
| Parameter | Unit | Description | REL | Sensitivitya | Monte Carlob | Tier | Type | References |
|---|---|---|---|---|---|---|---|---|
| IFLInc | MgC ha−1 yr−1 | Carbon increment of intact forest landc | 0.75 | [ − 0.47;1.32] | N(0.75,0.079) | 1 | Recurring | (Baker et al 2004, Lewis et al 2009), |
| N(0.14,0.30) | 2 | (Chave et al 2003, 2008), | ||||||
| (Phillips et al 1998, 2008, 2009) | ||||||||
| Phillips et al (2009) | ||||||||
| IFLStock | MgC ha−1 | Carbon stocks of intact forest landc | 204.6 | [168.6;236.3] | N(204.6,62.1) | 1 | (Gutierrez 2005, Pelletier et al 2011), | |
| N(168.6,7.78) | 2 | (IPCC 2003, 2006) | ||||||
| NIFLInc | MgC ha−1 yr−1 | Carbon increment of non-intact forest landc | 2.37 | [1.45;6.35] | N(2.37,0.94) | 1 | (Gutierrez 2005, Pelletier et al 2011), | |
| N(4.43,0.52) | 2 | (IPCC 2003, 2006) | ||||||
| NIFLStock | MgC ha−1 | Carbon stock of non-intact forest landc | 102.3 | [20.5;184.1] | N(120.0,8.33) if 'Fallows=Forests'=0 | 2 | (Gutierrez 2005, IPCC 2006), | |
| N(88.1,6.79) if 'Fallows=Forests'=1 | (Pelletier et al 2011) | |||||||
| x% of IFLStock, x ∼ (50,12.2) | 1 | Modelling | (Bucki et al 2012) | |||||
| 'OL → IFL = 0' | 0 (rejected) | Assumption that OL converted to IFL are reclassified as NIFL for a minimum duration | 1 | (0, 1) | [(0,1/2),(1,1/2)] | (Bucki et al 2012) | ||
| 1 (accepted) | ||||||||
| Edge | m | Width of the buffer circling intact forest land that describes non-intact forest land | 250 | [50;5000] | [(200,1/4),(250,1/2),(300,1/4)] | (Bucki et al 2012, Potapov et al 2008) | ||
| 'Fallows=Forests' | 0 (rejected) | Assumption that fallows are forests | 0 | (0, 1) | [(0,1/2),(0,1/2)] | (Gutierrez 2005) | ||
| 1 (accepted) | ||||||||
| Δt | yrs | Time interval for the considered period | 10 | (8, 9, 10) | 10 | Recurring | (Pelletier et al 2011) | |
| Resolution | m | Pixel size of analysed maps | 50 | (50, 250) | 50 | — |
aThe values shown in the Sensitivity column are the intervals formed by the lowest and highest value considered. bIn the Monte Carlo column, N(μ,σ) are normal distributions of mean μ and standard deviation σ, and intervals are discrete probability distributions. cAverage stocks and increments included above-ground and below-ground biomass, deadwood debris and litter, whose values are detailed in SI section S2.
2.2. Sources of uncertainty
We evaluated the effect of uncertainties associated with nine parameters upon which the matrix approach depends for the quantification of annual emissions from land-cover changes at the national level (table 2). The selected parameters were differentiated as representing two distinct types of uncertainty sources: recurring and modelling ones. Amongst the recurring sources of uncertainty we included carbon stock density and carbon stock increment of intact forest lands (IFL) and non-intact forest lands (NIFL), since several studies have pointed the high uncertainty associated with them (Houghton 2003, 2005, 2010, Pelletier et al 2011). For each parameter a range of values was obtained from Panama or other Neotropical forests (figure 2). National data from Panama came from the national report to the Forest Resource Assessment (Gutierrez 2005) and other official data used in Pelletier et al (2011). These data are referred to as Tier-2 values and the default values published by IPCC (2003) that were used are referred as Tier-1 following IPCC's terminology. For GHG inventories, IPCC has described three Tiers that represent the methodological complexity that is required to estimate emissions and removals, where: Tier-1 uses IPCC default parameters; Tier-2 uses country-specific carbon data; and Tier-3 requires highly disaggregated national data of carbon pools and assesses any change in pools through repeated measurements or modelling. We also examined two recurring sources of uncertainties pertaining to the quality of remote-sensing images: pixel size and time interval between two images since Panama's official maps have been constructed from images gathered between 1988 and 1992 for the 1992 map, and between 1998 and 2002 for the 2000 map (Pelletier et al 2011).
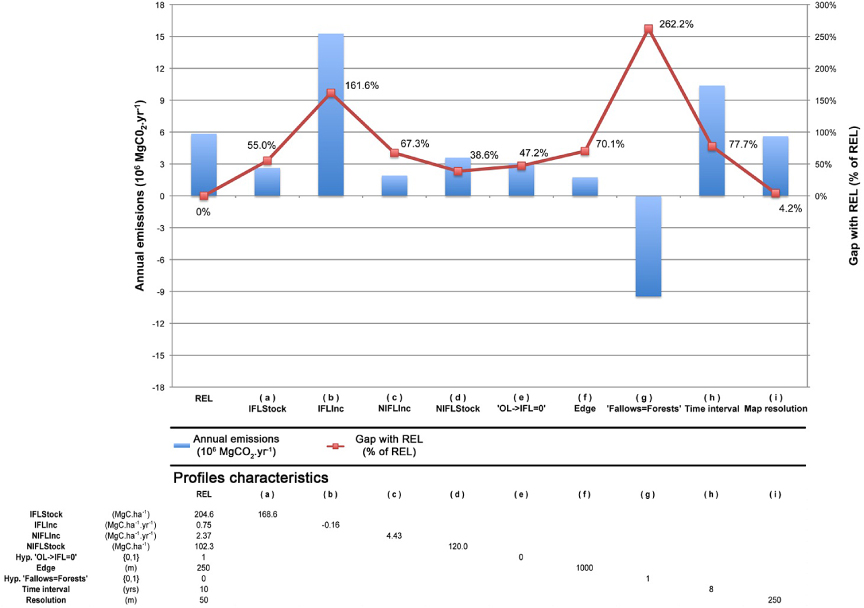
Figure 2. Results of the sensitivity analysis for nine key parameters used to model emissions from the land-use sector of Panama with the matrix model (Bucki et al 2012). Modelled annual CO2 emissions from the land-use sector (blue) and the difference with the reference emission level (REL) (red curve and %). Positive values for annual emissions indicate the sector is a source of CO2 and negative values a sink. Abbreviations: IFL and NIFL Stock: intact and non-intact forest carbon stock; IFL and NIFL Inc: intact and non-intact forest carbon increment; 'OL → IFL = 0': assumption that the entire reforested area resulting from the land-use change 'from other land to intact forest' should automatically be reclassified as non-intact forest for a duration ensuring that the forest recover its properties. 0 = assumption rejected, 1 = accepted; Edge: width of the buffer area surrounding intact forests along road, rivers, infrastructure and agriculture plots; 'Fallows=Forests': assumption that fallows are accounted as forests. 0: fallows = other land, 1: fallows = forests; Time interval: time between the two land-use maps; Map resolution: map pixel size.
Download figure:
Standard image High-resolution imageThree modelling sources of uncertainty were also tested for sensitivity. First, the effect of varying the size of the buffer width or distance threshold surrounding intact forests (edge width) was assessed, since it determines the proportion of NIFL relative to IFL. We also tested the consequences of two model assumptions. The first one is that reforested areas should be classified as NIFL for a minimum duration of five years before being classified as IFL (as a consequence OL → IFL = 0). In effect, Bucki et al (2012) specify that the areas that would appear as 'converted to intact forest land' (plantations, restoration or land abandonment) should mechanically be reclassified as 'non-intact forest' (NIFL) for a duration that would ensure some natural forest structural properties has been regained (e.g. tree diversity, suitable wildlife habitat). Second, the assumption that fallow lands could be classified as either forests or other lands, assuming Fallows = Forests or Fallows = Non-Forests.
2.3. Sensitivity analysis and Monte Carlo simulations
The sensitivity analysis decomposed uncertainties in emissions/removals from land-use change by (i) estimating annual reference emissions levels using an (REL) scenario as a benchmark, (ii) recalculating sensitivity emissions levels (SEL) by varying one key parameter at the time, and (iii) assessing deviations in emissions between REL and SEL. The REL used IPCC default values (Tier-1) for carbon stocks and increments, and adopted the assumptions of Bucki et al (2012): OL → IFL = 0 and Gutierrez (2005): Fallows ≠ Forests. Edge width was estimated based on the proportion of IFL and Panama's official proportion of mature forests (details in SI section S3).
In total, land-use change emissions were estimated for 54 different SEL by running the model with each of the values assigned to the nine key parameters. The different values that were assigned to each parameter and their associated references are found in figure 3. The SELs obtained for each value of the key parameters were compared with REL, which was expressed as a per cent deviation (equation (1)):

where Em is annual land-use change emissions (Mg CO2 yr−1) of the ith parameter using a jth input value (see SI section S2 for calculation details). The sensitivity of a parameter was defined as the maximum observed difference between REL and SELij (equation (2))


Figure 3. Detailed results of the sensitivity analysis for each of the key parameters used in the sensitivity analysis. The values given to each of the key parameters during the sensitivity analysis as well as the reference from which they were drawn is found on the X axis. Colour coding and abbreviation are as in figure 2. In the first panel, emissions are computed for the REL and other neotropical intact forest increment values, gaps are relative to the REL emissions. In the third panel, emissions are computed with values of intact forest increment averaged over different periods among the 1985–2000 period, and gaps are relative to the emissions computed with the overall 1985–2000 value.
Download figure:
Standard image High-resolution imageErrors were propagated using Monte Carlo analysis with 10 000 000 simulations based on simple random sampling to evaluate the overall uncertainty in emission estimates. In the Monte Carlo simulations, the recurring sources of uncertainty compared were IFL and NIFL carbon stocks and increments, that is those included in the bookkeeping carbon data; uncertainties that were associated with the time lag between images constituting one map and pixel size were not included in the simulations since they were already discussed in Pelletier et al (2011). The modelling sources of uncertainty used were edge values and assumptions 1 and 2. Discrete probabilities were attributed to the modelling assumptions. Monte Carlo simulations further differentiated the errors that were associated with the use of Tier-1 versus Tier-2 data. One independent simulation was performed in Matlab (MATLAB 2012) for (1) recurring sources of uncertainties, (2) modelling ones, and (3) both recurring and modelling uncertainties using in turn Tier-1 or Tier-2 values resulting in six different sets of data.
3. Results
3.1. Sensitivity analysis
The total emissions from land-use change predicted by the REL were obtained by summing the emissions/removals coupled to the 3 × 3 land-use change matrix (table 1) and amount to +5.84 × 10⁶ Mg CO2 yr−1. The matrix approach shows that between 1992 and 2000 close to 3000 × 103 ha remained as forests, while ∼500 × 103 ha was deforested and ∼300 × 103 ha was degraded. According to the sensitivity analysis deviations between the REL and SELs, namely, Maxj{ΔEmij} ranged between 4.2% and 262.2% (figure 2). Classifying fallows as forests generated the largest difference, with forest-related emissions changing from being a carbon source, as found by the REL, into a large net sink over period studied (−9.47 × 10⁶ Mg CO2 yr−1; figure 3(2)).
The second most important source of uncertainty that was identified by the sensitivity analysis is the IFL carbon stock increment (figure 2). Tier-2 data that had been obtained for Panamanian mature forests yielded a lower IFL carbon stock increment or carbon accumulation than the IPCC default value used in the REL, leading to emissions that were 161.6% above REL (15.27 × 10⁶ × Mg CO2 yr−1). Using eight different IFL carbon stock increments that have been published for neotropical forests, yielded deviations in emissions estimates ranging between −101.2% and +76.3% (between −0.07 × 10⁶ and +10.29 × 10⁶ Mg CO2 yr−1; figure 3(2)). Closer examination of data from Chave et al (2003) for Barro Colorado Island, Panama, and spanning a fifteen-year period, revealed high temporal variability of carbon fluxes from mature forests. Sensitivity analysis based on two different periods for the same forest track led to opposite trends in IFLinc, with a decline for 1990–2000, and an increase for 1985–2000. Using Chave et al (2003), we compared the deviations, ΔEmIFLinc, for 1990–1995 and 1985–1990 to that for the entire 1985–2000 period and obtained respective differences of +41.8% and −23.0% in emissions on a national scale (figure 3(3)). The uncertainty associated with the IFL carbon stock increment was higher than that associated with the IFL carbon stocks themselves (figure 3(1)) for which ΔEmIFLstock that was based on national values (Tier-2) was 55% lower than the REL estimated using default values from IPCC (2006).
Uncertainty around the NIFL carbon stock increment was as high as 130% (figures 3(4)). To estimate the sensitivity of NIFL carbon stock increment, we used the carbon stock increment values that were available from IPCC (2003) for natural forests (1.45 Mg C ha−1 yr−1) and Panama's Forest Resource Assessment (Gutierrez 2005) for Panamanian plantations (6.35 Mg C ha−1 yr−1); non-intact forests could include both natural and managed areas, resulting in deviations of +30.0% and of −130.1%, respectively. Bucki et al (2012) considers the change from IFL to NIFL as the simplest available proxy for forest degradation and assumed that the NIFL carbon stock is equivalent to half of the value for intact forests. While this assumption was conserved in the REL, we tested the sensitivity of the model by repeatedly varying NIFL carbon stocks by 10% and found that the deviation, ΔEmNIFLstock, increased by +44.7% for each 10% increment in NIFL carbon stocks (figure 3(5)). If the NIFL carbon stock was set to the level of a secondary forest, ΔEmNIFLstock was +38.6% (figure 3(5)).
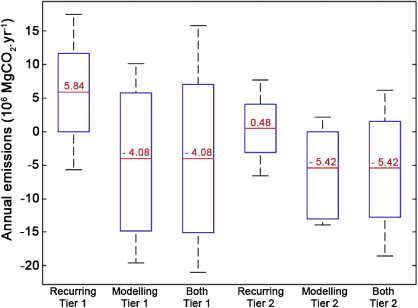
Figure 4. Results of the Monte Carlo analysis with 10 000 000 simulations using simple random sampling for 6 sets of sources of uncertainty: Recurring, Modelling and Both sources, in Tier-1 and -2. The boxplots show the mean for each simulation (red line and red value), the 50% confidence interval (blue box) and the 95% confidence interval (black whiskers). Negative values for emissions on the Y axis indicate that the model predicts the forest sector to be a sink for carbon while positive values predict a source of carbon. It is possible to note that for a single tier, the mean emission estimated is not the same when modelling sources of error are included because these were characterized using discrete probabilities. The fact that these probabilities are discrete and therefore are not based on a symmetric probability distribution function will affect the mean obtained. Table 13, made available with the supplementary information (at stacks.iop.org/ERL/8/034009/mmedia), provides details on these discrete probabilities.
Download figure:
Standard image High-resolution imageFinally, the effect of a range of edge widths, which ultimately defines the proportion of NIFL in relation to IFL, was tested using values from Bucki et al (2012) 500 m edge width and Potapov et al (2008) 1000 m width, together with gradual increases up to 5000 m (figure 2). The resulting deviations, ΔEmedge, were negatively correlated with the value of edge width chosen for the model (figures 3(7)).
Now, when we examine the maximum sensitivity for each matrix element representing the 5 REDD+ activities, we see that the uncertainty is not equal among activities. The largest error or variation is associated with forest conservation while the least quantified error is for deforestation activities (table 1(b)–(c)). The sensitivity associated with degradation, sustainable management of forest and carbon stock enhancement is relatively similar. So, this means that the emissions from deforestation present less variation or sensitivity and are likely to be evaluated with greater certainty than the removals from forest conservation, or the emissions or removals from other REDD+ activities.
3.2. Monte Carlo analysis
Monte Carlo uncertainty analysis that was applied to the six sets of data allowed us to compare the overall uncertainty that was imputed from recurring or model-specific sources of uncertainty, and differences that were obtained by using a Tier-1 default value and nationally derived Tier-2 data. Confidence intervals around the mean of modelled sources of uncertainties were larger than that for recurring sources (figure 4). Therefore, modelling choices were found to have the greatest impact on the uncertainties around emission estimates. Monte Carlo simulation showed that the 50% confidence interval was smaller for Tier-2 and Tier-1 data (respectively 4.90 × 10⁶ Mg CO2 ha−1 versus 7.92 × 10⁶ Mg CO2 ha−1) (figure 4). Emissions predicted by the Tier-2 model were lower than by Tier-1 (0.48 Mg CO2 ha−1 and 5.84 Mg CO2 ha−1, respectively).
4. Discussion
Our analysis of uncertainties shows that both recurring and modelling sources have a major effect on the quantification of emissions and removals from forests. The uncertainty that we unveiled further calls attention to REDD+ estimation and reporting as well as on ways in which uncertainty can be dealt with. The five UNFCCC principles for estimating and reporting emissions and removals of greenhouse gases (Transparency, Consistency, Completeness, Comparability and Accuracy) provide a useful framework to do so. At present, detailed reporting guidelines exist for the annual GHG inventories of Annex I Parties (UNFCCC 2004), while only generic guidance is available for the preparation of national communications from non-Annex I Parties. Although now is not possible to foresee the exact reporting requirements of a future REDD mechanism, they will likely follow the general principles and procedures currently valid for AI parties.
It is important to note that several countries currently have similar or lower capabilities for monitoring their forests for REDD+ than does Panama. Compared to other developing tropical countries, Panama is ranked as having an 'advanced' stage of completeness in its GHG inventory, a 'good' forest area change monitoring capacity, and a 'limited' forest inventory capacity (Herold 2009). Uncertainty levels reported through this case study could potentially be higher in those developing countries, while they could be lower or comparable to those uncertainty levels that are found in more advanced developing countries.
Principle 1: accuracy. Accuracy is a relative measure of exactness. In the context of UNFCCC reporting, 'estimates should be accurate in the sense that they are systematically neither over nor under true emissions or removals, as far as can be judged, and that uncertainties are reduced as far as practicable' (UNFCCC 2004). Higher tiers for emission factors have been recommended by the IPCC to reduce the uncertainty of estimates. For instance, national Tier-2 data are assumed to be more accurate than default Tier-1 data (IPCC 2003). Our results confirmed that confidence intervals for emission estimates were narrower with Tier-2 values compared to those for Tier-1, thus, the overall precision of the model and, hence, its certainty was increased by the use of Tier-2 values. Yet, the accuracy of emission estimates remains unknown.
Morgan and Henrion (1990) indicate that the lack of accuracy and its estimation are hard to quantify. The allometric regression equations used to convert tree measurements (diameter at breast height, wood specific gravity, height) to tree biomass provide a relevant example. These equations are essential to calculate forest carbon stock density which in turn is used as emission factor in REDD+. Being both time-consuming and costly, locally-derived allometric equations are often based on a limited number of trees which are not necessarily representative of the size and species found (Gibbs et al 2007) and potential errors are introduced by extrapolating the models beyond their range of applicability (Chave et al 2004). Many published allometric models indeed lack reliable data for the largest diameter classes, so they cannot be used to estimate the AGB held in large trees (Clark and Clark 2000, Houghton et al 2001).
In order to evaluate the (lack of) accuracy of emission factors calculated based on allometric models, we would have to compare it to the true value which is unknown. The alternative is to develop a model that is largely superior to the existing ones. Reducing bias in emission factors will therefore arise from a globally concerted effort to generate new biomass data from destructive sampling in order to develop new and superior allometric equations for tropical forests. As the largest diameter trees account for a disproportionate amount of carbon store in forests (Brown 2002), generic multi-species models (stratified per ecological zones or forest type) derived from vast dataset including the largest diameter size tree are to be prioritized. Some steps are being taken in this direction by the Tropical Agricultural Research and Higher Education Center (CATIE), UN-REDD program and FAO, who are reviewing all existing allometric equations (Cifuentes Jara et al 2012), and by J Chave's group (Universite Paul Sabatier, Toulouse), who have now accumulated biomass information on more than 4000 individual trees (Chave et al 2012). Furthermore, several REDD+ pilot countries are collecting new information for the development of allometric equations thus REDD+ readiness offers a unique opportunity to collate the necessary global data set.
Principle 2: comparability. Comparability is another principle that has been defended by the IPCC and the UNFCCC with regard to GHG measurement and reporting to ensure that 'emissions and removals reported by Parties in inventories should be comparable among Parties' (UNFCCC 2004). The principle particularly specifies that Parties should follow standardized methods and allocations of source/sink categories in compliance with IPCC guidelines (UNFCCC 2004). This principle however applies to the reporting of GHG emissions and removals by developed countries in the context of their mitigation commitment. The situation is different for REDD+ since the mechanism does not intend to compare estimates among countries but rather aims at supporting countries who decide, on a voluntary basis, to reduce their deforestation. However, it will specifically matter if traded as carbon offsets for developed countries' mitigation commitments. For illustration purposes only, if the REDD country A includes fallow in its forest definition, while the REDD country B excludes it, even if their evaluation is internally consistent, the value of their emission reductions in terms of environmental integrity will not be the same. The carbon flux estimates and the potential emission reduction estimates that are obtained from different models, or which are based on different assumptions using the same model, will most likely not be comparable. The comparability of REDD+ emission reductions between countries could however be achieved by adopting simple, standardized, transparent and strict(er) rules for estimating emissions reductions.
Principle 3: completeness. Our results show that one of the most sensitive parameter in the matrix approach is attributable to intact forest carbon stock increments. Above-ground biomass increment can be estimated from carefully measured tree growth over at least 10 ha of forest that has been inventoried per forest type, where small tree classes (<10 cm diameter) as well as large size classes are measured, including lianas and biomass loss due to crown damage (Chave et al 2004, 2003), an effort that is both time-intensive and costly. Panama is fortunate to be able to rely upon the monitoring of the permanent 50-ha forest dynamics plot on Barro Colorado Island4 that was initiated in 1980 and allowed estimating the intact forest carbon increments. Work in Barro Colorado Island showed that carbon stocks are spatially structured (Ruiz-Jaen and Potvin 2010), and that gaps formed by trunk or crown damage, branch fall and partial breakage of stems have a significant influence on above-ground biomass changes (Chave et al 2003). Furthermore, IFL increment is likely to change in the future since studies have reported increases in above-ground biomass (AGB) (Phillips et al 1998, Baker et al 2004, Lewis et al 2009) and above-ground net primary productivity (Lewis et al 2004, Boisvenue and Running 2006) in response to global change. The vulnerability of Amazonian intact forest biomass to the 2005 drought has also been demonstrated (5.3 Mg ha−1 of AGB lost during a 1.97-year census (Phillips et al 2009). It has been suggested that increased atmospheric CO2 concentrations stimulated lianas' growth and altered disturbance cycles and turn-over of tropical forests causing a decrease in carbon storage (Schnitzer and Bongers 2011, Laurance et al 2004, Foley et al 2007, Nepstad et al 2008). The need to reduce scientific uncertainty with respect to the fate of intact tropical forests as a source or sink of GHG with global change has been largely recognized (Malhi et al 2008, Muller-Landau 2009, Chave et al 2008).
The sensitivity of intact forest carbon stock increments in our simulation clearly shows that both the temporal and spatial variability and the uncertainty of this parameter limit the attainment of reduced uncertainty in the context of result-based payments. As such the principle of completeness might provide some useful guidelines. In the case of developed countries, the principle of completeness means that GHG inventory covers all sources and sinks, as well as all gases that have to be reported according to appropriate guidelines. In the case of REDD+, the concept of key categories provides guidelines to help countries decide which are the carbon pools, functioning as a source or sink, should be measured and reported (GOFC-GOLD 2012). The concept of key categories allows identifying which pools are significant in terms of their emissions factor and indicates that, if the pool is significant, Tier-2 or -3 methods should be used for estimating emissions or removals. In cases where data is unavailable or too uncertain, a tier lower than required could be used or a carbon pool could be ignored if it does not lead to a systematic overestimation of emission reductions (GOFC-GOLD 2012). Our modelling showed that IFL carbon stock increments can act both as a source or a sink. Although direct measurements over time are generally time-consuming and costly, countries with high forest cover and low deforestation (see Da Fonseca et al 2007) that expect to receive credits for conservation, sustainable management of forests and carbon stock enhancement might want to invest time and resources generating Tier-3 data to reduce the uncertainties associated with intact forest carbon stock increments. Conversely, following GOFC-GOLD guidelines, other countries might neglect it thus producing an incomplete estimate which would avoid overestimating removals from intact forests.
Our results also show that some REDD+ activities carry more uncertainty than others (forest conservation compare to deforestation). It seems that, from a climate viewpoint, a stepwise approach should be to focus on reducing deforestation which would lead to more certain emission reductions. This is also consistent with what most REDD+ countries are already doing.
Principle 4: consistency. The main sources of error that we identified are associated with modelling assumptions and our analysis indicate that a number of model-specific parameter and assumptions have more than one acceptable alternative. For example, the characteristics of fallow vegetation in Panama in terms of height and canopy closure would justify their classification as forest (Gutierrez 2005, p 14, Gutierrez 2010, p 10). Yet, our modelling showed that classifying fallow as forests would cause the land-use change sector to switch from being a net carbon source (+5.84 × 10⁶ Mg CO2) to a net carbon sink (−9.47 × 10⁶ Mg CO2). Therefore, it is important to recognize that models for estimating emissions from deforestation are based on different assumptions, that many reasonable alternatives choices are left to the end-users and that modelling choices are major sources of uncertainties (Morgan and Henrion 1990). The discrepancies brought about through the use of different models or model assumptions should not be taken lightly if credible REDD+ emission reductions are to be secured. We contend that the consistency principle is an essential principle to ensure environmental integrity in the context of REDD+. In fact, consistency, using the same methodology and consistent data sets for the base and all subsequent years are at the root of good reporting practices. For REDD+, it signifies that the procedures and models, as well as consistent data sets to estimate emissions or removals from sources or sinks used to define the reference level should be the same as those used to evaluate performance over the subsequent assessment periods, i.e. during MRV. Clearly, with consistent methodologies, an important part of the error studied here would automatically be taken care of.
UNFCCC provides guidelines for recalculations if it is for the purpose of the improvement of accuracy and completeness and if it is done in a transparent manner (UNFCCC 2004). In the context of REDD+, a concern is that recalculations may become the norm as REDD+ countries are progressing in their forest MRV capability, they will likely want to 'improve' their methodology. To prevent this situation, recalculation should take place only and strictly when new data improving accuracy and/or extending completeness is available and only for these specific components. Another possible solution would be to limit recalculation to the end of an assessment period and to ask REDD+ countries to provide, at that time, their estimates using both the initial methodology of the REL and the new methodology proposed for the future. This would establish a benchmark allowing the comparison of consistent data both in the past and the future. Consistency is also an issue when REDD+ activities are to be carried out at sub-national scale, be it jurisdictional or project. In this case, we contend that it is essential that methodologies be consistent to ensure that emissions reductions estimated at the sub-national and national scale be harmonized.
Principle 5: transparency. Transparency is essential to the communication of the reported information for their users and it should be highly valued, as the basis for confidence. In UNFCCC reporting requirements, transparency implies that the assumptions and methodologies used are clearly explained to facilitate replication and for evaluation purposes. However, in the reality, without having access to the data sets used and the remote-sensing data, replication cannot be achieved with assumptions and methodologies alone and verifications may only be superficial. In this context where experts and government representatives are asked to be more transparent and therefore more accountable, public access to the forest monitoring information used for REDD+ reporting (and for developed countries) would create confidence. As ultimately, certainty is a matter of scientific confidence, public access would therefore strengthen the credibility of the system.
Principle of conservativeness. Besides the five UNFCCC reporting principles mentioned above, conservativeness is used for accounting purposes during the review process under the Kyoto Protocol to ensure that estimates do not lead to an overestimation of emissions in the base year, or an underestimation of emissions in a year of the commitment period and if the expert review team considers that estimates by a country are found to be incomplete and/or are prepared in a way that do not follow IPCC guidance (UNFCCC 2006). For REDD+, one of the principal goals should be to avoid overestimating emission reductions or removals in order to ensure that what is being compensated is the fruit of real benefit for the climate. Conservativeness thus would increase the robustness, environmental integrity and credibility of mitigation actions, especially when estimates are incomplete or too uncertain (Mollicone et al 2007, Grassi et al 2008).
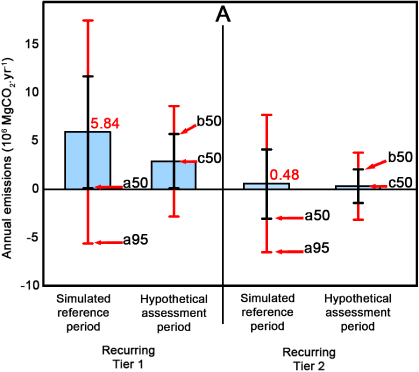
To discount for uncertainty, Norway suggested that, by providing early access to result-based payments by using conservative estimates of emissions reductions, such conservative estimates would be obtained by 'using default values subtracted for the full confidence interval' (UNFCCC 2012, p 56). This suggestion is similar to the conservativeness approach advanced by Grassi et al (2008) and GOFC-GOLD (2012) to correct REDD+ estimates in order to ensure conservativeness by proposing two approaches: the reliable minimum estimate (RME) based on the difference between the lower limit of the confidence interval of the baseline and the higher limit of the confidence interval of the assessment period and which ignores possible correlation among errors, and the trend uncertainty, that is the uncertainty of the difference of emissions between the reference and the assessment period and consider the errors in emission factors to be fully correlated between periods. We tested the RME approach using a hypothetical assessment period assuming 50% reduction in mean emissions for the purpose of comparison. However, when we compare our Monte Carlo simulation to this hypothetical assessment period we see that even when discounting the modelling sources of uncertainties, the size of the 95% and even the 50% confidence intervals is greater than the computed emissions, so the application of the RME would make emission reductions undetectable (figure 5). Grassi et al (2013) recognized that the RME would lead to no or very limited conservatively demonstrated reductions of emissions from deforestation, unless a large reduction of deforestation occurred and uncertainties are low. The results of our simulation based on real data from a developing country casts doubt on the applicability of the RME approach since even when halving emissions, the RME would never allow for credits.
Figure 5. Illustration of the method proposed by Grassi et al (2008), (figure 4) to calculate conservative emission reductions from REDD+ using the Reliable Minimum Estimate approach based on the 95% confidence interval around the data using our simulation for Panama. The simulated assessment periods (Tier-1 and -2) are the Monte Carlo scenarios using recurring sources of error with Tier-1 and Tier-2 data. In the hypothetical assessment periods, we assumed a 50% reduction in mean emissions and a proportional uncertainty (in % standard deviation) between the simulated reference period and the hypothetical assessment period.In this approach, one of the two proposed by Grassi et al (2008), a conservative emissions estimate is obtained based on the uncertainty of the reference as: a50–b50 (most stringent estimate) or a50–c50 (less stringent estimate) for the 50% confidence conservative estimate, and a95–b95 (most stringent estimate) or a95–c95 (less stringent estimate) for the 95% confidence conservative estimate.
Download figure:
Standard image High-resolution image
While conservativeness is necessary to avoid overestimating emission reductions or removals for which countries are compensated, more realistic ways to deal with uncertainty is needed. In this sense, the trend uncertainty looks more promising (Grassi et al 2008, 2013), especially in the case when the five REDD+ activities would be accounted for. Further research based on real data from a REDD+ country applying this approach is needed. Establishing a quality grade or adjustment factor on emission reductions could be one other option to explore as it would favour conservativeness and stimulate improvements in forest monitoring capabilities while allowing countries to receive real incentives. This, in essence, would follow the good practices guidance of the Kyoto Protocol recommending to discount uncertainties from emissions or removals up to a plateau of −27% (Decision 20/CMP.1) (UNFCCC 2006).
4.1. Uncertainty and financing in the context of the new climate regime
In order to understand fully the importance of uncertainties surrounding REDD+ emissions estimates in the context of the new climate regime, we also analysed submissions to the UNFCCC Secretariat on the financing of REDD+ (UNFCCC 2012). The majority of the twenty-two countries or groups of countries (60%) that sent submissions to the UNFCCC Secretariat appeared comfortable with the idea that REDD+ activities could be financed both by a fund, mostly the Green Climate Fund, and by market-based approaches. Several countries mentioned the need to adopt a standard reporting unit for REDD+ result-based actions. Such reporting units would condition the payment for result-based actions and would be considered as performance indicators, with the most frequent proposal being emission reductions in 'tonnes CO2 equ. per year'. As previously mentioned, the magnitude of uncertainties that we estimated suggest that it is worth bringing to the discussion the possibility of implementing performance indicators other than 'tonnes CO2 equ. per year', at least until the accuracy and certainty of forest carbon stocks emission and removal estimates supporting a REDD+ policy can be reached. The use of 'tonnes CO2 equ. per year' could give a false sense of environmental integrity by providing a number while ignoring its confidence interval. Under the Kyoto Protocol compliance mechanism, Gupta et al (2003) pointed out that emission reductions are as high as the uncertainty around them and, thus, the probability of compliance is low. In effect, if uncertain emission reductions from REDD+ are used to offset well-known emissions from fossil fuel combustion, there is a high probability that no benefits will be entailed for the climate. The COP may choose 'tonnes CO2 equ. per year' as a performance indicator, but it will be essential for its credibility to report the error associated with the emissions estimates.
Some authors have proposed the use of performance indicators that would be based on the successful implementation of policies and measures for REDD+ based on governance, political reform, and other criteria, and inspired from experience in the aid sector (Wertz-Kanounnikoff and Mcneill 2012, Motel et al 2009). Implementation metrics are suggested for monitoring the progress in building REDD+ architecture and performance metrics are detailed for evaluating results to assess payment levels (Daviet 2009, Wertz-Kanounnikoff and Mcneill 2012). Norway, in its submission, also opens the door for 'performance measures other than carbon' as a useful possibility in the context of other options. Similarly, Brazil's submission calls attention to the lessons learned from the Amazon Fund (2010), which developed specific indicators associated with activities, results and objectives of the programme and where none of the indicators used by the Amazon Fund is based on emissions reduction. The three indicators selected are (1) annual deforestation in the Amazon biome, (2) share of GDP of the states located in the legal Amazon in relation to Brazil's GDP, and (3) level of schooling of people from 7 to 14 years of age in the states in legal Amazon. While the example of the Amazon Fund could hardly be amenable to result-based financing in the context of a carbon market, it is an approach that could be amenable to financing through a fund. The adoption of a dashboard of performance indicators taking into account not only emissions reduction proxy but also capacity building and institutional strengthening might provide a more holistic approach to result-based action. In fact, the lack of capabilities for estimating forest-related emissions and removals at this point in time should not constitute a factor that delays actions to tackle deforestation issues for the sake of the climate, together with other possible co-benefits.
To respond actively on this issue, we believe that it is essential for scientists and policymakers to:
- (1)Address model-specific uncertainties associated with definition and assumptions by creating a well-structured, standardized, transparent, and simple estimation and reporting scheme to obtain comparable estimates between countries if credible, tradable REDD+ emission reductions are to be secured. For example, the Conference of the Parties (COP) to the UNFCCC could ask IPCC to formulate recommendations for stricter rules and procedures or to identify an adequate unique modelling approach, such as that proposed by Bucki et al (2012).
- (2)Ensure consistency in reporting at a national level by limiting recalculations (for both reference level and assessment period) to specific demonstrable cases of accuracy and completeness improvement.
- (3)Promote transparency by requiring public access to assumptions, methodologies and data used for forest monitoring for both developed and developing countries under the UNFCCC.
- (4)Test different approaches through scientific research (including the trend uncertainty as proposed by Grassi et al (2008) for establishing conservativeness in REDD+ that would preserve environmental integrity, encourage countries to improve forest monitoring capabilities over time.
- (5)Develop better and broadly adopted biomass allometric models for the tropics, including the calibration of LiDAR with destructive biomass sampling at the plot level through a concerted international effort with scientists and countries.
- (6)Improve the accuracy of recurrent uncertainties, including emission factors through national forest monitoring systems and a continuous global network of national and scientific efforts for forest carbon assessments (e.g. by monitoring intact forest land carbon pools over time). For activity data, such efforts should contemplate obtaining commitments from national space agencies for the necessary satellite data (Baker et al 2010).
- (7)Develop and adopt performance indicators complementary to reduced emissions to be used for evaluating policy and measures, at least until the accuracy and certainty of forest-related emission and removal estimates necessary to support a REDD+ policy can be reached.
Acknowledgment
We warmly thank Michael Bucki and Giacomo Grassi for their support in applying the matrix approach along with Bruno Guay and Jonah Busch for their useful comments and revisions on an earlier draft of this manuscript as well as two anonymous reviewers who helped improve this manuscript. JP and DM acknowledge the financial support of the Fonds de Recherche Québécois sur la Nature et les Technologies (FRQNT) and CP of Natural Sciences and Engineering Research Council of Canada (NSERC) Discover Grant.