
Abstract
Explosive volcanism resulting in stratospheric injection of sulfate aerosol is a major driver of regional to global climatic variability on interannual and longer timescales. However, much of our knowledge of the climatic impact of volcanism derives from the limited number of eruptions that have occurred in the modern period during which meteorological instrumental records are available. We present a uniquely long historical record of severe short-term cold events from Irish chronicles, 431–1649 CE, and test the association between cold event occurrence and explosive volcanism. Thirty eight (79%) of 48 volcanic events identified in the sulfate deposition record of the Greenland Ice Sheet Project 2 ice-core correspond to 37 (54%) of 69 cold events in this 1219 year period. We show this association to be statistically significant at the 99.7% confidence level, revealing both the consistency of response to explosive volcanism for Ireland's climatically sensitive Northeast Atlantic location and the large proportional contribution of volcanism to historic cold event frequencies here. Our results expose, moreover, the extent to which volcanism has impacted winter-season climate for the region, and can help to further resolve the complex spatial patterns of Northern Hemisphere winter-season cooling versus warming after major eruptions.
Export citation and abstract BibTeX RIS

Content from this work may be used under the terms of the Creative Commons Attribution 3.0 licence. Any further distribution of this work must maintain attribution to the author(s) and the title of the work, journal citation and DOI.
1. Introduction
Determining the extent to which human activity drives future climatic variation requires knowledge of past climate, allowing us to ascertain the boundaries of natural variability and to test the veracity of models predicting future climate (NRC 2006, Skinner 2008). Developing long palaeoclimatic datasets from multiple sources and regions for the period before the advent of instrumental meteorological recording is therefore critical (Wanner et al 2008, Jones et al 2009). The relationship to climate of natural palaeoclimatic proxies such as tree-rings can, however, be complex and indirect, and is often seasonally specific. In contrast, historical documents can directly register meteorological conditions in all seasons, as well as singular extreme events, at high temporal and spatial resolutions (Pfister et al 1999, 2002, Brázdil et al 2005, 2010). Documentary data can, however, exhibit biases (e.g. where certain weather conditions or extreme events are recorded preferentially to others) and coverage may be intermittent or discontinuous in time (Brázdil et al 2005). Documentary data are, therefore, of greatest value in efforts to improve our understanding of past climatic conditions and the role of climatic forcing factors when combined with data from natural biological and physical proxies. In this study we present a long and novel record of severe short-term cold event occurrence from historical documentary observations in Ireland, 431–1649 CE. We then employ the Greenland Ice Sheet Project 2 (GISP2) ice-core record of atmospheric sulfate deposition as a proxy for past explosive volcanism to investigate the role of volcanic forcing in the incidence of cold events for the Irish region of the Northeast Atlantic.
2. Volcanic impact on climate
Explosive volcanism can influence climate on interannual and longer timescales with potentially global effect (Stothers and Rampino 1983, Self 2006, Oppenheimer 2011). This is initiated by the explosive stratospheric injection of (primarily) sulfur dioxide gas (SO2) and its conversion to sulfate aerosol particles (H2SO4). These particles scatter incoming solar shortwave radiation to space and absorb near-infrared solar and outgoing longwave terrestrial radiation, cooling the troposphere and heating the stratosphere (Robock and Mao 1995, Robock 2000, Stenchikov 2009, Cole-Dai 2010). Sulfate aerosol must generally have a presence in the stratosphere to induce climatic impacts on large spatial scales, with strong zonal winds allowing aerosols to encircle the globe within weeks, whilst meridional circulation facilitates a more gradual poleward transport (Robock and Mao 1995, Robock 2000, Stenchikov 2009, Cole-Dai 2010). Whereas volcanic aerosols confined to the troposphere are deposited quickly (e.g. washed out by precipitation), the relative stability of the stratosphere allows aerosols a longer atmospheric residence time and a consequently extended climatic impact.
In addition to the requirement that volcanic ejecta attain sufficient altitude and be of a certain volume and chemical composition, many additional variables can influence whether eruptions have notable climatic impacts. Examples are the month and latitude of eruption as well as pre-eruption atmospheric and climate-system states, including the phase and strength of the El Niño–Southern Oscillation (ENSO) (Písek and Brázdil 2006, Kravitz and Robock 2011, McGregor and Timmermann 2011, Bourassa et al 2012, Timmreck 2012). These variables can differ considerably between eruptions, mediating and complicating their direct radiative effects and promoting a number of indirect dynamical impacts. Some of the most important dynamical impacts include winter warming as observed for Northern Hemisphere continental landmasses after explosive low-latitude eruptions (Shindell et al 2003, 2004, Fischer et al 2007, Driscoll et al 2012) and weakened monsoon circulation, with a related possibility being reduced precipitation in the African Sahel and low flow of the Nile River after high-latitude Northern Hemisphere eruptions (Oman et al 2005, 2006, Schneider et al 2009, Anchukaitis et al 2010, Peng et al 2010). Research also continues into mechanisms and feedbacks by which climatic disturbances initiated by eruptions might be amplified and evolve over multi-decadal and even centennial timescales (Stenchikov et al 2009, Frölicher et al 2011, Zhong et al 2011, Miller et al 2012, Zanchettin et al 2012).
Although explosive volcanism is arguably now one of the best-understood drivers of climate, the majority of the largest eruptions of the past two millennia occurred before the modern period (Schneider et al 2009). The restricted time-span of instrumental meteorological data and the limited number and size of eruptions in the modern period thereby frustrates full understanding of the complex volcano-climate system. Examining the impacts of historic explosive volcanism is thus long recognized as being essential to furthering our knowledge of this system (Zielinski 2000).
3. Historical observations of severe short-term cold events
3.1. Source description and significance
Our record of cold events comes from an exhaustive new survey of the rich corpus of medieval Irish chronicles, known generally as the Irish Annals and referred to hereafter as 'the Annals'. These comprise annually arranged written entries describing major events as reported by educated scribes in monastic centres up to the thirteenth century CE and by hereditary professional historians employed by the Irish aristocracy thereafter (McCarthy 2008). The Annals contain over 1 136 000 words of text and more than 40 047 distinct written entries, with contemporary reporting starting as early as the fifth century after the arrival of Christianity to Ireland (McCarthy 2008). The general reliability of even this early content can be tested by comparison to independently-known events. These include the spatially extensive sixth century plague of Justinian and the severe climatic downturn expressed in Northern Hemisphere tree-rings, c.536–550 CE, both credibly reported in the Annals (Baillie 1994, McCarthy 2008).
The large volume of accurately reported astronomical phenomena (e.g. solar and lunar eclipses) has led scholars to conclude that recording of natural phenomena in medieval Ireland was both systematic and sustained (McCarthy and Breen 1997a). One likely motivation arose from the ecclesiastical context in which the Annals were compiled and was an interest in foretelling the coming of the 'Last Days' as forewarned in the Bible by calamitous natural phenomena (McCarthy and Breen 1997b). This helped ensure the creation of a detailed record of the incidence of extreme weather for medieval Ireland.
Because the Annals begin during the 'Dark Ages' of the first millennium CE after the fall of Rome, when comparable European sources are scarce (Lamb 1995), their climatic content is of great significance, covering the entirety of the 'Medieval Climatic Anomaly' (c.900–1300) and the 'Little Ice Age' for over half of its commonly cited duration (c.1350–1850), as well as the transition between both. Ireland, moreover, occupies a climatically important location in the Northeast Atlantic, sensitive to ocean circulation changes and major modes of climatic variability such as the North Atlantic Oscillation (NAO) (Sweeney 1997). Yet the Annals have rarely been systematically exploited in palaeoclimatic research, despite extensive use of similar annals and chronicles elsewhere. A number of encouraging exceptions include McCormick et al (2007) and Kerr et al (2009) who examine weather reports in the Annals from 750–950 and 650–900, respectively, and Hickey (2011) who examines an extensive time-period but draws upon the early surveys of Wilde (1851) and Britton (1937), now updated by Ludlow (2010).
The abundant meteorological reports in the Annals adhere to established categories of useful documentary climatic data, including directly observed meteorological phenomena and conditions, such as snowfall, and indirect or proxy phenomena, such as ice on water bodies, from which underlying weather conditions may be inferred (Pfister et al 1999, Brázdil et al 2005). To derive our record of cold events, we compile all reports indicating severe cold occurrence for Ireland's mild maritime climate (examples in table 1). A representative report for the 855/856 winter season describes 'much ice and frost so that the principal lakes and rivers of Ireland could be crossed by people on foot and on horse-back from the ninth of the kalends of December (27 November, AD855, Gregorian Calendar) to the seventh of the ides of January (11 January, AD856, Gregorian Calendar)' (Annals of Ulster). These conditions are clearly severe for Ireland, being longer in duration and appearing comparable in severity to the anomalous cold of December 2000 in which temperatures fell to −14 °C in some locations in Ireland (Graham 2004).
Table 1. Example reports from the Irish Annals from which our record of cold events is derived. (Note: see table 1, supplementary data (available at stacks.iop.org/ERL/8/024035/mmedia) for a primary source bibliography.)
| Text translated from the original Irish or Latin | Notes, dates and sources |
|---|---|
| There was abnormal ice and much snow from the Epiphany to Shrovetide. The Boyne and other rivers were crossed dry-footed; lakes likewise. Herds and hunting-parties were on Loch Neagh, (and) wild deer were hunted. The materials for an oratory were afterwards brought by a large company from the lands of Connacht over Upper and Lower Loch Erne into [Leinster]; and other unusual things were done in the frost and hail. | Epiphany is 6 January, Julian Calendar or 10 January, Gregorian Calendar in 818 CE. Shrovetide is a moveable feast relative to the date of Easter, occurring in later January this year. Loch Neagh and Upper and Lower Loch Erne are large Irish lakes. Source: Annals of Ulster, 818 CE. |
| Very severe weather, with frost and snow, from the fifteenth of the kalends of January to the fifteenth of the kalends of March, or a little longer, which made great havoc of birds, and cattle, and people; and from which arose great scarcity and want throughout all Ireland, and in Leinster especially. | 15th of the kalends of January and 15th of the kalends of March are 15 days before 1 January and 15 days before 1 March, i.e. 18 December and 15 February, Julian Calendar (or 25 December and 22 February, Gregorian Calendar). We take this cold event as occurring in the 1114/1115 CE winter season. Source: Annals of Loch Cé, 1115 CE. |
| Famine throughout Ireland this year, and much sickness and death among men from various causes: cold, famine and every kind of disease. | Source: Annals of Connacht, 1227 CE. |
| Exceeding great frost and snow and stormy weather this year, so that no herb grew in the ground and no leaf budded on a tree until the feast of St. Brendan, but a man, if he were the stronger, would forcibly carry away the food from the priest in church, even though he had the Sacred Body in his hands and stood clothed in Mass-vestments. | Feast of St. Brendan: 16 May, Julian Calendar, or 25 May, Gregorian Calendar in 1465 CE. Source: Annals of Connacht, 1465 CE. |
Having preserved twelve centuries of record, the Annals cease in the mid-1600s when English custom and colonial rule disrupted their centres of recording.
3.2. Assessment of historical reliability
Documentary climatic data require careful methodological preparation (Brázdil et al 2005), but this is rarely afforded space for effective demonstration in the literature. Historical sources may fabricate, exaggerate, misunderstand or misreport natural phenomena, and because extreme events are by definition rare, the inclusion of relatively few unreliable events can significantly distort analyses.
Understanding the historical context in which documentary sources were created allows potentially dubious reports to be identified when contexts that motivate unreliable reporting are discerned (MacNeil 2000). For 1022 the Annals of Clonmacnoise report that 'there fell a great wonderful snow...before the battle of Sleive Grott' in the Galtee Mountains, southeast Ireland. The conspicuous timing of this snow and its emphasis as 'great [and] wonderful' suggests its function as an omen of the impending conflict. The use of portentous natural phenomena to stress the significance of major human events is a stylistic technique employed elsewhere in the Annals and in such cases casts doubt on the reliability of the specific weather reported. Such reports are valuable examples of how past societies perceived and exploited natural phenomena for political, theological and literary purposes, but they must be excluded from palaeoclimatic analyses.
In total, 83 unique cold events are reported in the Annals, of which we consider 65 reliable. Were the 18 unreliable events included in the absence of assessment, a 27.7% inflation of event totals would result. Unreliable events are also unevenly distributed in time (figure 1) and the resulting distortion is thus concentrated in certain periods (e.g. before 750 when unreliable events comprise 53.8% of the total). This provides a brief but salutary example of the importance of source assessment before palaeoclimatic analyses.

Figure 1. Inflation of cold event totals from reported events considered unreliable. The data are arranged in 50-year periods, 431–1649 CE. Bottom (light/blue) bars are the 65 cold events from the Annals that are deemed reliable. Stacked red/dark bars represent the inflation if the 18 unreliable events are not excluded (amounting to a 27.7% inflation in total).
Download figure:
Standard image High-resolution image3.3. Characterizing the record of cold events
Pioneering research on the chronology of the Annals by McCarthy (1998, 2001, 2005) has corrected errors in their dating as verified by comparison to historical and astronomical events of independently-known date. We apply these corrections in the following analyses. Towards the end of our period up to 1649 we supplement the declining record of the Annals with a survey of the increasingly diverse sources becoming available for Ireland at this time, including personal letters and accounts of military campaigns (table 1, supplementary data (available at stacks.iop.org/ERL/8/024035/mmedia) gives a primary source bibliography). This survey identifies five additional well-dated cold events that we deem historically reliable, for 1588, 1601/1602, 1603, 1635 and 1641 CE. We include these in the following analyses for 70 cold events in total.
Our cold events involve the occurrence of three classes of reported phenomena and conditions, namely: (1) heavy snowfalls, (2) periods of prolonged frost and/or ice on water bodies, and (3) general observations of abnormally cold weather (figure 2(a) depicts the frequency of reporting of these classes in 20-year periods from 431 CE). Heavy snowfall is reported on 52 occasions and is the most numerous (constituting 55.3% of reports). Prolonged frost and ice are reported on 29 occasions (30.9%) and observations of abnormal cold on 13 occasions (13.8%). We note that these values sum to 94, suggesting a mismatch with the value of 70 cold events. This arises because distinct phenomena and conditions can be reported as occurring together (e.g. snowfall and frost) or immediately consecutively (e.g. snowfall then frost) and are counted as single cold events in such instances.

Figure 2. Frequencies of reported phenomena and conditions indicative of severe cold, and total cold events. Panel (a) depicts 94 reported occurrences of frost and ice (purple or darkest bars), snowfall (blue or less-dark bars) and cold conditions (green or least-dark bars), in 20-year periods, 431–1649 CE. These reports are combined in panel (b) into 70 cold events, also binned in 20-year periods.
Download figure:
Standard image High-resolution imageThe reports from which our record derives may indicate durations of days, weeks, months, seasons and occasionally entire years for the phenomena and conditions described, but may also fail to provide any indication of duration, even when giving otherwise detailed descriptions of severity. As a rule we identify cold events as periods of any duration that appear to represent discrete contiguous episodes of abnormal cold distinct in time from the next nearest events. Some phenomena and conditions are reported as spanning entire winter seasons and cold events can thus cross between calendar years. Supplementary table 2 (available at stacks.iop.org/ERL/8/024035/mmedia) gives the dates of all 70 cold events and their constituent phenomena and conditions.
Figure 2(b) depicts the frequency of the 70 cold events in 20-year periods from 431. Events range from 0 to 4 per period, with a median of 1 per period (mean 1.15). From 740 onwards, the series is characterized by long spans at or above the median (e.g. nine consecutive 20 year periods from 740 to 919), punctuated by smaller spans without events (e.g. two consecutive periods from 1340 to 1379). Before 740 the series exhibits frequencies at or below the median, which likely result from data paucity. Before c.600 the number of manuscripts providing coverage is reduced, as are the number of written entries in those that do provide coverage. Additional sources from Ireland are unavailable to compensate here, and the likelihood that cold events have gone unreported must be regarded as heightened for this earliest period.
4. Volcanic forcing of cold event occurrence
4.1. Testing the association between volcanism and cold event occurrence
Volcanic sulfate deposition in ice-cores allows a reconstruction of the incidence of explosive volcanism over past millennia (Hammer 1977, Robock and Free 1995, Robock 2000, Zielinski 2000, Gao et al 2008, Sigl et al 2013). To derive a history of explosive volcanism, we employ the non-sea-salt sulfate record from the GISP2 ice-core, which has been used extensively for this purpose (Zielinski et al 1994, 1996, Zielinski 1995, 2000, Gao et al 2008). Atmospheric sulfate is deposited in the GISP2 ice-core in all annual layers, but only a subset of layers register deposition from major explosive eruptions with the potential for large-scale climatic impact. To identify explosive volcanic events we posit the existence of two separable processes, each resulting in sulfate deposition in the GISP2 ice-core. Background deposition, we posit, arises from numerous relatively small sulfate sources, including quiescent volcanism. We approximate this background distribution as Gaussian. Major explosive eruptions, we posit, will result in sulfate deposition that falls outside this background distribution.
The GISP2 sulfate (SO42−) time series has a variable sampling resolution with a reported 2.5 year minimum (Mayewski et al 1997). 586 sulfate deposition values are available for our 1219 year period of interest with a mean SO42− value of 36.9 ppb and assigned dates ranging from 431.80 to 1648.32 on the Meese–Sowers GISP2 chronology (Meese et al 1997). Starting with the largest of the 586 values, we iteratively apply the generalized extreme studentized deviate test to each SO42− value between these dates. This is conceptually equivalent to testing whether the observed value is consistent with a background process Gaussian SO42− distribution as represented by the other observed values. Each value identified as an outlier (at p < 0.05) is considered to register an explosive 'volcanic event' and removed from the distribution for the purpose of testing the remaining values. This method identifies 48 (8.2%) of the 586 SO42− sample values as registering explosive volcanic events, with a minimum SO42− value of 55.16 ppb distinguishing these values from those likely to register sulfate from background deposition only.
Using this record of volcanic events, we test whether explosive volcanism is associated with cold event occurrence. Because of potential recording biases that may impact upon the fidelity with which cold events are reported, we do not assume that the record of the Annals is continuous or complete, and hence seek a test for which intermittent reporting will not tend to bias the result. We consider that reported cold events correspond to volcanic events when occurring up to 5 years of each other. This window is comparable to that employed by Salzer and Hughes (2007) and accounts here for the reported 2.5 year minimum resolution of GISP2 SO42− samples as well as the possibility of climatic impact before the date of notable sulfate deposition, and the possibility of lagged or multi-year climatic impact after eruptions. We adopt a null hypothesis stating that dates of cold event occurrence are unassociated with dates of volcanic events. We build a distribution for the number of correspondences under this null hypothesis by randomly reordering the 586 SO42− observations 1 000 000 times. We omit from this exercise the time between GISP2 sample dates at 541.2 and 613.8 when GISP2 SO42− values are unavailable due to core damage. After each reordering we sum the number of correspondences between cold and volcanic event dates falling within the above window and observe a mean value of 24.9 random correspondences.
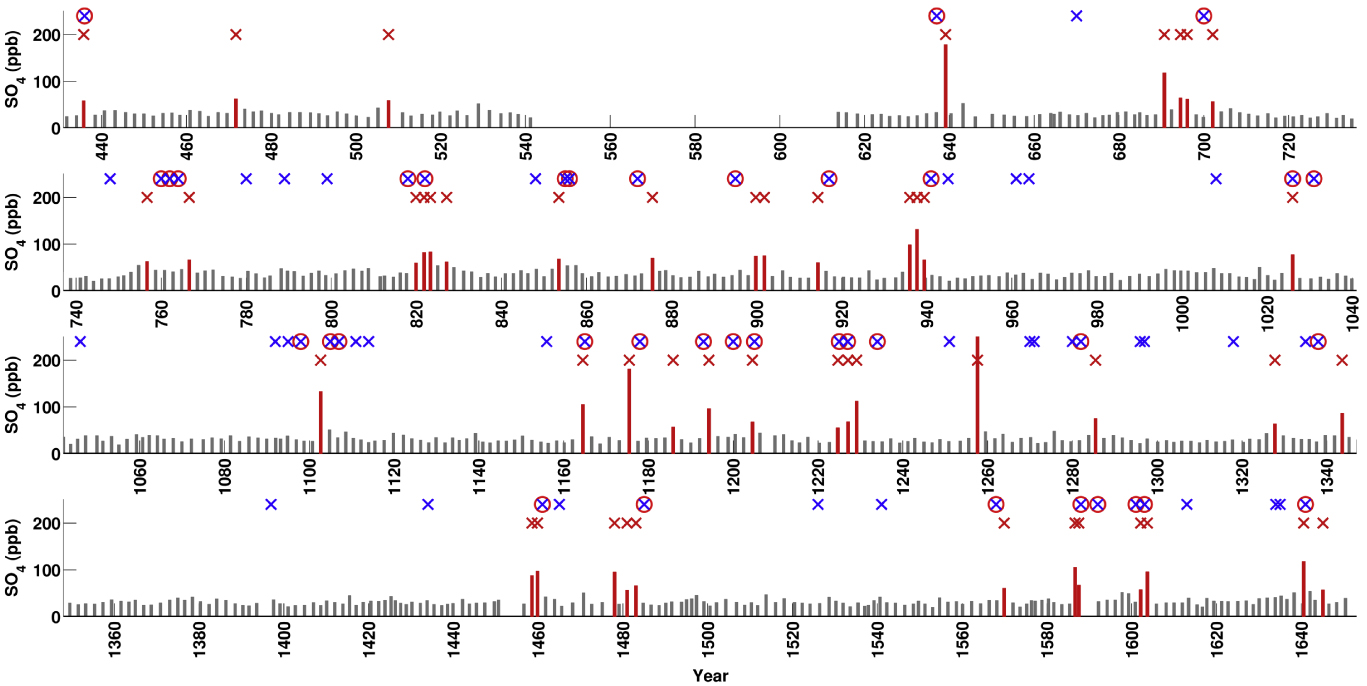
We find in actuality that 37 (53.6%) of our 69 cold events correspond to volcanic events within this window (figure 3) (conversely 38 (79.2%) of 48 volcanic events correspond to cold events). We use only 69 of 70 cold events because no GISP2 data are available at the time of the 586 CE cold event, but we note in passing a major volcanic event at 585 in the Dye 3 Greenland ice-core (Clausen et al 1997). Employing our distribution of random correspondences under the null hypothesis, we find that the probability of observing 37 correspondences by chance alone is <0.003 (i.e. the observed correspondence is statistically significant at the 99.7% confidence level). Note that the mean number of years covered by the randomized ± 5 year windows from which we build our distribution of random correspondences (and from which we observe the mean of 24.9 random correspondences) is much less than the 528 total years in which correspondences could be counted if all 48 windows were maximally distributed (i.e. (2 × 5 + 1) × 48 = 528). This is because it is exceedingly unlikely that the 48 volcanic event dates will have no overlapping windows when independently distributed.

Figure 3. GISP2 SO42− values and volcanic events, 431.80–1648.32, plotted against cold events. Columns represent the GISP2 SO42− series. Red columns are those SO42− values at or above the 55.16 ppb considered to indicate volcanic events. Red (or lower tier) Xs further denote volcanic event dates. Blue (or upper tier) Xs denote 69 cold events from the Annals, excluding 586 CE. Those cold events circled (in red) correspond within ± 5 years to volcanic events. 37 (53.6%) of 69 cold events correspond to volcanic events. This correspondence is statistically significant at the 99.7% confidence level. Note: the SO42− value for the volcanic event at 1257.62 is truncated for visual purposes and amounts to 380.61 ppb.
Download figure:
Standard image High-resolution imageTo further evaluate the robustness of the observed correspondence between volcanic events and cold events, we conduct several further tests. We first repeat our analysis by iteratively varying the width of the correspondence window to include all integer values of 1 ≤ N ≤ 5. While the number of observed correspondences varies in each window, the null hypothesis that the correspondence arises purely by chance is rejected, in all cases, at p < 0.05 (i.e. >95% confidence).
In table 3, supplementary data (available at stacks.iop.org/ERL/8/024035/mmedia), we show that multiple cold events at times correspond to single volcanic events, and vice versa. This is physically plausible given the potential multi-year climatic impact of major eruptions, and the compounding impact of multiple closely-spaced eruptions. However, as an additional robustness test we examine whether the inferred non-randomness of the on-aggregate correspondence between cold events and volcanic events is dependent upon the correspondence of multiple cold events with single volcanic events. We repeat our analysis, enforcing a restriction that each volcanic event can only 'explain' one cold event within its window. For parity, we impose this restriction on both the re-count of actually-observed correspondences and the model of the null hypothesis, which we invoke 1 000 000 times to build a distribution of the number of such correspondences expected randomly. Under this restricted definition of correspondence, the significance of the result is found to be >99.9% (p < 0.001).
For the above analyses we employed an objective test to identify significantly outlying values in the GISP2 SO42− series reflecting the incidence of major explosive eruptions, but previous estimates using independent methods also exist. Repeating our analysis using the somewhat smaller list of volcanic events identified from the GISP2 by Zielinski (1995), we again find a correspondence between volcanic events and cold events (± 5 year window) that is statistically significantly non-random at p < 0.01 (i.e. >99% confidence). As a final check, we repeat our analysis using the 21 October 2012 (Version 2) update to the Gao et al (2008) multi-ice-core reconstruction of global explosive volcanism, using a correspondence window of ± 2 years to account for the greater number and presumed accuracy of the cores contributing to this reconstruction. We again find a statistically significant correspondence between volcanic events and cold events at p < 0.01 (i.e. >99% confidence).
4.2. Monthly distribution of cold event occurrence
The calendar months in which cold events occurred are cited or identifiable in the Annals for 38 (54.3%) of our 70 events (figure 4). 102 months are cited in total because single events can span multiple months. January is most often cited, with 23 (or 22.5%) of the 102 total citations, followed by February with 19 (18.6%). More evenly cited are December with 11 (10.8%), November with 10 (9.8%), March with 11 (10.8%) and April with 10 (9.8%). Other months are rarely cited, with only 2 citations each for June and July. There is thus a clear winter-season bias in cold event occurrence, a bias that persists for cold events that both do and do not correspond to GISP2 volcanic events under the ± 5 year window. 47 (46.1%) of 102 months are cited for cold events without, and 55 (53.9%) are cited for cold events with a volcanic correspondence. January and February remain the most frequently cited, with 11 (20.0%) and 8 (14.5%) of the 55 months cited for cold events having a volcanic correspondence.

Figure 4. Distribution of months cited in cold event occurrence. The green line (with boxes) shows the distribution of all 102 months cited. The red line (with filled circles) shows the distribution of all 55 months cited for cold events corresponding to volcanic events. The blue line (with diamonds) shows the distribution of all 47 months cited for cold events with no correspondence to volcanic events. We detect no statistically significant difference in the seasonality of volcanic and non-volcanic cold events.
Download figure:
Standard image High-resolution image
While the dominant citation of winter months for cold events that correspond to volcanic events is revealing of a role for volcanism in winter cooling of the Northeast Atlantic region represented by Ireland, the infrequent citation of summer cold should not be taken as evidence of its absence here. Oppenheimer (2011) describes, for example, the human impacts in Ireland of the cold wet summer following the 1815 Tambora eruption. Instead, our record acts primarily as a proxy for anomalous winter-season cold, because the phenomena and conditions such as heavy snow and frozen water bodies that were most impressive to the human observers compiling the Annals (and which more objectively indicate the occurrence of anomalous cold) are very rare in summer in Ireland's mild maritime climate (Sweeney 1997, Dukes and Eden 1997). That the summer cooling expected after major eruptions has in fact occurred for at least some of our 48 volcanic events is suggested given that the only citations for June and July occur for cold events with a volcanic correspondence, as well as the marginally greater number of such citations for other non-winter months.
5. Discussion
Observational studies identify direct radiative cooling in summer but dynamical warming in winter for Northern Hemisphere continental landmasses after low-latitude eruptions (Robock and Mao 1992, 1995, Robock 2000, Stenchikov 2009, Cole-Dai 2010). Climate models reproduce summer cooling but can be less successful in reproducing the expected dynamical winter warming (Driscoll et al 2012, Timmreck 2012). This warming is largely held to result from differential heating between low and high latitudes in the stratosphere, which is warmed by sulfate aerosol absorption of outgoing longwave and incoming solar near-infrared radiation, creating a steepened meridional temperature gradient. This promotes invigorated subpolar and midlatitude winter westerlies, resembling positive phases of the Arctic Oscillation (AO) and North Atlantic Oscillation (NAO) (Robock 2000, Shindell et al 2004, Stenchikov et al 2004, Fischer et al 2007, Graf et al 2007, Schneider et al 2009, Cole-Dai 2010). The AO and NAO represent the dominant mode of winter variability in Northern Hemisphere atmospheric circulation. Through the increased advection of warm oceanic air over Northern Hemisphere landmasses by vigorous westerly airflow, positive phases of the AO and NAO are broadly associated with winter warmth (Thomson and Wallace 1998, 2000, Stine and Huybers 2012), including for the North Atlantic region and Ireland (Sweeney 1997). Volcanically induced positive phases of the AO and NAO may thus mask any tropospheric cooling from volcanic aerosol scattering of incoming shortwave radiation in winter.
Given this well established mechanism, the winter bias in our cold events suggests that they may often result from high-latitude eruptions wherein dynamical warming does not clearly occur to overwhelm any radiative cooling (Oman et al 2005, Stenchikov 2009). This rationale is supported by the cold 1783/1784 European winter after the eruption of Laki (Iceland), beginning 1783 (Schmidt et al 2012). A further example is the prolonged eruption of Icelandic fissure volcano, Eldgjá, likely registered in the GISP2 by notably elevated SO42− in consecutive ice samples dated 936.00 (98.35 ppb), 937.70 (131.58 ppb) and 939.40 (66.17 ppb). A report for 939 from the Annals has been interpreted by McCarthy and Breen (1997a, 1997b), Oman et al (2006) and McCormick et al (2007) as a direct observation of Eldgjá's volcanic plume. This report remarks that 'the sun was the colour of blood from the beginning of day to midday on the following day' (Chronicon Scotorum), thus extending for too long to be a solar eclipse. The elevated sulfate in the GISP2 also corresponds to cold in 941, described as a 'severe frost so that the ice on lakes and streams was passable' (Annals of Ulster). Although the season in which this occurred was omitted, its position in the text as the first event reported this year may suggest its occurrence in the early months of the year. McCormick et al (2007) identify, moreover, a harsh winter in continental European sources, occurring in either the 939/940 or 940/941 winter season.
It appears likely, however, that some of our winter cold events may result from low-latitude eruptions, although the co-occurrence of unrecognized or potentially climatically effective mid and high-latitude eruptions is a complicating factor (see the comprehensive catalogue of historic eruptions by Siebert et al (2010)). One candidate is the tropical eruption of Huaynaputina, Peru, 1600 (Briffa et al 1998, Zielinski 2000, Thouret 2002). This is one of the few eruptions estimated at magnitude 6 on the volcanic explosivity index (VEI) (Siebert et al 2010) in our period of interest, and corresponds to cold from November to January 1601/1602 and January 1603 in Ireland. Another candidate is the eruption dated to 853.5 in the GISP2 record. This corresponds to cold in April 855 and November to January 855/856 in Ireland. Gao et al (2008) identify signals of major explosive volcanism from sulfate deposition in ice-cores from Greenland and Antarctica with an estimated eruption date of 854 accounting for a possible delay between eruption and deposition. Sigl et al (2013) observe notable sulfate deposition in the West Antarctic Ice Sheet (WAIS) Divide ice-core (starting 853.4, ending 855.2), which they correspond to deposition in the North Greenland Eemian Ice Drilling (NEEM) ice-core (starting 852.9, ending 853.6). Eruptions must generally be located in or near the tropics to result in bipolar sulfate deposition, suggesting that these signals indicate a major low or near-low-latitude eruption.
The possible occurrence of severe winter-season cooling in Ireland after low-latitude eruptions emphasizes the considerable complexity of the volcano-climate system in terms of the spatial expression of volcanic climatic impacts. Fei and Zhou (2009) similarly cite regional complexity in explanation for the apparent lack of winter warming in North China after the 1600 Huaynaputina eruption. Písek and Brázdil (2006) also stress the role of regional climate characteristics in mediating volcanic climatic impacts for Central Europe. Strong winter-season cooling in Ireland may therefore constitute a distinct regional tendency in response to both high and low-latitude explosive eruptions. But this response is not necessarily limited to, or a peculiarity of, Ireland's immediate maritime location. McCormick et al (2007) thus show that cold events in Ireland with a volcanic correspondence find corroboration in historical sources elsewhere in Western Europe for the period 750–950. This includes the above-discussed April 855 and November to January 855/856 cold events, the latter also coinciding with a harsh winter in France, and associated with a candidate low-latitude eruption.
The spatial expression of volcanic climate impacts is also expected to evolve markedly in each subsequent post-low-latitude-eruption winter season. Fischer et al (2007) examine the European climatic response to 15 tropical eruptions in large-spatial-scale multi-proxy temperature reconstructions for the past half millennium. They observe the expected widespread summer cooling, but the winter response is more spatially and temporally complex. Warming is greatest for Northern Europe (particularly Scandinavia and the Baltic) in the first and second post-eruption winters, whilst widespread cooling is observed in the first post-eruption winter over much of France up to approximately 50° N and elsewhere south of 45° N, becoming constrained further south in the second winter. A more ambiguous response is observed for Ireland, with marginal warming indicated in both winters. Galvin et al (2011) examine the evolution of winter-season response to five explosive tropical eruptions in long instrumental data from Ireland since 1800. They observe minor warming in the first and second post-eruption winters, but marked cooling in subsequent winters, although this may not represent the dynamical response to all major tropical eruptions, given the small sample size.
To further interpret our results it will thus be critical to establish which post-eruption winter seasons our cold events occurred in. This is currently difficult, but future improvements in the precision and accuracy of ice-core chronologies may remedy this.
6. Conclusions
Previous work has largely used historical sources to identify the climatic impacts of particular pre-modern eruptions in isolation, albeit often over large spatial scales (e.g. Stothers 1998, 2000, Fei et al 2007). We instead focus on the Northeast Atlantic region as represented by Ireland and survey historical sources to systematically supply evidence of the climatic impact of explosive volcanism on a very considerable temporal scale (table 3, supplementary data (available at stacks.iop.org/ERL/8/024035/mmedia), details all correspondences between volcanic and cold events). The climatic impact of many eruptions resulting in ice-core sulfate deposition has often been inferred indirectly, as by tree-ring evidence for growing season conditions (e.g. Briffa et al 1998, Salzer and Hughes 2007), but can now be supported by direct human observations of (primarily) winter-season conditions from this region. Developing comparable documentary climatic records covering extended timescales for other regions will prove valuable in further resolving the spatial expression of volcanic climate impacts and identifying distinct regional responses. This is of great importance because it is at the regional scale that individuals and societies experience climate and plan for extreme weather. It is also at this scale that societies will differentially experience the impacts of possible geoengineering through stratospheric loading of sulfate aerosol.
Our results complement recent work on the contribution of solar variation to historic severe cold winters for United Kingdom (Lockwood et al 2010, 2011) and reveal a persistent tendency towards winter-season cooling in response to explosive volcanism at Ireland's climatically sensitive Northeast Atlantic location, as well as the large proportional contribution of volcanism to the occurrence of severe cold events here. The consistency of this response suggests that the region may be a key location for testing the veracity of climate model simulations of volcanic climate impact. We argue that greater emphasis should be placed on the prospect of severe volcanically induced regional-scale cooling in descriptions of the volcano-climate system that often primarily stress dynamical warming as the dominant winter-season impact of volcanism for Northern Hemisphere landmasses. The climatic record of the Annals can yet further contribute to understanding the volcano-climate system as variables that mediate volcanic climatic impacts are reconstructed with increasing confidence. These include not only the seasons, locations, magnitudes and chemical compositions of historic eruptions, but also the pre-eruption states of major modes of climatic variability such as the AO, NAO and ENSO.
Acknowledgments
We thank Brianán Nolan, William Nolan, Michael McCormick, Bruce Campbell, Arlene Crampsie, Valerie Hall, Andrei Kurbatov, Michael Monk, Daniel McCarthy, Peter Coxon, William J Smyth, Stephen McCarron, David Brown, David Dickson, Poul Holm, Barry O'Dwyer, Michael Sigl, Kees Nooren, Edward R Cook, Gill Plunkett, Chaochao Gao and Alan Robock for discussion of the results and/or the manuscript. Francis Ludlow was funded to undertake part of this work by a Ziff Environmental Fellowship from the Harvard University Center for the Environment, a Government of Ireland Postgraduate Scholarship from the Irish Research Council for the Humanities and Social Sciences, and additional funding from the Irish Environmental Protection Agency's Climate Change Research Programme (2007/CCRP/2.7—Extreme Weather, Climatic Shifts & Natural Disasters in Ireland). Alexander R Stine was funded to undertake part of this research by a Kernan Brothers Environmental Fellowship from the Harvard University Center for the Environment, and by a National Science Foundation grant (NSF ATM-0902374). Francis Ludlow and Alexander R Stine thank the Harvard Open-Access Publishing Equity (HOPE) Fund for contributing to the open-access article charge. Paul Leahy and Gerard Kiely were funded by the Irish Environmental Protection Agency's Climate Change Research Programme (2007/CCRP/2.7). Paul Leahy and Paul A Mayewski thank the Science Foundation Ireland and the Climate Change Institute, University of Maine, respectively, for their contribution to the article charge. We thank the Corpus of Electronic Texts project (ucc.ie/celt) for access to hypertext editions of sources and word counts of the Irish Annals. We thank the two anonymous reviewers for their valuable comments on the manuscript.