
Abstract
Irrigation consumes more water than any other human activity, and thus the challenges of water sustainability and food security are closely linked. To evaluate how water resources are used for food production, we examined global patterns of water productivity—food produced (kcal) per unit of water (l) consumed. We document considerable variability in crop water productivity globally, not only across different climatic zones but also within climatic zones. The least water productive systems are disproportionate freshwater consumers. On precipitation-limited croplands, we found that ∼40% of water consumption goes to production of just 20% of food calories. Because in many cases crop water productivity is well below optimal levels, in many cases farmers have substantial opportunities to improve water productivity. To demonstrate the potential impact of management interventions, we calculated that raising crop water productivity in precipitation-limited regions to the 20th percentile of productivity would increase annual production on rainfed cropland by enough to provide food for an estimated 110 million people, and water consumption on irrigated cropland would be reduced enough to meet the annual domestic water demands of nearly 1.4 billion people.
Export citation and abstract BibTeX RIS

Content from this work may be used under the terms of the Creative Commons Attribution 3.0 licence. Any further distribution of this work must maintain attribution to the author(s) and the title of the work, journal citation and DOI.
1. Introduction
The world is facing twin challenges of water stress and food insecurity—challenges that are already pressing and are projected to grow [1–3]. Because crop production is the largest global consumer of freshwater, and because water is a key resource in food production, neither of these challenges can be addressed in isolation [4, 5]. Producing more food for each drop of water will be a crucial strategy to address both challenges [6].
Issues of global water availability and scarcity have been considered in a variety of ways, including identifying areas of water availability [7], water stress, [8–10], impacts of water use [11], and projections of future water scarcity [2, 12]. Many recent studies have tied water scarcity to agricultural water consumption [13–15]. For the most part, however, these studies have considered water consumption in relation to generic or country-level measures of crop production. However, a number of recent papers have highlighted the wide variability in crop yields worldwide, and located systems where yield improvements are possible [3, 16, 17]. Studies that link agricultural water consumption with detailed yield data tend to be strongly place-based [14, 18–20]. These studies provide key information about specific interventions to improve yields and reduce water use. Global-scale analysis can augment these studies by facilitating learning among systems that are geographically and culturally dispersed. Recognizing that, several reviews have consolidated and analysed field studies of crop water productivity [21, 22]. This study draws on both modelled and empirical data to analyse the global range of crop water productivity, providing insight into the magnitude and location of potential levers of change.
When water is scarce, understanding the magnitude of water consumption is important. In most cases, however, evaluation for decision-making requires information about efficiency—when water is being used, is it being used wisely? With new water consumption [23] and crop production data [17], we can quantitatively assess the range of crop water productivity worldwide. Locating the low end of this range is additionally useful because efficiency improvements tend to be easiest where efficiency is low [24, 25]. Finally, global data allow inference making about drivers of variation in crop water productivity.
Here we assess global-scale patterns of crop water productivity for 16 major food crops using spatially distributed, crop-specific water consumption and yield data. We quantify the tradeoffs between water consumption and food production, evaluate the extent to which factors other than climate limit crop water productivity, and illustrate potential benefits of improved water productivity worldwide.
2. Methods
We analysed crop production, water use, and crop water productivity for 16 staple food crops: wheat, maize, rice, barley, rye, millet, sorghum, soybean, sunflower, potato, cassava, sugarcane, sugar beet, oil palm, rapeseed (canola), and groundnut (peanut). These crops constitute 56% of global crop production by tonnage [26], account for 65% of crop water consumption [23], and cover 68% of all cropland [17]. Crop water productivity is defined here as food (edible) kilocalories produced per litre of evapotranspiration, evaluated separately for rainfed and irrigated crops. We evaluate kilocalories as a proxy for crop production based on FAO weight conversions [27] to facilitate comparison among the range of crop water productivity without regard for weighing conventions and to provide insight into food production. Crop choice represents one important strategy farmers use to adapt to changing climate, resource availability, and socioeconomic drivers, and direct comparison of crop water productivity among crops potentially facilitates this [28]. Our analyses are focused on potentially water-limited regions (P < PET) because inefficiencies are more pressing where water is scarce. In precipitation-limited regions, the majority of the 16 crops we analyse goes directly to food production (92%, compared to 79% in more humid regions) [3].
2.1. Variation in crop water productivity
Crop production and water consumption data for irrigated and rainfed crops were provided by Siebert and Döll [23], who computed daily water balances and corresponding crop water requirements using the FAO Penman–Monteith method of reference evapotranspiration [29] modified by crop coefficients and considering crop areas and crop calendars [30]. For irrigated crops, actual evapotranspiration (AET) was assumed to be equal to potential evapotranspiration (PET), with irrigation water compensating for any rainwater deficit; supply-side limitations to irrigation were thus not incorporated into the model. In addition, our analysis of irrigated crops evaluates beneficial irrigation only, as data on use for other irrigation-related activities (salt flushing, soil preparation in rice paddies) are not globally available [23]. The ratio between AET and PET was used to separate and downscale yields between irrigated and rainfed crops. Yield data were originally developed by Monfreda et al [17] by combining census data for agricultural production with estimates of cropland extent derived from satellite imagery. The data have a spatial resolution of five arc minutes and report 7-year average yield and 5-year average water consumption centred on the year 2000.
To evaluate climate and non-climate effects on crop water productivity, we divided cropland into 20 climatic zones (SI figure 1 available at stacks.iop.org/ERL/8/024030/mmedia) defined by the ratio of mean annual precipitation (P) to mean annual potential evapotranspiration (PET) [31]. We attributed the difference in maximum water productivity across climatic zones to the effects of climate. In contrast, variation in water productivity within each climatic zone was attributed to non-climate effects. For statistical power, we considered only crops with an extent of >50 000 ha (irrigated) or >100 000 ha (rainfed) in a given climatic zone. Further detail on methods is provided in the supplementary information (SI, available at stacks.iop.org/ERL/8/024030/mmedia).
We calculated the Generalized inequality index (Gini) [32] to quantitatively compare inequalities in water productivity among crops and across regions. Cumulative water consumption and cumulative kilocalorie production for each crop at 5 arc minute resolution were ordered by water productivity; the 'curves' in figure 3(b) are compilations of these points.
2.2. Water productivity gap
For each crop, we calculated the production-weighted 20th percentile value for each climatic zone where P < PET. In each climatic zone, we identified all cropland where water productivity for each crop was less than its 20th percentile value. We then calculated the calories that could be added or water saved were the water productivity of any crop below its 20th percentile value increased to that value (SI table 1 available at stacks.iop.org/ERL/8/024030/mmedia). Because improvements for each crop are measured against its own 20th percentile value in the same climatic zone, improvements are scaled to the range of variability for each crop.
3. Results
3.1. Variation in crop water consumption and productivity
Water consumption by crops varies substantially across the globe (SI figure 2 available at stacks.iop.org/ERL/8/024030/mmedia), reflecting differences in cropping density, crop choice, soil characteristics, irrigation availability, and agricultural management as well as climatic drivers of evapotranspiration. The distribution of crop water consumption among climatic zones (figure 1) illustrates the crops likely to contribute substantially where water resources are scarce. In arid climates (P/PET < 0.2), rainwater consumption is dominated by millet and sorghum while irrigation water is mainly used for wheat and rice. In semi-arid and dry-sub-humid climates (0.2 < P/PET < 0.7), rainwater consumption is dominated by wheat, rice, and maize while irrigation water use is dominated by wheat, rice, sugarcane, and maize. For the 16 crops studied, 52% of rainwater consumption (by irrigated and rainfed crops) and 82% of irrigation water consumption occur in regions where precipitation is potentially limiting (P < PET).
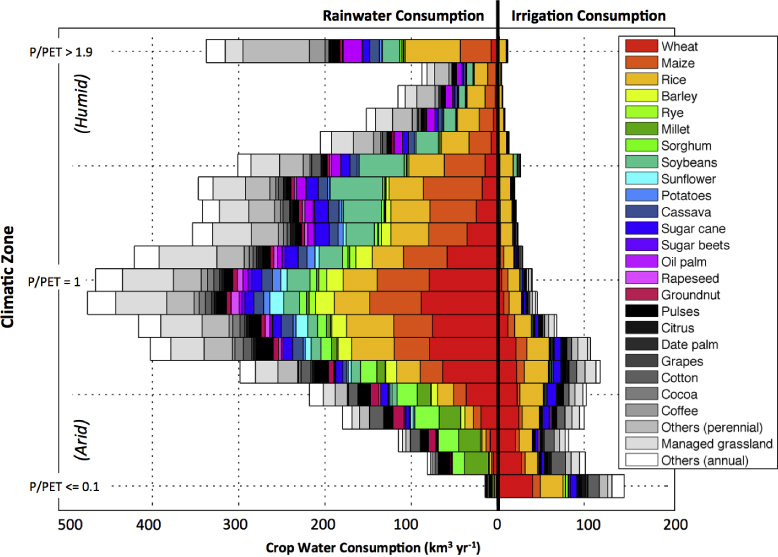
Figure 1. Annual water consumption across climatic zones. Rainwater (left of centre line) and irrigation water (right of centre line) consumption by all crops, including those (in greys) that are not included in this analysis. For the 16 food crops analysed, the majority (83%) of water originates as rainfall on cropland. Climatic zones, most arid at the bottom and most humid at the top, are based on P/PET and are evenly distributed in climate space. Cropland in climatic zones in which P/PET > 1.9 are compressed into a single zone.
Download figure:
Standard image High-resolution imageWe found a large range in crop water productivity. For example, in large parts of Sub-Saharan Africa maize water productivity was below 1 kcal l−1 (0.3 kg m−3) while the highest water productivities of maize (>6 kcal l−1/1.7 kg m−3) were computed for the US corn belt and Northern China (figure 2). Field-based studies (such as those surveyed in [21, 22, 33]) document a similar range of water productivities; our analysis extends their insights to a broader set of climates, locations, and crops.
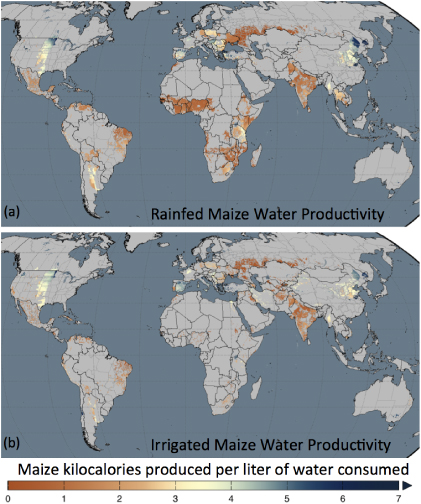
Figure 2. Maize water productivity in precipitation-limited regions. Data for both (a) rainfed and (b) irrigated systems are centred at 3.5 kcal l−1/1.0 kg m−3, close to the median production-weighted water productivity for rainfed (3.2 kcal l−1/0.9 kg m−3) and irrigated (3.5 kcal l−1/1.0 kg m−3) maize where P < PET, so that areas of relatively low water productivity are shown in orange and areas of relatively high water productivity are shown in blue.
Download figure:
Standard image High-resolution imageVariation in water productivity causes water consumption in certain areas to be disproportionately large. On the least water productive rainfed cropland in precipitation-limited regions, ∼46% of water was consumed in the production of just 20% of maize calories. Irrigated crops consume both rain and irrigation water—for those low productivity irrigated croplands in precipitation-limited regions where irrigation water provides at least 50% of total water, ∼44% of irrigation water consumption by maize went to 20% of food production.
Crop water productivity is not evenly distributed (figure 3). For example, for irrigated wheat in precipitation-limited areas, the USA has a national-level water productivity (2.9 kcal l−1/0.9 kg m−3) that is close to the world average (2.8 kcal l−1/0.9 kg m−3), but water productivity is unevenly distributed (Gini of 0.32) compared to, for example, China, where irrigated wheat water productivity is uniformly high (4.3 kcal l−1/1.3 kg m−3) and evenly distributed (Gini of 0.09).
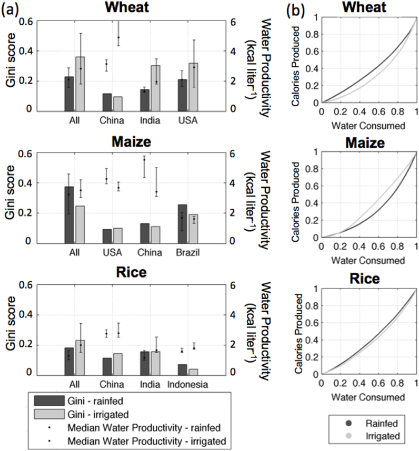
Figure 3. Disproportionate water consumption by major producers in precipitation-limited areas. (a) Bars show the Generalized inequality index (Gini) for crop water consumption for each crop in all precipitation-limited areas (P < PET) and for precipitation-limited areas in countries with the greatest production of each crop. Gini values range from 0 to 1; higher values reflect more disproportionate water consumption. The calorie-weighted median value of water productivity for each group is also shown (black dot, error bars are 25th and 75th percentile values). (b) Fraction of cumulative annual water consumption compared to cumulative annual kilocalorie production for rainfed and irrigated systems in precipitation-limited areas. Curves with more convexity reflect more disproportionate water consumption.
Download figure:
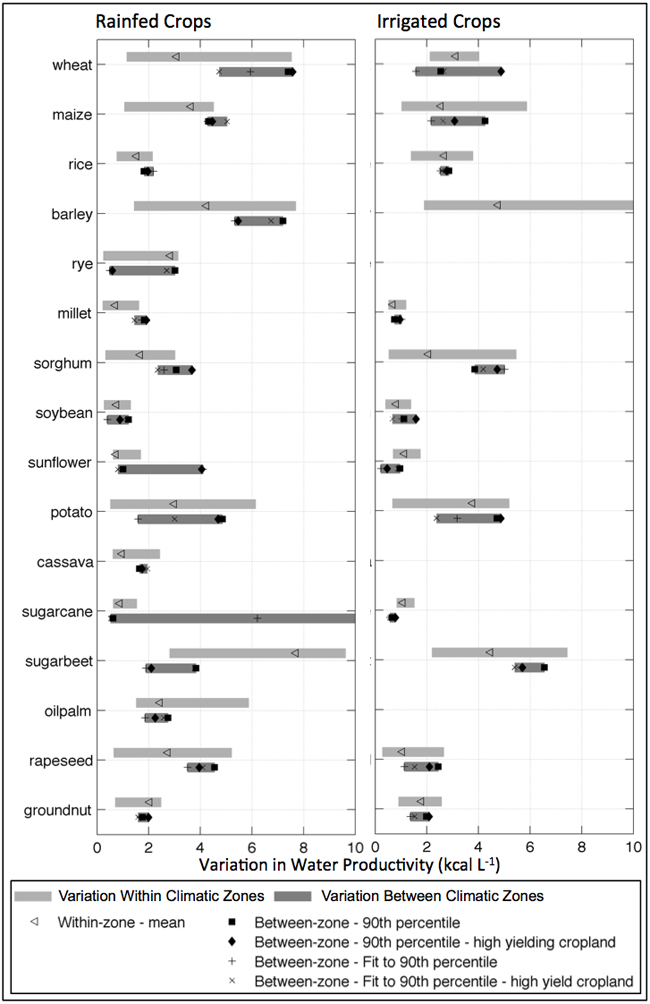
Standard image High-resolution imageVariation in crop water productivity is not solely a function of climate. While each crop we analysed has its highest water productivity in specific climatic zones, water productivity varied within each climatic zone (SI figures 3 and 4 available at stacks.iop.org/ERL/8/024030/mmedia). For most crops, we see as much variability in water productivity resulting from non-climate drivers as from climate (figure 4).

Figure 4. Variation of water productivity within and between climatic zones. Variation in water productivity within climatic zones (light grey bars) is similar to variation between climatic zones (dark grey bars) for both rainfed (left) and irrigated (right) crops. For each crop, we report a range of variability.
Download figure:
Standard image High-resolution imageFor irrigated crops, we evaluated water productivity based on combined evapotranspiration of rain and irrigation water. Water productivity of only irrigation (blue) water is a function of both fraction of overall water originating as irrigation water and total crop water productivity. The fraction of irrigation water is strongly correlated with aridity (Pearson's r2 is 0.96 for wheat, 0.85 for maize, and 0.99 for rice), while water productivity of irrigated crops is not (SI figure 4 available at stacks.iop.org/ERL/8/024030/mmedia). We therefore focus on overall water productivity of irrigated crops. Though the full impact of increasing water productivity of irrigated crops would not be gained in irrigation savings, it would result in a lower irrigation water requirement, particularly in more arid climates.
3.2. A water productivity gap
If water productivity on only the least productive, precipitation-limited croplands were increased, the impact would be substantial. For illustrative purposes, we assume all rainfed improvements go towards production and all irrigated improvements go to water savings. On rainfed cropland in precipitation-limited regions, increasing water productivity to the 20th percentile could increase production by ∼120 trillion kilocalories per year while holding water consumption constant (figure 5(a)). This amounts to a ∼30% increase over current production in these areas and would provide food for ∼110 million people annually (assuming an average food requirement of 3000 kcal d−1 cap−1 [34]). On irrigated croplands, increasing the lowest water productivity in precipitation-limited regions could save ∼77 km3 yr−1 of water without reducing food production (figure 5(b)). This water savings amounts to more than one quarter of current water consumption on low water productivity irrigated cropland and would be enough to meet the annual domestic water demand of ∼1.4 billion people (assuming a demand of 150 l d−1 cap−1 [35]).
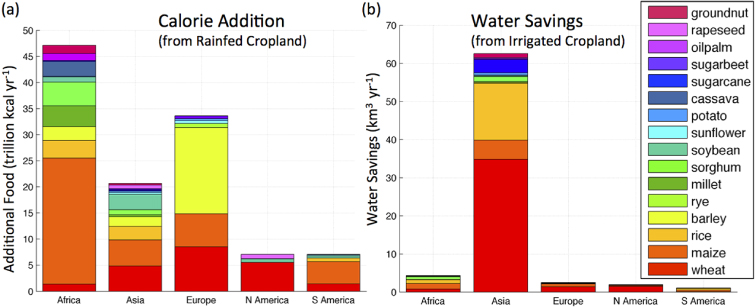
Figure 5. Impact of increasing water productivity on the least water productive cropland in precipitation-limited areas. Regional and crop-specific contribution to (a) increased food production and (b) water savings from increasing water productivity to the calorie-weighted 20th percentile.
Download figure:
Standard image High-resolution imageTo identify countries where water savings on irrigated cropland would be most beneficial, we analysed irrigation water consumption on cropland with the lowest 20% of water productivity in precipitation-limited climates (figure 6). India accounts for more than 40% of total irrigation water consumption in these areas, 67 km3 yr−1, primarily in wheat and rice cultivation. Because India has so much cropland in these areas, however, irrigation intensity (consumption per hectare) is ∼520 mm yr−1, close to the median value of irrigation intensity on all precipitation-limited, low water productivity cropland (∼500 mm yr−1). By contrast, in similar climates in Uzbekistan, food crops consume only ∼3 km3 yr−1. However, irrigation intensity (∼1400 mm yr−1) is nearly three times greater. Because of low total water consumption, improving irrigation efficiency of food crops in Uzbekistan is unlikely to alleviate basin-wide water shortages, though on-farm impacts may be dramatic. In India, by contrast, small but widespread improvements in irrigation intensity could have a substantial impact. Assessments should not assume that high irrigation consumption is linked to high irrigation intensity.

Figure 6. Annual water consumption by country for 16 food crops in precipitation-limited areas with low water productivity. Countries are ranked by (a) irrigation water consumption as well as by (b) irrigation intensity (consumption per hectare). We limited analysis of high-irrigation intensity countries to those where irrigation consumption on precipitation-limited, low water productivity cropland was at least 0.5 km3 yr−1.
Download figure:
Standard image High-resolution image
4. Discussion
4.1. Implications of findings
We sought to quantify the range of tradeoffs between crop water use and production to explore, first, the feasibility of interventions to increase food production and reduce water consumption by improving crop water productivity, and, second, to quantify the potential magnitude of this type of intervention. The extensive variability in crop water productivity within climatic zones indicates that there are many non-climate related drivers of low crop water productivity, and these can potentially be managed. Even when limitations are due to soil or slopes, management techniques such as nutrient addition and terracing or furrowing can improve yields [36]. Water productivity is a ratio, and in many cases low water productivity is likely a function of low yield, so interventions to increase water productivity may focus more on improving yield than on decreasing water consumption.
Specific management strategies to increase crop water productivity must be tailored to local contexts; studies in Nigeria, Sudan, and Niger, for example, have shown that nitrogen and phosphorus limitation restrict millet and sorghum yields [37]. Water productivity could be increased by increasing yields via improved soil nutrient conditions and reduced wind-driven erosion. Examples of other interventions that have demonstrated improvements in water productivity include: rainwater harvesting and local water storage, applying drip or deficit irrigation, adjusting planting dates, and modifying tillage practices to reduce evaporation [21, 25, 33, 38–40]. In many cases, techniques for increasing water productivity, especially when it is low, require little or no additional water [41].
Any improvement in crop water productivity will have a positive effect on either food production or water savings. We demonstrate the magnitude of increasing low water productivity to the 20th percentile because this is a plausible level of increase. Allocative efficiency demonstrates that it is easier to increase resource use efficiency when resources are used inefficiently; improving the very lowest performing systems therefore should take less effort than improvements in high-performing systems [24, 25]. Implications of crop water productivity improvements to other levels are discussed in the SI (available at stacks.iop.org/ERL/8/024030/mmedia).
4.2. Limitations
By limiting our analysis to 16 crops, our study does not provide a complete picture of all global crop water use or food production. Further, due to data limitations, we are unable to assess water requirements to prevent salinization or for non-beneficial irrigation. Our analysis thus underestimates the volume of water required for irrigated agriculture, particularly in arid regions where irrigation water is often the primary source of water for irrigated crops. In addition, we assume all irrigation demand is met and that irrigation is not limited by water supply. These issues loom large in local and regional management, and we hope to address them at the global scale in the future. We also do not assess production losses due to spoilage, animal feed, or post-consumer waste. The end points of food production provide important context in decision-making about water allocation but are outside the scope of the current research.
We address limitations of methodology in the SI (available at stacks.iop.org/ERL/8/024030/mmedia) in detail.
5. Conclusions
By reducing the amount of water required for crop production, increasing crop water productivity is a key strategy for achieving food security and water sustainability in a world with growing demands for both. If, for example, low water productivity in precipitation-limited regions were raised to the 20th percentile, the total rainfed food production in Africa could be increased by more than 10% without exploiting additional cropland. Similar improvements in water productivity on irrigated cropland could reduce total water consumption by ∼8–15% in precipitation-limited regions of Africa, Asia, Europe, and South America.
The estimated effects of changing management on water productivity are close to the mean water productivity observed for each crop, demonstrating that in many low-productivity systems on-farm interventions can be a leverage point for increasing water productivity. Global analyses like the one presented here can help generalize findings from field-level or regional agronomic studies. However, appropriate management activities to increase crop water productivity will vary regionally and even locally.
Acknowledgments
Research support was provided by a grant from the Institute on the Environment and by the Gordon and Betty Moore Foundation. This work also benefited from contributions by General Mills, Mosaic, Cargill, Google, PepsiCo, and Kellogg to support stakeholder outreach and public engagement. We also wish to thank two anonymous reviewers for thoughtful comments on an earlier draft.