
Abstract
Atmospheric particles influence the climate indirectly by acting as cloud condensation nuclei (CCN). The first aerosol indirect radiative forcing (FAIRF) constitutes the largest uncertainty among the radiative forcings quantified by the latest IPCC report (IPCC2007) and is a major source of uncertainty in predicting climate change. Here, we investigate the anthropogenic contribution to CCN and associated FAIRF using a state-of-the-art global chemical transport and aerosol model (GEOS-Chem/APM) that contains a number of advanced features (including sectional particle microphysics, online comprehensive chemistry, consideration of all major aerosol species, online aerosol–cloud–radiation calculation, and usage of more accurate assimilated meteorology). The model captures the absolute values and spatial distributions of CCN concentrations measured in situ around the globe. We show that anthropogenic emissions increase the global mean CCN in the lower troposphere by ∼60–80% and cloud droplet number concentration by ∼40%. The global mean FAIRF based on GEOS-Chem/APM is −0.75 W m−2, close to the median values of both IPCC2007 and post-IPCC2007 studies. To the best of our knowledge, this is the first time that a global sectional aerosol model with full online chemistry and considering all major aerosol species (including nitrate, ammonium, and second organic aerosols) has been used used to calculate FAIRF.
Export citation and abstract BibTeX RIS

Content from this work may be used under the terms of the Creative Commons Attribution 3.0 licence. Any further distribution of this work must maintain attribution to the author(s) and the title of the work, journal citation and DOI.
1. Introduction
Cloud droplets form onto pre-existing atmospheric particles or cloud condensation nuclei (CCN). For a given meteorological condition, an increase in CCN associated with anthropogenic emissions leads to an increase in both the number of cloud droplets and the scattering of solar radiation [1]. This is known as the Twomey effect or the first aerosol indirect radiative forcing (FAIRF). According to the Fourth Assessment Report of the Intergovernmental Panel on Climate Change (IPCC) published in 2007 [2] (named thereafter IPCC2007), the global annual mean FAIRF is −0.7 W m−2 with a 5–95% confidence range from −1.8 to −0.3 W m−2 and a low level of scientific understanding. The spread among model-calculated FAIRF values constitutes the largest uncertainty among the quantified radiative forcings [2]. FAIRF values based on post-IPCC2007 studies still vary significantly [3–10]. There also exist large differences between model-derived and observation-constrained FAIRF values and the exact source of the difference is still under debate [6, 11–13]. In order to confidently interpret past and project future climate change, the reduction of FAIRF uncertainty or diversity is essential.
As pointed out in IPCC2007, a major source of FAIRF uncertainty is poor knowledge of the number concentration and spatial distribution of pre-industrial (PI) and present-day (PD) aerosols. Most (if not all) IPCC2007 and post-IPCC2007 FAIRF studies are based on global models with simplified chemistry and aerosol microphysics. For example, most of these studies simulated the sulfur cycle chemistry only and used off-line monthly mean concentrations of key oxidants. The aerosol size distributions, which are important for CCN calculation and aerosol indirect forcing, are either prescribed or predicted with a simplified modal approach. Among the 20 previous FAIRF studies listed in the table 2.7 of IPCC2007, at least 15 of them employed the prescribed (or bulk) aerosol scheme that assumes globally uniform size distributions. Bellouin et al [8] showed substantial differences in the aerosol forcings simulated by the bulk and modal schemes, and they pointed out that the bulk approach lacked the necessary sophistication to provide realistic aerosol input for aerosol–cloud–radiation calculations. More post-IPCC2007 FAIRF studies are based on the modal scheme which employs one or more log-normal modes to represent aerosols of various types. While the modal approach is more sophisticated compared to the bulk scheme, the assumption of fixed mode widths (or standard deviations), ranges and size distribution shapes can result in large biases in simulated particle size distributions and CCN concentrations [14–16]. Global size-resolved sectional particle microphysics models, aiming to simulate more accurately the particle size distributions, have been developed [15–20]. A comparison of modal and sectional aerosol schemes within the same global models showed that the sectional approach better reproduces observed size distributions at CCN sizes, and the parameters in the modal scheme need to be adjusted to achieve better agreement with the observations [15, 16]. Nevertheless, due to the computational cost, most FAIRF studies are still based on the bulk or modal aerosol scheme.
Yu and Luo [20] integrated a computationally efficient advanced particle microphysics (APM) model into a global chemical transport model (CTM) GEOS-Chem [21], allowing one to explicitly and more accurately simulate global size-resolved sectional particle microphysics at an affordable computational cost. The GEOS-Chem model, driven by assimilated GEOS-5 meteorology, contains a number of state-of-the-art modules treating comprehensive chemical and aerosol processes [21–29]. Here we expand the capability of GEOS-Chem/APM by (1) coupling it with the widely used rapid radiative transfer (RT) model for GCMs (RRTMG) [30] and (2) relating the APM-predicted particle size distributions to the cloud droplet number concentrations and therefore, the droplet radius and cloud albedo [31]. The resulting model is then employed to study the contribution of anthropogenic emissions to CCN and the first aerosol indirect climate effect. The GEOS-Chem/APM-RRTMG contains a number of advanced features that address some limitations of the aforementioned previous FAIRF studies, which should help to reduce the uncertainty of FAIRF and improve its level of scientific understanding.
2. Models and simulations
To study aerosol impacts on cloud albedo and solar radiation, we have fully integrated RRTMG for shortwave (SW) into GEOS-Chem/APM (see supporting information, available at stacks.iop.org/ERL/8/024029/mmedia, for details of the two models). The GEOS-Chem/APM model explicitly simulate the formation and their growth of secondary particle (composed of sulfate, nitrate, ammonium, and secondary organic aerosol) as well as the coating of secondary species on primary particles (black carbon, primary organic carbon, dust, and sea salt particles) [20]. RRTMG-SW is called as a column model for online RT calculation at every chemistry time step. The variables inputted to RRTMG include solar zenith angle, surface temperature and albedo, along with the following profiles: (1) pressure, (2) temperature, (3) mixing ratios of CO, O3 and water vapor, (4) aerosol extinction coefficient, single scattering albedo and asymmetry parameter at fourteen shortwave bands, (5) cloud cover and water content, and (6) effective radius of liquid cloud droplets. Default mixing ratios are assumed for CO2, N2O, CH4, and O2. The effects of atmospheric particles on ice formation are currently insufficiently understood and, similar to IPCC2007 studies, not considered in our FAIRF calculations. Items 1, 2, 5, and surface temperature are from GEOS-5 assimilated meteorology. Items 3 and solar zenith angle are from GEOS-Chem. Item 4 is calculated from APM-predicted aerosol properties [32]. The surface albedo dataset is taken from MODIS satellite retrievals [33]. The calculation of cloud droplet effective radius (item 6), key to FAIRF, is described below.
Effective radius of cloud droplets depends on water content and the number concentrations of particles activated as CCN. Besides particle size distributions and compositions, cloud scale vertical velocity is also important for aerosol activation. The large scale vertical velocity provided by assimilated GEOS-5 meteorology does not resolve sub-grid variations that determine cloud droplet nucleation [34]. In our study, the sub-grid scale variability of vertical velocity is prescribed by a normal probability distribution function (PDF) [35], with the large scale vertical velocity as its mean value and a standard deviation of 0.5 m s−1 which was derived from measured updrafts in stratiform clouds [36]. The PDF approach to approximate the sub-grid scale variability has been employed in several previous studies [37, 38], whose results have been used in IPCC2007. The cloud droplet number (CDN) concentration is calculated from the APM-predicted aerosol size distributions using a Köhler-based activation parameterization. This parameterization combines the treatment of multiple aerosol types and a sectional representation of size to deal with arbitrary aerosol mixing states and size distributions [31]. This mechanistic parameterization relating the aerosol properties and CDN takes advantage of the detailed size, composition, and mixing state resolved particle properties predicted by the GEOS-Chem/APM. The CDN concentration is then used to calculate the cloud droplet effective radius needed by RRTMG with the formula given in [39]. It should be noted that different treatments of aerosol–cloud interaction processes can cause substantial variations in the derived FAIRF values [38, 39], which is out of the scope of the present study.
IPCC has defined the FAIRF as the influence of increased aerosol concentration (due to anthropogenic emissions) on the cloud optical properties and top of the atmosphere solar fluxes while holding the cloud fraction and liquid water content (i.e., in an entirely diagnostic manner where feedback mechanisms do not occur). GEOS-Chem, as a CTM driven by assimilated meteorology, is perfectly suitable for FAIRF calculation. To obtain the IPCC-defined FAIRF, we ran two simulations (10/2005–12/2006, first three months as spin up) driven by the same assimilated GEOS-5 meteorology fields: one with the present-day (PD) emissions (corresponding to year 2006) and the other with the pre-industrial (PI) emissions as specified in AeroCom II [40]. Eruptive volcano emission is turned off in both simulations. The annual mean results presented below are based on v8-03-02 of GEOS-Chem with APM and RRTMG integrated. The horizontal resolution is 2° × 2.5° and there are 47 vertical layers in the model (surface to 0.01 hpa). The time step is 10 min for transport, and 30 min for chemistry, size-resolved aerosol microphysics, and RT calculation.
3. Results
Table 1 summarizes the globally and annually averaged SO2 and H2SO4 vapor concentrations ([SO2] and [H2SO4]), nucleation rate (J), concentrations of condensation nuclei larger than 10 nm (CN10), CCN at water supersaturation of 0.8% (CCN0.8), 0.4% (CCN0.4), and 0.2% (CCN0.2), and cloud droplet number (CDN) in the lower troposphere (averaged within lowest 18 model layers, surface to ∼3 km) under both pre-industry (PI) and present-day (PD) emissions, as well as the corresponding changes from PI to PD. The global mean values of key variables related to aerosols and FAIRF for both PI and PD cases, as well as the PI–PD changes showing the impacts of anthropogenic emissions (including various aerosol precursors and primary carbonaceous particles). To account for the differences in various altitudes and focus on the lower troposphere (LT), where warm clouds form, we average all the 3D variables in the lowest 18 model layers (from surface to ∼3 km) to simplify the comparisons. Figure 1 shows the horizontal distributions of [SO2], [H2SO4], J, CN10, CCN0.4, and CDN changes from PI to PD (the corresponding absolute values for the PI case are given in figure S1 in the supporting information, available at stacks.iop.org/ERL/8/024029/mmedia). CN, CCN, and CDN include contributions from both primary and secondary particles. We use the Köhler theory to calculate CCN at given supersaturation ratios from the APM-predicted aerosol size distributions. Thus CCN concentrations depend on both sizes and compositions. It is clear from table 1 and figure 1. that anthropogenic emissions have a significant effect on globally averaged [SO2], [H2SO4], J, concentrations of aerosols, CCN and CDN in the LT.
Table 1. Globally and annually averaged SO2 and H2SO4 vapor concentrations ([SO2] and [H2SO4]), nucleation rate (J), concentrations of condensation nuclei larger than 10 nm (CN10), CCN at water supersaturation of 0.8% (CCN0.8), 0.4% (CCN0.4), and 0.2% (CCN0.2), and cloud droplet number (CDN) in the lower troposphere (averaged within lowest 18 model layers, surface to ∼3 km) under both pre-industry (PI) and present-day (PD) emissions, as well as the corresponding changes from PI to PD.
| PI | PD | PI → PD change (%) | |
|---|---|---|---|
| [SO2] (ppt) | 66.4 | 256.0 | 285 |
| [H2SO4] (ppt) | 0.077 | 0.123 | 60 |
| J (# cm−3 s−1) | 0.009 | 0.021 | 118 |
| CN10 (# cm−3) | 385.4 | 569.4 | 45 |
| CCN0.8 (# cm−3) | 197.6 | 323.8 | 61 |
| CCN0.4 (# cm−3) | 128.4 | 224.5 | 75 |
| CCN0.2 (# cm−3) | 86.7 | 158.2 | 82 |
| CDN (# cm−3) | 159.9 | 228.0 | 41 |
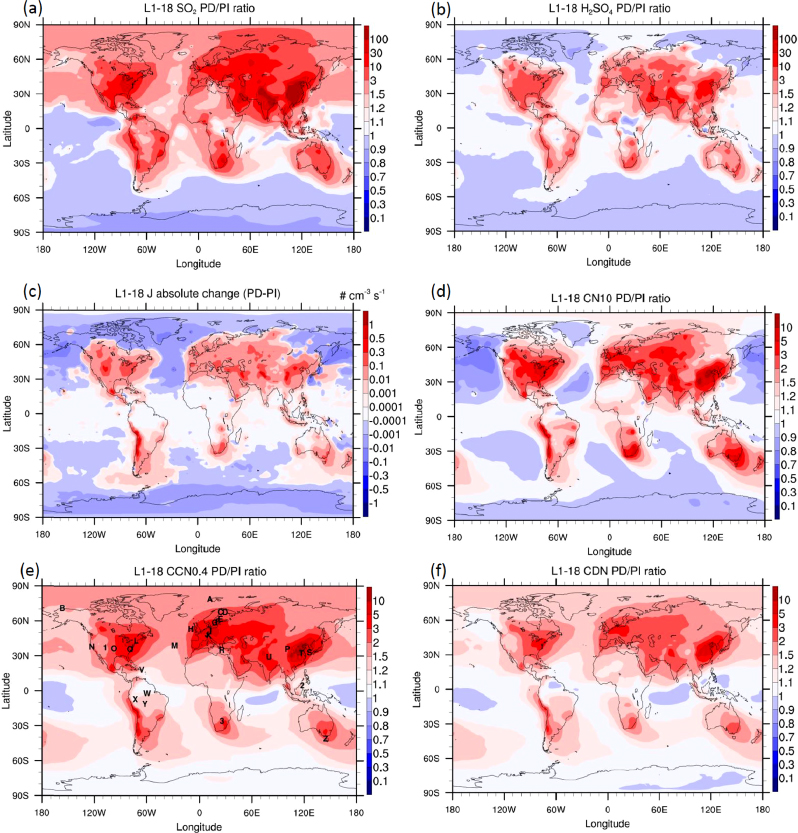
Figure 1. Impacts of anthropogenic emissions on annual mean SO2, H2SO4, J, CN10, CCN0.4, and CDN in the low troposphere (averaged within lowest 18 model layers, surface to ∼3 km). PD/PI ratios are given for all parameters except J as PD/PI ratios for J can be very big in the tropical region due to negligible J values in the region for both cases. Letters and numbers marked on panel (e) are the locations of sites where surface-based CCN0.4 measurements (for periods lasting a few weeks to more than a year) used for comparison in figure 2.
Download figure:
Standard image High-resolution imageH2SO4 vapor, produced via oxidation of SO2 from both anthropogenic and natural (dimethyl sulfide, volcano, etc) sources, is known to play an important role in forming and growing new particles that dominate particle number concentrations in most parts of the globe [20]. Without anthropogenic emissions (i.e., PI case), global mean LT [SO2] and [H2SO4] are respectively 66.4 ppt and 0.077 ppt (table 1). Anthropogenic emissions significantly increase [SO2] over major continents, by a factor of 3–30 over large areas and above 100 over parts of China and India (figure 1(a)). It is interesting to note that [SO2] slightly decreases over remote oceans in the southern hemisphere (SH) and over Antarctica, likely as a result of changes in atmospheric oxidation capacity and chemistry associated with anthropogenic emissions. Compared to the global mean LT [SO2] increase of 285%, global mean LT [H2SO4] enhancement is only ∼60%, with most of enhancement confined to anthropogenic source regions (figure 1(b)). In addition to the decrease of [H2SO4] over SH high latitude regions as a result of lower [SO2], [H2SO4] also decreases over the high latitude regions in the northern hemisphere (NH). This decrease, away from source regions, and the relatively weaker enhancement of [H2SO4] over source regions are largely a result of the condensation sink increase associated with anthropogenic emissions. The spatial distribution of J changes in the LT due to anthropogenic emissions (figure 1(c)) is similar to that of [H2SO4] (figure 1(b)), which is expected as both PI and PD cases use the same meteorology fields. Anthropogenic emissions enhance the global mean J in the LT by 118%, with most of the increase over major SO2 source regions (figure 1(c)). J decreases substantially in the middle and high latitude regions away from anthropogenic SO2 sources, which is caused mainly by the decrease of [H2SO4] (figure 1(b)) and increase of total particle surface areas in these regions.
In the atmosphere, the fraction of particles that can act as CCN and produce cloud droplets depends on particle number size distribution and the water supersaturation ratio attained in clouds (up to ∼0.8% for convective clouds and ∼0.2% for stratus clouds). The main factors controlling the particle number size distribution include emission, nucleation, growth, coagulation, wet scavenging and transport. As we can see from table 1, anthropogenic emissions increase global mean LT CN10, CCN0.8, CCN0.4, CCN0.2, and CDN by 45%, 61%, 75%, 82%, and 41%, respectively. The relative increase of CDN is smaller (compared to those of CCNs) is a result of a larger fraction of CCN getting activated under the clean PI emission scenario. Most of the increases are over major continents and immediate outflow regions, with CN10, CCN0.4, and CDN enhanced by a factor of ∼3–10 near where major anthropogenic emissions are located (figure 1). CN10 decreases substantially in the regions far away from anthropogenic emissions (figure 1(d)) due to the reduction in the nucleation rates (figure 1(c)). In contrast, CCN0.4 and CDN increase in most parts of the remote regions except over some tropical areas. The difference is due to transport as well as the dynamic interactions among particles and precursors.
The accuracy of CCN simulations is critical for robust FAIRF estimations. Figure 2 compares the simulated CCN0.4 concentration in the lower boundary layer ([CCN0.4]LBL) with observed values at 29 surface sites around the globe (locations are marked on figure 1(e) by the letters and numbers). It should be noted that the predicted [CCN0.4]LBL for the PI case (letters and numbers in red) cannot be directly compared to PD observations, but they are given in figure 2 to illustrate the effect of anthropogenic emissions. It is clear from figure 2 that the GEOS-Chem/APM simulations for the PD case reproduce the absolute values as well as the horizontal variations of observed CCN0.4, with an overall correlation coefficient of 0.93 and a normalized mean bias (NMB) of 1.1%. The good agreement indicates that the model might have captured the key chemical and physical processes controlling global CCN abundance and distributions. This gives us more confidence on the robustness of predicted CCN for the PI case. As we can see from figure 2 (also figure 1(e), noting one for LBL and the other for LT), anthropogenic emissions significantly increase [CCN0.4]LBL at the sites near the SO2 source regions, up to a factor of 10. The enhancement is relatively small over remote regions where natural sources contribute significantly to CCN abundance.
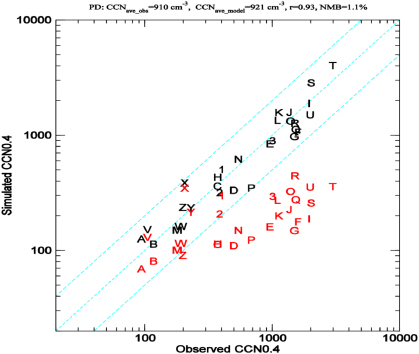
Figure 2. Comparison of simulated CCN0.4 concentration in the lower boundary layer ([CCN0.4]LBL) for the PD case (letters and numbers in black) with observed values at 29 surface sites marked on figure 1(e). The CCN0.4 data include (1) those compiled by Andreae [41], (2) additional data points from recent publications as well as archival observations as described in Yu et al [42], and (3) three new data points (sites 1–3) from Ward and Cotton [43], Irwin et al [44], and Laakso et al [45]. To illustrate the effect of anthropogenic emissions, corresponding [CCN0.4]LBL for the PI case are also given (letters and numbers in red). Model values correspond to the months when the observations were made.
Download figure:
Standard image High-resolution imageThrough the first aerosol indirect effects (1), the changes of CCN and CDN concentrations modify the cloud droplet effective radius, albedo, and radiative forcing. Figure 3 gives the horizontal distribution of FAIRF, calculated as the difference at the top of atmosphere SW cloud forcing between PD and PI cases. Anthropogenic aerosols have a negative first indirect effect in almost all the regions around the globe except in limited areas near the equator. The spatial distribution of FAIRF is similar to those of CCN and CDN changes (figures 1(e)–(f)), reaching above −2.5 W m−2 over the southeastern Pacific Ocean near Chile and Peru and some regions in eastern Asia, Europe, and northeastern America. The global mean FAIRF is −0.75 W m−2, which is close to the IPCC2007 median value (−0.7 W m−2) of about 20 modeling results.

Figure 3. Horizontal distribution of FAIRF, calculated as the difference in shortwave top of atmosphere cloud forcing between PD and PI cases.
Download figure:
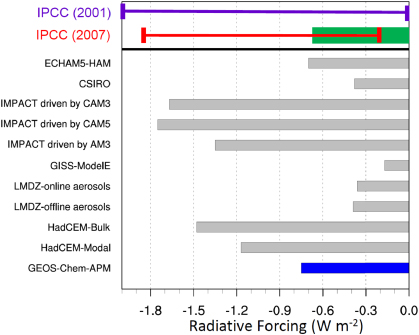
Standard image High-resolution imageFigure 4 compares FAIRF based on GEOS-Chem/APM with those from various studies published after IPCC2007 as well as the median values and ranges from the Third and Fourth IPCC Assessment Reports. Table 2 summarizes some key model information for those post-IPCC2007 FAIRF studies that we can find in the literature. Published studies of total aerosol indirect radiative forcing that do not give FAIRF values (e.g., [47]) and those studies focusing on indirect forcing of carbonaceous combustion aerosol only [48] are not included in table 2. For several post-IPCC2007 studies that presented multiple values [4, 5, 10], either baseline case values or averaged values are given. Different FAIRF values based on different approaches, such as different meteorology fields [10], online versus off-line aerosol [9], and bulk versus modal approaches [8], are treated as separate studies because these approaches are quite different and have been used in other FAIRF studies.
Figure 4. A comparison of FAIRF based on GEOS-Chem/APM with those from various studies published after IPCC2007 as well as the summarized values and ranges from Third [46] and Fourth [2] IPCC Assessment Reports.
Download figure:
Standard image High-resolution image
Table 2. Model studies of the FAIRF (in W m−2) published after the Fourth IPCC Assessment Report.
| Study | Model typeb | Chemistry | Aerosolsa | FAIRF | ||
|---|---|---|---|---|---|---|
| Size | Species | Approach | Value | |||
| Lohmann et al [3] | ECHAM5-HAM | Sulfur cycle, with off-line monthly mean oxidants | Double-moment modal | SO4, OC, BC, SS, D | Online | −0.7 |
| Rotstayn and Liu [4] | CSIRO | Sulfur cycle, with off-line monthly mean oxidants | Bulk | SO4, OC, BC, SS, D | Online | −0.38 |
| Wang and Penner [5]; Penner et al [6] | IMPACT driven by CAM3 met | Sulfur cycle, with off-line monthly mean oxidants | Modal (two modes for sulfate) | SO4, OC, BC, SS, D | Off-line | −1.65 and −1.69 |
| Zhou et al [10] | IMPACT driven by CAM5 met | Sulfur cycle, with off-line monthly mean oxidants | Modal (3 modes for sulfate) | SO4, OC, BC, SS, D | Off-line | −1.74 to −1.77 |
| IMPACT driven by GFDL AM3 met | −1.26 to −1.44 | |||||
| Bauer and Menon [7] | GISS-modelE | Sulfur cycle, with off-line oxidants and nitric acid concentrations | Modal (2 moment) | SO4, OC, BC, SS, D, NIT, NH4 | Online | −0.17 |
| Deandreis et al [9] | LMDZ coupled with INCA | Sulfur cycle (DMS, SO2, OH, NO3, H2O2,O3) scheme | Bulk | SO4 | Online | −0.36 |
| LMDZ with off-line aerosols | Off-line | −0.39 | ||||
| Bellouin et al [8] | HadGEM | Sulfur cycle, oxidants from an interactive chemistry model | Bulk Modal | SO4, NH4, OC, BC, SS, SOA | Online | −1.48 −1.17 |
| Yu et al (this study) | GEOS-Chem/APM (driven by GEOS-5 assimilated met) | Full online chemistry (SOx–NOx–Ox–hydrocarbon–SOA) | SP 40 bins, SS 20 bins, D 15 bins, BC and OC 2 modes | SO4, NH4, NIT, SOA, SS, D, BC, OC | Online | −0.75 |
aSO4: sulfate; SS: sea salt; D: mineral dust; BC: black carbon; OC: organic carbon; N: nitrate; NH4: ammonium; SOA: secondary organic aerosol; SP: secondary particles (containing SO4, NH4, NIT, and SOA). bAGCM: atmospheric general circulation model; CSIRO: Commonwealth Scientific and Industrial Research Organization; CAM: NCAR community atmosphere model; IMPACT: integrated massively parallel atmospheric chemical transport model; GFDL: Geophysical Fluid Dynamics Laboratory; GISS: NASA Goddard Institute for Space Studies; LMDZ: Laboratoire de Meteorologie Dynamique general circulation model; INCA: interaction with chemistry and aerosols; HadGEM: the Earth system model of the UKMet Office Hadley Centre.
As we can see from figure 4, large diversity of FAIRF values still exists among the post-IPCC2007 studies, ranging from ∼−1.76 to −0.17 W m−2. Unfortunately, the distribution is far from normal, with only two (out of eleven) studies giving FAIRF close to the median values of ∼−0.75 W m−2. Five studies show relatively large negative forcing (range: −1.76 to −1.17 W m−2; mean: −1.48 W m−2) while four other studies show much weaker forcing (range: −0.39 to −0.17 W m−2; mean: −0.33 W m−2). It should be noted that three of five studies with large negative forcing are based on the same global aerosol model, IMPACTS, while the other two are based on HadCEM. Many factors (including those listed in table 2) may contribute to the large FAIRF diversity due to the differences in the treatments of chemistry, aerosol microphysics, aerosol–cloud–radiation interactions, and meteorology in various studies.
4. Discussion
Compared to other global models used for IPCC2007 and post-IPC2007 FAIRF studies (see table 2, also table 2.7 in IPCC2007), GEOS-Chem/APM has a number of advanced features including: (1) online full (SOx–HOx–NOx–VOC–ozone) chemistry instead of simplified sulfur cycle chemistry using off-line monthly mean oxidants; (2) consideration of important aerosol components (nitrate, ammonium, and SOA) that are not included in most of previous studies; (3) highly accurate representation (40 bins with 30 bins in the size range of 1.2–120 nm) of secondary particles that are known to dominate particle number concentrations over most parts of the globe; (4) the usage of more accurate assimilated meteorology (GEOS-5) that helps to reduce uncertainties associated with meteorology; (5) online radiative transfer (RT) calculation to ensure that the spatial and temporal variations of aerosols are consistent with meteorology fields (compared to the studies using monthly mean aerosol fields for off-line RT calculation). These advanced features put GEOS-Chem/APM as one of the most sophisticated and rigorous global models currently available for studying FAIRF. Actually, this is the first time (to our knowledge) that a global size-resolved (sectional) aerosol model with comprehensive online chemistry and considering all major aerosol species (including nitrate, ammonium, and second organic aerosols) is used to calculate FAIRF.
FAIRF remains to be a major source of uncertainty in studying climate change. It is important to identify the possible reasons for the large diversity in FAIRF values derived from different studies/models and quantify the uncertainties associated with the treatments of various processes related to chemistry, aerosol microphysics, cloud activation and physics, radiation, and meteorology. One main source of the large diversity in post-IPCC2007 FAIRF studies is associated with the difference in the predicted PD/PI aerosol properties, especially CCN number concentrations that are critical for FAIRF. Large differences in the PD/PI CCN predictions are expected because of very different consideration of chemistry, aerosol sizes and species and microphysical processes in various models (table 2). The level of complexity of GEOS-Chem/APM in treating chemistry–aerosol processes compared to other models (table 2) and its ability in reproducing observed CCN concentrations around the globe (figure 2) is expected to substantially reduce the uncertainty in the predicted impacts of anthropogenic emissions on key aerosol properties and associated aerosol climate effect. For example, GEOS-Chem/APM simulations indicate that compared to the pre-industrial time, the concentrations of key precursor gases, nucleation rates, and particle number concentrations decreased in some pristine areas (figure 1). Such a decrease is likely as a result of the changes in atmospheric oxidation capacity and chemistry and condensation sink associated with anthropogenic emissions, highlighting the importance of coupling between full online chemistry and comprehensive aerosol microphysics.
Additional sources of the large diversity in FAIRF values include the representation of aerosol–cloud interactions (sub-grid updraft velocities, aerosol activation, etc) and the uncertainties in the cloud fields (3D distributions of cloud fraction and water content, etc). It should be pointed out that, unlike wind, temperature, and water vapor in the re-analysis product (i.e., assimilated meteorology), cloud properties are often not adequately constrained. The GEOS cloud water simulation has been evaluated by Li et al [49] and low cloud cover has been compared to ISCCP data [50]. There exist substantial differences between simulated and observed cloud properties but the cloud water values derived from different satellites [49] also differ significantly. The performance of GEOS in simulating cloud properties is comparable to many other widely use climate models [49]. It remains to be studied how the uncertainties in cloud simulations and aerosol–cloud interaction parameterizations may impact the calculated FAIRF.
Acknowledgments
This work is supported by NASA under grant NNX11AQ72G, and NSF under grant 0942106. The GEOS-Chem model is managed by the Atmospheric Chemistry Modeling Group at Harvard University with support from NASA's Atmospheric Chemistry Modeling and Analysis Program. The shortwave RRTMG module integrated with GEOS-Chem in this study is downloaded from the website of Atmospheric and Environmental Research (http://rtweb.aer.com/). The authors thank Andrea Molod for information about the GEOS cloud products.