
Abstract
Soil tillage and other methods of soil management may influence CO2 emissions because they accelerate the mineralization of organic carbon in the soil. This study aimed to quantify the CO2 emissions under conventional tillage (CT), minimum tillage (MT) and reduced tillage (RT) during the renovation of sugarcane fields in southern Brazil. The experiment was performed on an Oxisol in the sugarcane-planting area with mechanical harvesting. An undisturbed or no-till (NT) plot was left as a control treatment. The CO2 emissions results indicated a significant interaction (p < 0.001) between tillage method and time after tillage. By quantifying the accumulated emissions over the 44 days after soil tillage, we observed that tillage-induced emissions were higher after the CT system than the RT and MT systems, reaching 350.09 g m−2 of CO2 in CT, and 51.7 and 5.5 g m−2 of CO2 in RT and MT respectively. The amount of C lost in the form of CO2 due to soil tillage practices was significant and comparable to the estimated value of potential annual C accumulation resulting from changes in the harvesting system in Brazil from burning of plant residues to the adoption of green cane harvesting. The CO2 emissions in the CT system could respond to a loss of 80% of the potential soil C accumulated over one year as result of the adoption of mechanized sugarcane harvesting. Meanwhile, soil tillage during the renewal of the sugar plantation using RT and MT methods would result in low impact, with losses of 12% and 2% of the C that could potentially be accumulated during a one year period.
Export citation and abstract BibTeX RIS

Content from this work may be used under the terms of the Creative Commons Attribution-NonCommercial-ShareAlike 3.0 licence. Any further distribution of this work must maintain attribution to the author(s) and the title of the work, journal citation and DOI.
1. Introduction
The atmospheric concentration of greenhouse gases (GHGs) has been increased considerably in recent years as a result of human activities. Carbon dioxide (CO2) is the most important anthropogenic GHG; its annual emissions increased by about 80% between 1970 and 2004. Activities such as the burning of fossil fuels, the burning of forests and the loss of soil organic matter (Houghton et al 1992) have been recognized as the main causes of that increase.
The replacement of fossil fuels by fuels produced from biomass is an alternative approach that could reduce GHG emissions. Life-cycle analyses have found that the substitution of ethanol produced from corn for gasoline effectively reduces emissions. However, the reduction in emissions may be even greater when sugarcane is used to produce ethanol from grazing land (Searchinger et al 2008). Brazil is the largest producer of sugarcane in the world and is consequently the primary exporter of ethanol. However, regional estimates indicate that Brazilian agriculture and land use changes are responsible for 75% of CO2 emissions, 91% of CH4 emissions and 94% of N2O emissions (Cerri and Cerri 2007). These data create a need to develop agricultural practices that will decrease the environmental impact of sugarcane cultivation, ensure the sustainability of ethanol production and minimize the environmental impact.
Among mitigation processes, soil is an important natural reservoir of carbon (C). The emission of CO2 from the soil is the second largest component of the global carbon cycle and is important in climatic variation (Reth et al 2005). Cultivation of the soil by tillage increases the mineralization of soil organic carbon (SOC) and the emission of CO2 (Reicosky 1999). The decomposition of soil organic matter is increased by the physical disturbance caused by soil tillage, breaking down macroaggregates and exposing the carbon protected in their interiors to microbial processes (Cambardella and Elliott 1992). The amount of C lost in the form of CO2 due to soil tillage practices is strongly correlated with the intensity of the disruption and the volume of soil disturbed by the implements used (Dao 1998, Rastogi et al 2002, La Scala et al 2006, Teixeira 2007, Reicosky and Archer 2007). Thus, depending on the soil type and management system, soils may be important sources or sinks of atmospheric carbon (Lal et al 1995, Bernoux et al 2005).
Thus, it is necessary to understand the role of the soil in the production of sugarcane. Soil used in sugarcane production may be either a mitigator or a contributor to global warming. Therefore, we seek to identify and quantify the impact of agricultural practices on GHG emissions and to measure the carbon footprint of ethanol derived from sugarcane production as a source of energy.
In Brazil, the area planted with sugarcane is currently about 8.4 million hectares (Conab 2011), of which approximately 50% is harvested mechanically, resulting in straw deposition on the soil surface (Galdos et al 2009, Razafimbelo et al 2006, Blair et al 1998), activity that should increase soil C stocks over time. In this sense, this study aimed to quantify the CO2 emissions resulting from three systems of soil tillage used during the renovation of sugarcane plantations in the southeast region of Brazil. Significant soil CO2 efflux due to tillage has been demonstrated in short and intermediate-term experiments (Reicosky and Lindstrom 1993, Reicosky et al 1997, Rochette and Angers 1999, Alvarez et al 2001, La Scala et al 2001, La Scala et al 2006); however, there is little information about the impact of that agricultural practice on the tropical soils that are mainly used for sugarcane production. Most of these studies quantified CO2 fluxes resulting from one tillage operation, whereas during the renovation of sugarcane fields several tillage operations are conducted, which can result in a greater impact than reported in previous work. This research was a qualitative evaluation of different types of soil tillage systems widely used this agricultural system.
2. Materials and methods
2.1. Study area
The study was carried out in the region of Piracicaba, in northeastern São Paulo State, Brazil (22° 33' S; 47° 30' W), in an area under sugarcane variety SP91-1049, which had been mechanically harvested (without burning) for the past six years, resulting in deposition of 14 Mg ha−1 of dry matter from straw on the soil surface.
The soil is a Typic Hapludox (Soil Survey Staff 1999), with a pH of 5.5 and SOC stocks of 94.6 Mg ha−1 (0–30 cm). The average particle sizes in the surface layer (0–30 cm) were 37% clay, 22% silt and 41% sand.
The climate of the region is classified according to the Koppen Climate Classification (1936) as Aw: tropical with a wet summer and a dry winter. The mean annual temperature and precipitation were 21.45 °C and 1271 mm, respectively.
2.2. Evaluated systems of soil tillage
We established four experimental plots with dimensions of 12 m × 35 m. Each plot had the same soil type and was located at the same topography. The treatments were as follows. (i) Conventional tillage (CT), which consisted of two heavy offset disk harrowing operations and a subsoiling operation. The first heavy offset disk harrowing was performed using a tool with 18 disks × 28'' working at a speed of 6.5 km h−1 perturbing the first 15–20 cm depth. The second heavy harrowing was conducted seven days after the first and used a tool with 24 disks × 29'' working at 5.2 km h−1 (20–25 cm depth). Twelve days after that operation row subsoiling was carried out, which employed a subsoiler with five shanks reaching nearly 45 cm depth. (ii) Minimum tillage (MT), in which two applications of herbicide were performed to chemically eliminate sugarcane ratoon (new shoots of sugarcane growing after harvest) followed by a subsoiling operation in the row planting. The second herbicide application was executed sixteen days after the first application; meanwhile, the subsoiling was performed 28 days after the same operation, once the plants' death had been verified. The tool used for that subsoiling was a subsoiler with seven shanks, with a difference of 50 cm between shanks, reaching a depth of 40 cm. (iii) Reduced tillage (RT), which involved two phases of mechanical elimination of the ratoon and two subsoiling operations. The mechanical eliminator of the ratoon was an implement working in two rows of planting simultaneously; composed of two plows which pull out the plants, lifting them to expose them to a set of mounted knives in a rotative spiral system that destroy the vegetal material and leave them on the soil surface. Seven days after the first mechanical elimination operation, the second elimination was performed through every other two planting rows. The time between these two operations was established to guarantee the death of a pest (Sphenophorus levis) that stays in the remaining root system of the old ratoon. The mechanical eliminator worked at a speed of 3.0 km h−1, perturbing the soil to 20 cm depth. To complete the tillage operation system row subsoiling was executed 12 days after the last ratoon elimination; for that a subsoiler with five shanks working at 3.9 km h−1, reaching between 20 and 30 cm of depth, was used. Finally, nine days after the last operation a cross-subsoiling was carried out at an angle of 45° using an implement with seven shanks reaching nearly 50 cm of depth and working at 4.4 km h−1. (iv) No-tillage (NT), where the soil and sugarcane trash were left from the last harvesting procedure, which was performed about two weeks before starting the experiment.
The first operations in all treatments were performed simultaneously on the same day (7 October 2009). Figure 1 illustrates the tillage events over time for each treatment.
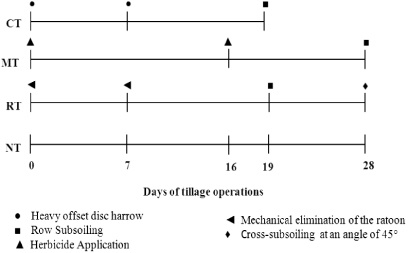
Figure 1. The timeline of tillage events for each treatment: CT—conventional tillage; MT—minimum tillage; RT—reduced tillage and NT—no-tillage.
Download figure:
Standard image2.3. Measurement of soil CO2 emissions, temperature and moisture
After the tillage procedures were finished, eight PVC soil collars (10 cm in diameter) were inserted into the soil in each experimental plot at a depth of 3 cm. The CO2 flux measurements were initiated 24 h after this procedure and were repeated over a period of 44 days, once a day, in the early morning, by the end of which the CO2 emissions in the plots with the experimental soil tillage systems reached values equivalent to those observed in the control treatment (p < 0.05).
The emission of CO2 was monitored using a portable LI-COR system (model LI-8100; Lincoln, NE, USA), which monitors the changes in CO2 concentration inside the chamber using an infrared gas analyzer (IRGA) (La Scala et al 2001, Panosso et al 2009).
Soil temperature was monitored by using a dial probe soil thermometer, which was inserted vertically to 12 cm from the soil surface close to the collars. Soil moisture was registered with a portable hydrosense system (TDR Probe, Campbell, USA) that estimated the percentage of moisture in the soil volume.
2.4. Statistical analyses
The CO2 flux was expressed on a mass basis (g m−2 h−1) and illustrated based on the time after soil tillage. This research was a qualitative evaluation of different types of soil tillage systems used in a sugarcane crop. In this way the approach was based on pseudo-replicates (8) for each treatment. A repeated-measure experimental design was used, meaning that the replicated data comprised measurements on the same experimental unit (Kepner and Robinson 1988). To compare treatments, we performed an F-test of analysis of variance using a GLM model and then compared the average values of the variables among treatments using Tukey's test at a significance level of p < 0.05.
The multiple correlation among moisture, temperature and CO2 fluxes from each tillage system was evaluated through the Gauss–Newton method. All statistical analyses were performed using the Statistical Analysis Systems program (SAS Institute 1987).
The emissions accumulated over the study period were calculated by integration of the area under the emissions curve using the Origin 7 program (Origin Lab Corporation 2002).
3. Results and discussion
3.1. Soil temperature and moisture
The soil temperature trends over the study period are presented in figure 2. Significant differences among the plots (p < 0.05) were observed on days 7, 19, 27, 29, 30 and 31 and on the last four days of the study. Some of these days coincided with tillage events or with precipitation in the area. The average soil temperature over the entire study period was significantly different among the different soil tillage systems. In the CT system, the average temperature was 23.6 °C, with maximum and minimum values of 28.6 and 19.8 °C. In RT and MT the average soil temperatures were 22.9 and 22.7 °C respectively, ranging between 26.7 and 19.4 °C in RT and 26.9 and 20.0 °C in MT. In the NT system the average soil temperature was 23.2 (ranging from 27.8 to 20.4 °C). Soil disturbance due to tillage operations may modify the relationship between the volume of air and the volume of soil particles inducing changes in the soil thermal conductivity and affecting the soil temperature. Soil tillage exhibits lower conductivity compared to soil non-tillage (Hillel 1998).
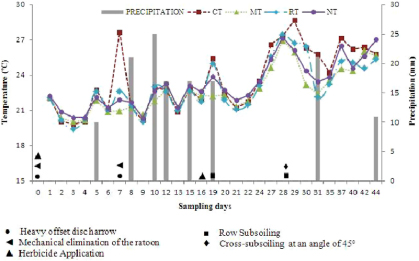
Figure 2. Soil temperature and precipitation under different systems of tillage during the study period. CT—conventional tillage; MT—minimum tillage; RT—reduced tillage and NT—no-tillage treatment.
Download figure:
Standard imageSoil moisture was more differentiated than temperature among the tillage systems, with wider variations over the study period (figure 3). Differences in soil moisture were observed during 79% of the study period. The MT and NT treatments generally exhibited greater soil moisture compared to RT and CT.

Figure 3. Volumetric soil moisture under different systems of soil tillage and precipitation during the study period. CT—conventional tillage; MT—minimum tillage; RT—reduced tillage and NT—no-tillage treatment.
Download figure:
Standard imageThe average soil moisture was highest (p < 0.05) in the NT (37.0%) and MT systems (31.3%), followed by the RT (24.3%) and CT (20.8%) systems. This pattern indicates that tillage systems that involve less physical disturbance help to maintain or conserve soil moisture. The tillage activity exposed more soil surface area to the atmosphere, providing a greater evaporative area and, consequently, a greater water loss. This effect depends on the depth, degree and frequency of soil tillage activities, the subsequent climatic conditions and the restructuring of the prepared layer (Salton and Mielniczuk 1995).
According to Smith et al (2003) soil temperature and moisture generate a direct effect on CO2 emissions. Based on these findings, we determined the Pearson correlation coefficients (r) between the CO2 flux from each plot and the soil temperature and soil moisture.
Our results indicate that these variables only had an influence on CO2 flux in the CT (r2 = 0.44). Multiple linear regression between emissions (FCO2), volumetric moisture and soil temperature in the CT was established according to the following relationship:

Equation (1) suggests that increases in soil moisture and temperature would favor increase in the CO2 emission process in the CT treatment. Several studies have indicated soil moisture as a controlling factor in CO2 emissions and that the sensitivity of CO2 flux to soil moisture is greater under the conventional system of tillage compared to no-till and minimum tillage treatments (Jabro et al 2008, La Scala et al 2006, Ussiri and Lal 2009). As the percolation of water is facilitated by soil tillage, the microbial activity is stimulated, which resulting in increases on CO2 emissions (Jabro et al 2008, La Scala et al 2006).
During the time period assessed, the soil temperature exhibited only minor variations and remained close to the optimal temperature for microbial activity. The same trend has been reported in previous tests conducted in soil under sugarcane (Panosso et al 2009, La Scala et al 2006).
3.2. Evolution of CO2 emissions
The average CO2 emissions from the soil were higher in the CT plot than in the RT, MT and NT plots, with values of 0.82, 0.56, 0.51 and 0.49 g m−2 h−1, respectively (table 1). The analysis of variance indicated a highly significant interaction (p < 0.001) between the tillage method and the time after tillage, showing that time must be considered when evaluating the effect of soil tillage on emissions. Similar average emissions (but lower than those found in this study) were observed by La Scala et al (2001).
Table 1. Mean ± standard error, maximum, minimum and total CO2 emissions during the study period for conventional tillage (CT), reduced tillage (RT), minimum tillage (MT) and no-tillage (NT) treatments. (Note: means followed by the same capital letter within a row are not significantly different according to Tukey's test at the 5% level. N = 232.)
| Soil tillage system | CO2 emissions | |||
|---|---|---|---|---|
| Mean | Maximum | Minimum | Total | |
| g m−2 h−1 | g m2 | |||
| CT | 0.82 A ± 0.37 | 1.89 | 0.17 | 881.6 |
| RT | 0.56 B ± 0.22 | 1.37 | 0.22 | 583.2 |
| MT | 0.51 B ± 0.17 | 0.95 | 0.22 | 537.0 |
| NT | 0.49 B ± 0.19 | 0.87 | 0.17 | 531.5 |
One day after performing the first tillage operations, we found no significant differences between treatments (p < 0.05) in soil CO2 emissions. Alvarez et al (2001), in an Argentine study, reported similar trends to ours, where the CO2 emissions one day after tillage operations were not significantly different from the previous day. Several studies have indicated that the effect of soil tillage on CO2 emissions is immediate, with CO2 flux decreasing considerably just a few hours after tillage operations (Omonode et al 2007, Al-Kaisi and Yin 2005, Reicosky et al 1997, Alvaro-Fuentes et al 2007).
The changes in CO2 flux due to soil tillage over the study period may be better observed in figure 4. Emissions increased during the days when tillage operations occurred and after precipitation events. Significant differences (p < 0.05) in CO2 flux between tillage systems were dependent on the day observed. CO2 emissions were only found to be different between the treatments on the study days 7, 12, 13, 15, 19 and 20 (table 2).
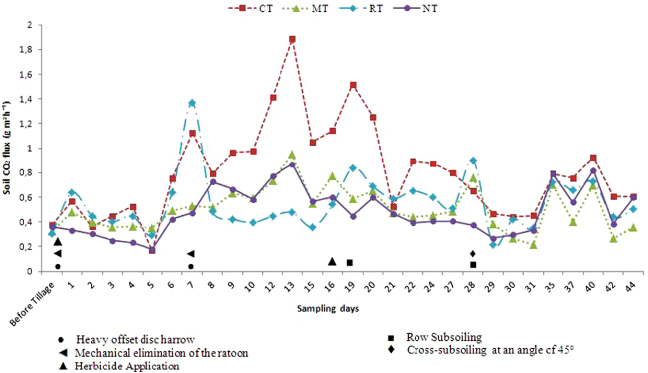
Figure 4. CO2 emissions after soil tillage using CT—conventional tillage; MT—minimum tillage; RT—reduced tillage and NT—no-tillage treatment.
Download figure:
Standard imageTable 2. Mean values of CO2 emissions at the measured time points for each of the soil tillage systems evaluated over the studied period. (Note: means followed by the same capital letter within a row are not significantly different according to Tukey's test at the 5% level.)
| CO2 emissions (g m−2 h−1) | ||||
|---|---|---|---|---|
| Day of evaluation | Conventional tillage | Minimum tillage | Reduced tillage | No-till treatment |
| 1 | 0.57 (0.45) A | 0.48 (0.19) A | 0.64 (0.17) A | 0.33 (0.11) A |
| 2 | 0.36 (0.24) A | 0.40 (0.14) A | 0.45 (0.21) A | 0.30 (0.12) A |
| 3 | 0.45 (0.29) A | 0.36 (0.11) A | 0.40 (0.15) A | 0.25 (0.11) A |
| 4 | 0.53 (0.22) A | 0.36 (0.12) A | 0.44 (0.12) A | 0.23 (0.05) A |
| 5 | 0.17 (0.11) A | 0.35 (0.17) A | 0.29 (0.38) A | 0.18 (0.07) A |
| 6 | 0.75 (0.27) A | 0.49 (0.21) A | 0.64 (0.15) A | 0.42 (0.11) A |
| 7 | 1.13 (0.24) AB | 0.53 (0.99) BC | 1.37 (0.20) A | 0.47 (0.11) C |
| 8 | 0.79 (0.16) A | 0.51 (0.26) A | 0.48 (0.22) A | 0.73 (0.12) A |
| 9 | 0.97 (0.44) A | 0.63 (0.01) A | 0.42 (0.20) A | 0.66 (0.12) A |
| 10 | 0.98 (0.26) A | 0.59 (0.13) A | 0.40 (0.26) A | 0.58 (0.20) A |
| 12 | 1.41 (0.54) A | 0.73 (0.14) B | 0.45 (0.16) B | 0.77 (0.22) B |
| 13 | 1.89 (0.96) A | 0.95 (0.22) B | 0.48 (0.28) B | 0.87 (0.12) B |
| 15 | 1.05 (0.84) A | 0.55 (0.20) AB | 0.36 (0.17) B | 0.57 (0.08) AB |
| 16 | 1.14 (0.28) A | 0.77 (0.19) A | 0.54 (0.25) A | 0.60 (0.17) A |
| 19 | 1.52 (0.60) A | 0.58 (0.32) B | 0.84 (0.17) B | 0.45 (0.13) B |
| 20 | 1.25 (0.84) A | 0.65 (0.26) AB | 0.69 (0.20) AB | 0.60 (0.08) B |
| 21 | 0.52 (0.16) A | 0.47 (0.11) A | 0.59 (0.21) A | 0.47 (0.13) A |
| 22 | 0.90 (0.45) A | 0.44 (0.31) A | 0.65 (0.15) A | 0.39 (0.13) A |
| 24 | 0.88 (0.30) A | 0.45 (0.24) A | 0.60 (0.16) A | 0.41 (0.13) A |
| 27 | 0.80 (0.12) A | 0.48 (0.20) A | 0.51 (0.13) A | 0.41 (0.15) A |
| 28 | 0.65 (0.16) A | 0.76 (0.47) A | 0.90 (0.14) A | 0.37 (0.17) A |
| 29 | 0.47 (0.13) A | 0.38 (0.08) A | 0.22 (0.23) A | 0.27 (0.12) A |
| 30 | 0.44 (0.11) A | 0.27 (0.11) A | 0.42 (0.09) A | 0.30 (0.13) A |
| 31 | 0.45 (0.28) A | 0.21 (0.13) A | 0.35 (0.10) A | 0.33 (0.08) A |
| 35 | 0.79 (0.19) A | 0.70 (0.17) A | 0.72 (0.37) A | 0.79 (0.23) A |
| 37 | 0.76 (0.14) A | 0.40 (0.05) A | 0.66 (0.15) A | 0.56 (0.13) A |
| 40 | 0.93 (0.12) A | 0.69 (0.13) A | 0.73 (0.22) A | 0.82 (0.14) A |
| 42 | 0.61 (0.26) A | 0.26 (0.19) A | 0.44 (0.10) A | 0.38 (0.10) A |
| 44 | 0.60 (0.16) A | 0.35 (0.08) A | 0.50 (0.16) A | 0.60 (0.17) A |
| Means | 0.82 (0.37) A | 0.51 (0.22) B | 0.56 (0.17) B | 0.49 (0.19) B |
On day 7 the CO2 flux immediately after tillage in the RT system differed significantly from that observed on the previous day (p < 0.05). The emissions observed in the CT system did not differ from the average emission of the RT plot (table 2). The mechanical eliminator of the ratoon disturbed the soil at a shallower depth compared to harrowing; however, it caused a greater breakdown of the soil structure into smaller aggregates, exposing labile organic matter more quickly and releasing the CO2 accumulated in the soil pores. Immediate increase in CO2 emissions after soil tillage may be due to a rapid increase in microbial activity for decomposition of labile organic matter caused by the increased soil aeration, as was exposed by Al-Kaisi and Yin (2005), or may instead be due to the phenomenon described by Rochette and Angers (1999) as 'degassing', which involves the physical expulsion of CO2 from the soil at the time of tillage.
Teixeira et al (2011) assessed the CO2 emissions due to the incorporation of sugarcane crop residues and the aggregate breaking after rotary tillage, and reported high emissions immediately after tillage operations with exponential decay over time. The behavior of exponential decay in the emission over time after tillage has been reported for other research performed in Brazil (La Scala et al 2009, 2008).
The highest CO2 emissions from the soil in the CT system were observed 12 and 13 days after the first tillage operation (figure 4). Increases in soil moisture during this period due to precipitation events can be associated with the highest soil CO2 emissions in this treatment. In studies performed on the Korean peninsula, the flow of CO2 significantly increased around ten hours after precipitation and then strongly decreased until it had returned to the level observed before precipitation after four days (Kim et al 2010). The same trend was observed by La Scala et al (2005) in sugarcane fields in Brazil, with increases in the CO2 flow during precipitation periods.
On the other hand, the in-row subsoiling operations on the CT and RT plots during day 19 of the study were the apparent source of the differences (p < 0.05) observed in the CO2 emissions from the soil on that day and on day 20 (table 2). The interaction between the incorporation of organic residues and the greater soil aeration may have positively affected oxidation, influencing CO2 flow. A detailed observation of the soil structure after tillage activities allows us to estimate that the subsoiling operation performed in the CT affected a greater depth (approximately 45 cm), which is more important than the incorporation of residues in the magnitude of immediate CO2 emissions (Reicosky and Lindstrom 1993). In an experiment conducted in São Paulo to evaluate the influence of the depth of the scarifier on CO2 emissions, Teixeira (2007) found that the greater the working depth of this implement, the higher the emissions.
Although there were few significant differences in CO2 flux between tillage systems on certain days, the tendency observed over the study period was for higher emissions in the CT system compared to the other tillage systems (figure 4). The heavy harrowing combined with subsoiling in the CT system in areas with straw generated a greater impact on CO2 losses to the atmosphere during the study period.
3.3. Cumulated emissions
On quantifying the total emissions during the study period we found that they were 34%, 39% and 40% higher (p < 0.05) in the CT than the RT, MT and NT plots respectively (table 1). The cumulative emissions in the RT, MT and NT did not differ significantly from each other. When comparing the accumulated emission in the CT plot with the NT plot, we observed that 350.09 g m−2 of CO2 was released to the atmosphere due to soil tillage and straw decomposition, amount equivalent to 954.79 kg ha−1 of C-CO2.
Meanwhile, the impact of the RT and MT systems was smaller; the increases in emissions in these treatments when compared to NT were 51.7 and 5.5 g m−2, respectively, suggesting losses of 141 and 15.2 kg ha−1 of C-CO2.
The adoption of mechanical harvesting systems in sugarcane affect the dynamics of SOC, resulting in an annual increase of 1.2 Mg ha−1 in C stocks in the 0–20 cm layer of the soil (Galdos et al 2009). Thus, soil tillage under conventional practices (CT) for sugarcane reformation would generate a loss equivalent to 80% of the C that could potentially be accumulated in this soil layer during one year of mechanical harvesting over a period of only 44 days.
The RT and MT systems have a smaller effect on CO2 emissions; these would generate losses of 12% and 2% of the accumulated C in one year, respectively.
Several studies have suggested that tillage systems involving plowing and harrowing generate a greater impact on CO2 emissions than systems using scarification and/or subsoiling as the sole method of soil tillage (Reicosky et al 1997, Dao 1998, Rochette and Angers 1999, Alvarez et al 2001, Al-Kaisi and Yin 2005, La Scala et al 2006, Jabro et al 2008). The area planted with sugarcane in Brazil is currently 8.4 million hectares (Conab 2011). Today, approximately 50% of the total area is harvested mechanically, which should increase soil C stocks over time.
However, it is estimated that about 60% of the sugarcane plantation area is under Oxisols (the same type of soil as in this study) and that between 15% and 20% of the plantations are renewed annually (0.75 to 1 million hectares). Losses of SOC may be caused as a function of the tillage system adopted during such renovation. Thus, the use of the CT system will result in an annual loss of C-CO2 of about 0.72–0.96 Tg of C. However, with soil tillage using RT or MT methods, the loss of C-CO2 would be reduced to approximately 0.10–0.14 Tg or 0.01 Tg, respectively.
The current production of Brazilian ethanol is based primarily on sugarcane, and this biofuel has both an energy and a GHG balance that makes it one of the most sustainable biofuels currently produced at commercial scales (Galdos et al 2010, Macedo et al 2008). Additional efforts to reduce GHG emissions in sugarcane production are necessary to guarantee the environmental sustainability of the ethanol produced from this crop.
When comparing C loss from tillage practices with C loss caused by other agricultural activities such as mineral and organic fertilization, vinasse application and liming in sugarcane fields we verified that tillage is an important source of CO2 to the atmosphere. The intensity of soil tillage should be minimized to reduce CO2 emissions from the soil, aiming for a sustainable condition.
Figueiredo et al (2010) quantified the GHG emission sources related to the sugarcane production in the agricultural sector in Brazil and found that mineral and organic N fertilization cause a loss of 162.9 kg Ceq ha−1 year−1; meanwhile, liming accounts for 49.8 kg Ceq ha−1 year−1. Similar values were reported by Galdos et al (2010) who estimated C loss due to mineral N fertilization and liming of the order of 110.7 and 74.7 kg Ceq ha−1 year−1 respectively.
In addition to soil C loss due to tillage, the use of fossil fuel to perform that agricultural operation causes CO2 emissions. The selection of a tillage system involving fewer operations could reduce CO2 emissions as a consequence of fuel savings. Koga et al (2003) found that a change from conventional tillage to minimum tillage could reduce the total CO2 emissions by between 15% and 29% in northern Japan.
In this sense, despite soil tillage in the sugarcane crop being an activity performed every 5–6 years, the intensity of soil tillage should be minimized to reduce CO2 emissions from the soil. It is greatly beneficial to select sustainable management practices that allow for increased carbon accumulation, improve soil quality and minimize CO2 emissions from agricultural soils. These practices can help to reduce the carbon footprint of ethanol, increasing the environmental benefits of replacing fossil fuels with this biofuel.
4. Conclusions
Soil temperature was not a controlling factor in CO2 emissions among the tillage systems evaluated. Soil moisture, however, showed a positive correlation with the CO2 flux from the conventional tillage plot, suggesting that, in this tillage system, increased moisture favors the emission processes.
Soil tillage under conventional operations (CT) causes emissions of 350.09 g m−2 of CO2 to the atmosphere, a value that suggests the loss of 80% of the C that can potentially be stocked in the 0–20 cm soil layer as a result of adoption of harvesting of green cane. The impact of RT and MT on SOC loss was lower than that observed for CT, suggesting losses of 12% and 2% of the C stored in the 0–20 cm soil layer under those harvesting systems.
The adoption of a soil tillage system in sugarcane crop involving the RT and MT methods could contribute a decrease of the rate of GHG emissions from the agricultural sector in Brazil, enhancing the sustainability of Brazilian ethanol.