

Abstract
We assessed the effects of nutrient enrichment on three stream ecosystems running through distinct biomes (Mediterranean, Pampean and Andean). We increased the concentrations of N and P in the stream water 1.6–4-fold following a before–after control–impact paired series (BACIPS) design in each stream, and evaluated changes in the biomass of bacteria, primary producers, invertebrates and fish in the enriched (E) versus control (C) reaches after nutrient addition through a predictive-BACIPS approach. The treatment produced variable biomass responses (2–77% of explained variance) among biological communities and streams. The greatest biomass response was observed for algae in the Andean stream (77% of the variance), although fish also showed important biomass responses (about 9–48%). The strongest biomass response to enrichment (77% in all biological compartments) was found in the Andean stream. The magnitude and seasonality of biomass responses to enrichment were highly site specific, often depending on the basal nutrient concentration and on windows of ecological opportunity (periods when environmental constraints other than nutrients do not limit biomass growth). The Pampean stream, with high basal nutrient concentrations, showed a weak response to enrichment (except for invertebrates), whereas the greater responses of Andean stream communities were presumably favored by wider windows of ecological opportunity in comparison to those from the Mediterranean stream. Despite variation among sites, enrichment globally stimulated the algal-based food webs (algae and invertebrate grazers) but not the detritus-based food webs (bacteria and invertebrate shredders). This study shows that nutrient enrichment tends to globally enhance the biomass of stream biological assemblages, but that its magnitude and extent within the food web are complex and are strongly determined by environmental factors and ecosystem structure.
Export citation and abstract BibTeX RIS

Content from this work may be used under the terms of the Creative Commons Attribution-NonCommercial-ShareAlike 3.0 licence. Any further distribution of this work must maintain attribution to the author(s) and the title of the work, journal citation and DOI.
1. Introduction
Nutrient enrichment threatens aquatic ecosystems globally (UNEP 2007), causing harmful algal blooms, altering biological communities, and affecting the functioning of freshwater and coastal marine ecosystems (Smith 2003, Sutton et al 2011). The effects of enrichment are particularly strong in streams and estuaries, where both biodiversity and efficiency of ecosystem processes are severely impaired (Sobczak et al 2005, Vörösmarty et al 2010). Eutrophication directly affects primary producers (algae, macrophytes) and microbial heterotrophs (bacteria, fungi), as they can use dissolved nutrients (Stelzer et al 2003), but the effects can then spread bottom-up to other trophic levels (Hart and Robinson 1990). Nutrients can stimulate decomposition (Pascoal et al 2005), as well as primary production (Mulholland et al 2001), two key processes with implications on the stream food webs (Tank et al 2010). However, mixed bottom-up and top-down regulations are common in streams, the interaction between nutrient availability and grazing intensity regulating the biomass of primary producers and consumers (Holomuzki et al 2010). Furthermore, the response of different groups of organisms to modified trophic resources can be quite specific, and may also depend on partitioning and compartmentalization of food webs (Huxel et al 2002, Stouffer and Bascompte 2011).
The overall response of autotrophs and heterotrophs to nutrient enrichment can be higher when the background nutrient concentrations are low and other factors such as light availability, temperature and hydrological stability do not limit primary production (Hill et al 2009). The occurrence of favorable periods for primary production and invertebrate development largely depends on the phenology and climate characteristics of the site, which mark the 'windows of ecological opportunity' (Tockner et al 2010). For instance, the growth of autotrophs in Mediterranean forested streams is mainly limited to a narrow window of opportunity in late winter and early spring, a period before the canopy closes and that usually has minimal flood disturbance, whereas heterotrophs tend to peak in late summer–autumn (e.g. Artigas et al 2009). In contrast, many tropical streams are less seasonal and feature small variability in temperature and light availability throughout the year, while hydrological peaks tend to control algal biomass (Zapata and Donato 2008). Therefore, although nutrient enrichment is becoming increasingly widespread, the response of river ecosystems can be site specific, depending on local characteristics like climate or type of dominant organisms. Thus, it is important to gain an understanding of the factors governing the response of river ecosystems to nutrient enrichment under different climatic settings. This objective can be best attained by means of controlled experiments.
We analyzed the biological responses of stream ecosystems to experimental nutrient enrichment in three bioclimatic regions (Mediterranean, Pampean and Andean). The systems differed in environmental features (hydrology, temperature, light availability, biological communities), as well as in the extent of their respective nutrient limitation. Our main hypothesis was that the three systems would respond in specific ways to a similar nutrient enrichment. We hypothesized the increase in biomass to be proportional to basal nutrient limitation, and the duration of the response to be limited by the windows of opportunity.
2. Methods
2.1. Characteristics of the study sites
The experimental manipulations were conducted in three headwater streams located in the Mediterranean (Fuirosos, Spain), Pampean (La Choza, Argentina) and tropical Andean (Tota, Colombia) regions. All streams were of similar order but had specific climatic and ecoregional characteristics, differing in temperature patterns, background nutrient levels, light and discharge, as well as in the canopy cover.
Fuirosos is a Mediterranean forested stream located at an altitude of 150 m in the mountains of NE Spain. It drains a siliceous 16 km2 basin covered by pine (Pinus halepensis Mill.) and cork oak (Quercus suber L.) forests, with less than 5% covered by arable fields. The climate is Mediterranean, with hot, dry summers and wet winters. The average annual rainfall is 600–800 mm, and the average water temperatures range from 4 °C (January) to 20 °C (August). The experiments were performed in a third order section (41° 41'N, 2° 34'E) with a well developed deciduous riparian forest composed of hybrid plane (Platanus acerifolia (Aiton) Willd.) and black poplar (Populus nigra L.) which cast a strong shade from late spring (April) to autumn (November). The stream runs over boulders, cobbles and sand, but the seasonal input of leaf detritus in autumn can completely cover the stream bed (Artigas et al 2009). The main primary producers are microscopic algae growing on rocks and in sand, which tend to be most abundant in early spring, before canopy closure (Tornés and Sabater 2010).
La Choza is a Pampean stream located in the lowland prairies of the province of Buenos Aires. It drains a basin of 48 km2 on deep loess deposits, mainly covered by temperate grassland grazed by cattle, although a quarter of the land is devoted to agriculture. The climate is temperate continental, resulting in wet springs and autumns. The average annual rainfall is 600–1200 mm, and the average water temperatures range from 10 °C (June) to 24 °C (January). The experiments were conducted in a third order section (34° 42'S, 59° 04'O) that was naturally devoid of riparian trees. The streambed was composed of carbonate calcium precipitates and deposits of silt and clay that re-suspend during storm episodes (Rodrigues Capítulo et al 2010). Primary producers are diverse and include suspended cells, epipelic microalgae and macrophytes.
Tota is an Andean stream located at an altitude of 2560 m in the Eastern Mountains of Colombia, in Boyacá State. The stream drains a 140 km2 basin on shale and clay. Approximately 40% of the surface area of the basin is used for agriculture and pasture, the rest is covered by secondary forest and sparse vegetation. The climate is cool and dry with a bimodal precipitation pattern, temperatures showing little seasonal variation. The average annual rainfall is 730 mm, and average water temperatures range from 11 to 13 °C. Experiments were conducted in a third order section where the riparian vegetation is composed of open forest dominated by Alnus acuminata Kunth and Salix humboldtiana Willd, with a dense layer of Pennisetum clandestinum Hochst. ex Chiov. grass. The streambed is composed of rocks, cobbles and boulders and few deposits of sand and detritus. Though litter fall is relatively constant through the year, detritus accumulates during periods of low flow. Macrophytes are rare or absent, and epilithic and epipsammic algae are the main primary producers.
2.2. Experimental manipulations
The experiment followed a BACIPS (before–after, control–impact paired series) design: in each stream, we experimentally enhanced nutrient concentrations 2–4 fold over a 50 m reach (E, enriched), whereas an upstream reach of similar morphological and hydrological characteristics was kept as the control (C). All reaches (C and E) were studied for 9–15 months before the enrichment, E reaches were then enriched, and all reaches studied for one year. Nutrient amounts to add to E reaches were calculated bi-weekly considering the basal stream water nutrient concentrations (total ammonia, nitrate and phosphate) and discharge. Nutrient solutions were prepared with ammonium nitrate (NH4NO3) and ammonium phosphate (NH4H2PO4), stored in 100 l tanks beside the stream bank, and added continuously to the E reach. Given the low water velocity, bags of fertilizer (12% N and 12% P) were used to produce the necessary enrichment in the E reach of the Pampean stream. The enrichment started in January 2004 in the Mediterranean, January 2007 in the Pampean, and May 2008 in the Andean stream.
Ammonium, nitrate and phosphate concentrations were analyzed in each of the stream reaches before and after the enrichment. Water samples taken in triplicate were filtered through 0.7 μm GF/F filters (Whatman, England) and placed into 50 ml flasks for further analysis in the laboratory. Colorimetric methods were used for total ammonia (Solorzano 1969), phosphate (Murphy and Riley 1962) and nitrate (APHA 1989) determination.
2.3. Biological analyses
The sampling was adapted to study the main compartments present in each of the streams: fine sediment and rocks were sampled in the Mediterranean and Andean streams, fine sediment, the water column and macrophytes in the Pampean stream. All reaches were sampled monthly. On each occasion water temperature, conductivity, pH, oxygen, irradiance and discharge were measured with portable meters, and samples to analyze nutrient concentrations and benthic organic matter accumulation were collected.
2.3.1. Rocky habitat.
Bacterial and algal biomass in the epilithon was measured from 1 cm2 ceramic tiles glued onto rock slabs that were kept at a depth of 10–20 cm in riffle zones. The samples were allowed to colonize for at least two months before sampling. On each occasion, three tiles were taken for bacterial density estimates and preserved with 4% formaldehyde, and three more tiles were taken for chlorophyll-a concentration and kept frozen until analysis. Bacterial density was determined following Porter and Feig (1980) and chlorophyll-a concentration determined using the method of Jeffrey and Humphrey (1975). Transformation into microbial biomass (μg carbon per cm−2) was achieved by using conversion factors of Frost et al (2005) for chlorophyll-a and Bratbak and Dundas (1984) for bacterial densities.
The taxonomic composition of the diatom community was determined under the microscope. Diatom communities were detached by sonication from glass tiles, cleaned with sulfuric acid and hydrogen peroxide, and mounted onto permanent slides using Naphrax (refractive index of 1.74; Brunel Microscopes Ltd, England). About 400 frustules were counted per sample, and diatoms were identified to the lowest taxonomic level possible using standard references (Krammer and Lange-Bertalot 1986–1991) and recent nomenclature updates.
Invertebrates in the Andean stream were sampled directly on cobbles using a Surber sampler with a 900 cm2 surface area and a 500 μm mesh size. The samples (at least 5 replicates) collected were fixed with 4% formaldehyde and invertebrates were sorted under a dissecting microscope at 400 × . Identification of invertebrates reached the genera level and the species level when possible. Biomass was calculated as dry mass (70 °C for 48 h) per square meter. In the Mediterranean stream, the grazer Ancylus fluviatilis Müller was the most abundant invertebrate upon rocks. Therefore, Ancylus body mass was estimated as the average dry mass (70 °C 48 h) of 40–100 individuals (corresponding to 10–20 cobbles sampled) in C and E reaches during enrichment experiments. There was no rocky substratum in the Pampean stream.
2.3.2. Sediment habitat.
Epipsammic algae and bacteria were sampled with plastic cylinders (4.3 cm in diameter, 2–4 cm depth) used as corers. Three replicates were collected at random at C and E reaches, placed in plastic containers and subsampled using an untapped syringe (1.2 cm in diameter) and equivalent to 1 g of sediment. Samples were then either preserved with 4% formaldehyde for bacterial counting, or kept frozen to quantify chlorophyll-a. The protocols for bacterial density and chlorophyll-a determination were similar to those used for the rocks. Biomass results were expressed in μg carbon per cm−2 of sediment.
In the Mediterranean and Andean streams invertebrates in fine sediments were collected with plastic cores (5 cm in diameter, 7–8 cm depth). Three core replicates were collected per reach (C and E) and stream type. In the Pampean stream, an Ekman dredge sampler (100 cm2 surface area) was used to sample sediments (also triplicate samples). Samples were immediately filtered through 500 μm sieves and fixed with formaldehyde. Invertebrate identification and biomass determination procedures were similar to those used for the rock assemblages.
2.3.3. Water column.
In the Pampean stream suspended chlorophyll-a was analyzed from 1 l water samples (3 replicates per reach and occasion). Water was filtered through GF/F filters (0.7 μm, Whatman, England) and the filters were analyzed for chlorophyll as the extracts from rocks. Bacterial density was estimated in 10 ml water subsamples (3 replicates) following the methodology described in Porter and Feig (1980). Algal and bacterial biomass in the water column was estimated through the conversion factors described before and expressed by square meter of streambed.
2.3.4. Macrophytes.
Macrophytes were surveyed bimonthly during the cold season and monthly during the warm season at the Pampean stream. Macrophyte composition and cover were determined from regularly spaced transects. Macrophyte samples (3–10 replicates) were obtained at random in the C and E reaches with a 649 cm2 square metal frame and stored in 500 ml plastic bags. Plants were rinsed with tap water, sorted into species, and invertebrates removed. Plants were dried (70 °C to a constant dry weight) to obtain dry mass, which was expressed in g m−2. Invertebrates removed from macrophytes were filtered through 500 μm sieves, fixed with formaldehyde, identified and counted. Identification of invertebrates reached the genera level, and the species level when possible.
2.3.5. Fish.
Fish abundance and biomass in the Pampean and Andean streams were estimated bimonthly using multiple-pass sampling (at least four passes per occasion), after blocking the C and E reaches with nets. Fish density was too low in the Mediterranean stream (Mas-Martí et al 2010) to allow comparative sampling between reaches. Sampling was performed with electrofishing (EN ISO 14011:2003 standard). In the Pampean stream, sampling was also done with seines when high water conductivity precluded the use of electrofishing. All fish sampled were counted, identified, measured (standard length) and then returned to the water. Only a small subsample of about 20 individuals was used to determine fish condition (body weight and length, García-Berthou and Moreno-Amich 1993). Fish abundance and biomass were expressed as catch per unit of effort (CPUE = fish number/area sampled) and biomass per unit of effort (BPUE = fish biomass/area sampled), respectively.
2.4. Data analysis
The results of the three enrichment experiments were analyzed following the predictive-BACIPS approach (Bence et al 1996). This method compares the relationship between the values in the C and E reaches, before and after the start of the experiment. Although before–after control–impact paired series (BACIPS) designs are often analyzed with ANOVA, the use of statistical techniques with control sites as covariates as in the predictive-BACIPS has the advantage of allowing the effect size (i.e., the enrichment effects) to vary with the magnitude of the control value and with environmental conditions, i.e. does not require the standard assumption of additivity (Bence et al 1996, Stewart-Oaten and Bence 2001).
For the predictive-BACIPS approach, we used analysis of covariance (ANCOVA) of the values of the response variable (e.g. bacterial biomass) in the E reaches using values in C (control) as a covariate and the periods before/after the start of the treatment (BA) as a binary factor. ANCOVA was first used to test interactions between the covariate (i.e. C values) and the binary factor (BA). Significant interactions indicate that slopes between both variables (corresponding to C and E values) were not equal before and after the start of the treatment (García-Berthou and Moreno-Amich 1993). In that case, the treatment effect would depend on the magnitude of the control values. When the C × BA interaction was not significant (P > 0.10), it was removed from the model to improve the statistical power, and a standard ANCOVA design was used (i.e. homogeneous slopes were assumed; García-Berthou and Moreno-Amich 1993). The proportion of variance (often termed eta squared, η2) explained by the BA factor plus the C × BA interaction was computed as a measure of the effect size of enrichment. Bence et al (1996) recommend that emphasis in BACIPS designs is mainly placed on effect sizes rather than on P values. Average η2 values in the biological compartments (bacteria, algae, macrophytes, water column, invertebrates and fish) in each stream were calculated as an estimate of the magnitude of transferral of the nutrient enrichment through the food web. All data were analyzed with the R software (R Development Core Team 2012). Note that the default packages in R use sequential (i.e. type I) sum of squares (Hector et al 2010) and that the 'control' covariate was always tested first in the models. Quantitative variables (response variables and covariates) were log10-transformed before statistical analyses in order to improve assumptions of the linear models (normality, homoscedasticity, and linearity).
An important assumption of BACIPS designs and regression of time-related variables in general is the lack of serial correlation (Bence et al 1996, Stewart-Oaten and Bence 2001). We used the Breusch–Godfrey test to test whether serial correlation was present in our data, with serial correlation up to four order using the 'bgtest' function of package 'lmtest' (Zeileis and Hothorn 2002) in R. The Breusch–Godfrey test is more applicable and often more powerful than the more widely used Durbin–Watson test and other methods (Godfrey and Tremayne 2005). Only 1 of the 23 analyses (combinations of variables and streams) showed significant serial correlation (P < 0.05). Similarly, only one case of the 23 raw variables showed serial correlation (P < 0.05) in the enriched zones, probably because sampling frequency was low (about monthly) and equally spaced (Stewart-Oaten and Bence 2001). Since our time series were relatively short (sample size < 50) and serial correlation was almost always non-significant, we did not correct for autocorrelation, as recommended by Bence (1995).
The effect of enrichment on biomass of the different trophic levels was expressed as the per cent ratio of biomass change in the E reach with respect to the C reach. The ratio of biomass change was therefore calculated as 100 (enriched − control)/control. This ratio was also used to calculate enrichment effects on diatom and invertebrate abundances. The ratio's coefficient of variation (CV) during the enrichment was useful to determine the potential fluctuations in biomass response caused by the treatment. Windows of opportunity were defined as time periods when no factor beyond nutrients exerts significant limitation on primary production and consumers in the stream. These periods were identified in the Mediterranean, Pampean and Andean streams after analyzing the best combinations of water temperature, light and discharge.
3. Results
3.1. Physical and chemical characteristics of the study sites
The Mediterranean and Pampean streams had large seasonal variations in water temperature and light availability while, in contrast, the seasonal variation in the Andean stream was much lower (figure 1). Water flow also followed different patterns in the three systems. Variability was high in the Andean stream (from 68 to 1800 l s−1) and Mediterranean stream (from 0 to 1400 l s−1) and very low in the Pampean (from 0 to 40 l s−1). Low flow values included up to two months of summer drought in the Mediterranean stream, but water remained in the channel in the Pampean because of its very low slope.
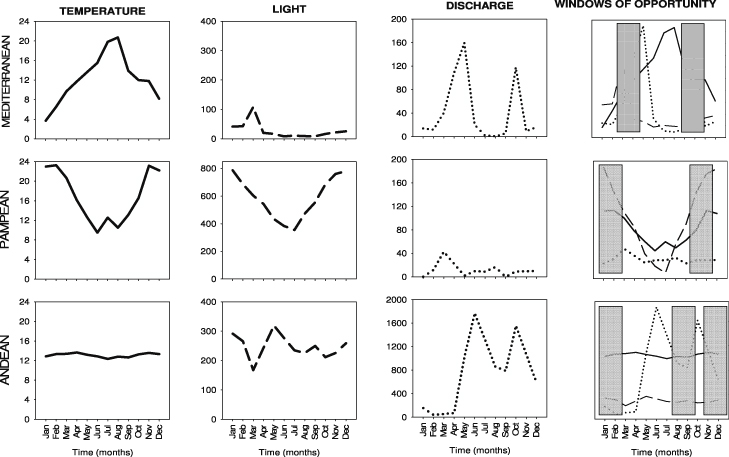
Figure 1. Environmental characteristics and organic matter availability in the Mediterranean, Pampean and Andean streams. Values of water temperature (°C), light (μmol photons m−2 s−1) and discharge (l s−1) during enrichment experiments are represented. Windows of ecological opportunity (marked in gray, right plot) were determined after considering favorable conditions for primary producers, microbial heterotrophs and consumer development.
Download figure:
Standard imageBasal nutrient concentrations before the enrichment (table 1) were the highest in the Pampean stream (140 μg l−1 SRP and 700 μg l−1 DIN), characterized by low phosphorus content in the Mediterranean stream (14 μg l−1 SRP, 430 μg l−1 DIN), and with low DIN concentrations in the Andean stream (26 μg l−1 SRP and 110 μg L−1 DIN). The enrichment caused SRP to increase ×2–4, and DIN to increase ×1.6–2.8 (table 1). The enrichment caused the decrease of the N:P ratios in the Mediterranean and Pampean streams, but did not greatly alter those of the Andean (table 1).
Table 1. Water nutrient concentrations of soluble reactive phosphorus (SRP) and dissolved inorganic nitrogen (DIN, sum of ammonia + nitrate + nitrite forms) in the C and E reaches of the Mediterranean, Pampean and Andean streams. Values are means and standard errors of nutrients measured during the pre-enrichment (before) and enrichment (after) periods, and are accompanied by N:P molar ratio calculations. The increment (Δ) nutrient concentration during enrichment is also shown for each of the streams.
| Control reach | Enriched reach | Δ nutrient concentration | |||
|---|---|---|---|---|---|
| Mediterranean | Before | SRP (μg l−1) | 14 ± 18 | 16 ± 21 | |
| DIN (μg l−1) | 432 ± 438 | 523 ± 491 | |||
| N:P | 68 | 71 | |||
| After | SRP (μg l−1) | 10 ± 9 | 30 ± 13 | ×3 | |
| DIN (μg l−1) | 389 ± 495 | 765 ± 736 | ×2 | ||
| N:P | 84 | 56 | |||
| Pampean | Before | SRP (μg l−1) | 143 ± 17 | 173 ± 31 | |
| DIN (μg l−1) | 683 ± 39 | 1093 ± 228 | |||
| N:P | 11 | 14 | |||
| After | SRP (μg l−1) | 93 ± 3 | 361 ± 29 | ×4 | |
| DIN (μg l−1) | 528 ± 136 | 828 ± 197 | ×1.6 | ||
| N:P | 13 | 5 | |||
| Andean | Before | SRP (μg l−1) | 26 ± 5 | 28 ± 5 | |
| DIN (μg l−1) | 55 ± 21 | 78 ± 23 | |||
| N:P | 5 | 6 | |||
| After | SRP (μg l−1) | 53 ± 4 | 105 ± 13 | ×2 | |
| DIN (μg l−1) | 114 ± 59 | 323 ± 85 | ×2.8 | ||
| N:P | 5 | 7 |
3.2. Windows of opportunity
Windows of ecological opportunity for primary producers, microbial heterotrophs and consumers differed between streams in terms of duration and frequency (figure 1). Windows of opportunity in the Mediterranean stream were narrow and limited to late spring–early summer (moderate temperature and light availability) and late summer–early autumn periods (moderate temperatures and abundant allochthonous OM inputs). The greatest overlap of favorable environmental conditions for biological development occurred in the Pampean stream. In this system higher light, elevated temperatures and low discharge values coincided from winter to summer (September–March). The absence of riparian vegetation reduced allochthonous OM inputs in this stream, but authocthonous OM was produced by algae and macrophytes. The Andean stream also had long favorable periods of temperature, light and allochthonous OM inputs, only interrupted by high discharge periods between April–May and October–November. The high flow periods in this stream caused a momentary biomass decrease of all biological groups. The predictive-BACIPS approach (table 2) suggested that 10 out of 23 models had significant treatments effects (or interactions) and that the explained variance was often high (figure 6).
Table 2. Predictive-BACIPS of the effects of nutrient enrichment on the biomass of biological compartments in the three streams. The values shown correspond to the estimated coefficients of the linear models (ANCOVAs). When the control × BA was not significant (P > 0.10) it was deleted from the model; see section 2 for further details. n.s., P > 0.10; a, P ≤ 0.10; *, P ≤ 0.05; **, P ≤ 0.01; ***, P ≤ 0.001.
| Variable | n | Control | BA | Control × BA |
|---|---|---|---|---|
| Mediterranean | ||||
| Bacteria rocks | 18 | 0.404* | 0.068 | n.s. |
| Bacteria fine sediment | 23 | 0.590* | 0.078 | n.s. |
| Algae rocks | 19 | 0.495* | 0.202a | n.s. |
| Algae fine sediment | 23 | 1.082*** | 0.315** | −0.732** |
| Invertebrates fine sediment | 7 | −1.011 | −0.072 | 1.660a |
| Pampean | ||||
| Bacteria fine sediment | 11 | 0.751*** | 0.510a | n.s. |
| Bacteria suspended | 11 | 0.954** | −0.018 | n.s. |
| Bact macrophytes | 8 | 0.396 | 0.097 | n.s. |
| Algae fine sediment | 10 | 1.106*** | 0.206* | n.s. |
| Algae suspended | 5 | 0.274 | −0.079 | n.s. |
| Algae macrophyte | 10 | 0.575 | −0.150 | n.s. |
| Macrophytes | 11 | 1.093*** | 0.249 | n.s. |
| Invertebrates fine sediment | 10 | −0.130 | 0.787 | n.s. |
| Invertebrates macrophytes | 6 | −0.251 | −0.521a | n.s. |
| Fish CPUE | 4 | 1.082* | 82.21 | n.s. |
| Fish BPUE | 4 | 0.745 | 295.52 | n.s. |
| Andean | ||||
| Bacteria rocks | 7 | 0.666a | 0.299 | n.s. |
| Bacteria fine sediment | 6 | 0.150 | −2.631a | n.s. |
| Algae rocks | 14 | 0.158 | −0.101 | 0.728* |
| Invertebrates rocks | 13 | 0.469 | −0.269 | n.s. |
| Invertebrates fine sediment | 13 | 0.432 | −0.388 | n.s. |
| Fish density | 10 | 1.012* | −0.442* | n.s. |
| Fish biomass | 10 | 1.020* | −0.464a | n.s. |
3.3. Bacterial biomass
Bacterial biomass before the enrichment ranged from 2 to 16 μg C cm−2 on rocks and fine sediment in the Mediterranean and Andean streams, from 5 to 700 μg C cm−2 on sediments, 0.04–1.5 μg C cm−2 on macrophytes, and 1–36 μg C cm−2 in the water column for the Pampean stream. The nutrient enrichment resulted in an increase in bacterial biomass in the Mediterranean (rocks and fine sediment) and Pampean (fine sediment) streams, but not in the Andean stream (figure 2, table 2). The largest increase in bacterial biomass after enrichment (calculated as the biomass change ratio) occurred in the Mediterranean stream (65–80% overall increase). In the Pampean stream, bacterial biomass increased between 20 and 30% in fine sediment and macrophytes, but decreased in the water column (10–20%). Water flow conditions, temperature and light availability covaried with bacterial biomass in the E reaches of the Mediterranean and Pampean streams. The temporal variability of the biomass change ratio was the highest in the Mediterranean stream (coefficient of variation, CV = 2.4), due to the episodic higher biomass between late spring and early summer in the enrichment period.
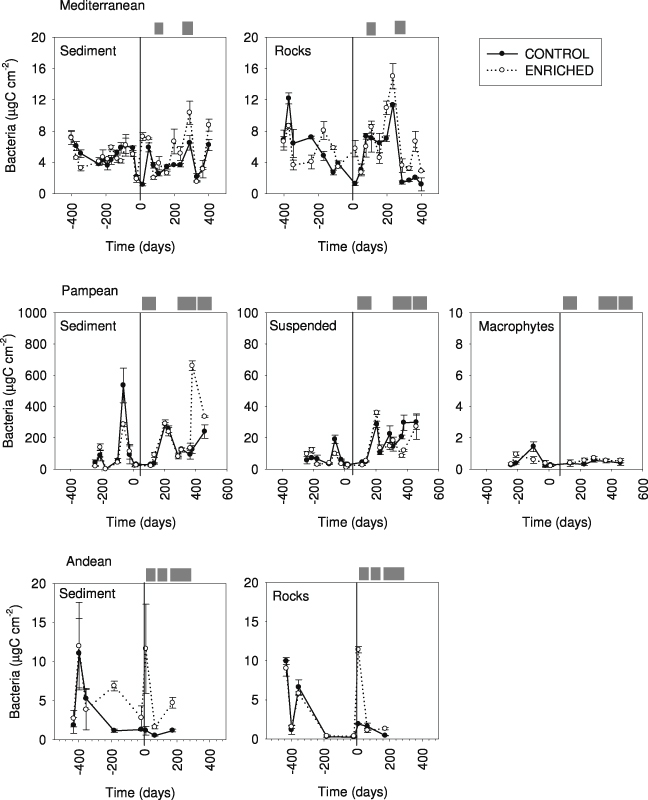
Figure 2. Bacterial biomass (in μg C cm−2) at the C and E reaches from Mediterranean, Pampean and Andean streams. Values are means (n = 3) and standard errors of different types of communities (from sediment, rocks, suspended and macrophytes) at the different sampling times. The vertical line indicates the beginning of the enrichment experiment.
Download figure:
Standard image3.4. Algal and macrophytic biomass and composition
Algal biomass before the enrichment averaged 205 ± 31 μg C cm−2 on rocks and 69 ± 11 μg C cm−2 on sediments at the Mediterranean stream (figure 3). Algal biomass accounted for 137 ± 18 μg C cm−2 on rocky habitat in the Andean stream, while reached 162 ±29 μg C cm−2 on fine sediment and 23 ± 3 μg C cm−2 for suspended algae in the Pampean stream. In this stream, macrophytes biomass accounted for 58 ± 27 g C m−2.
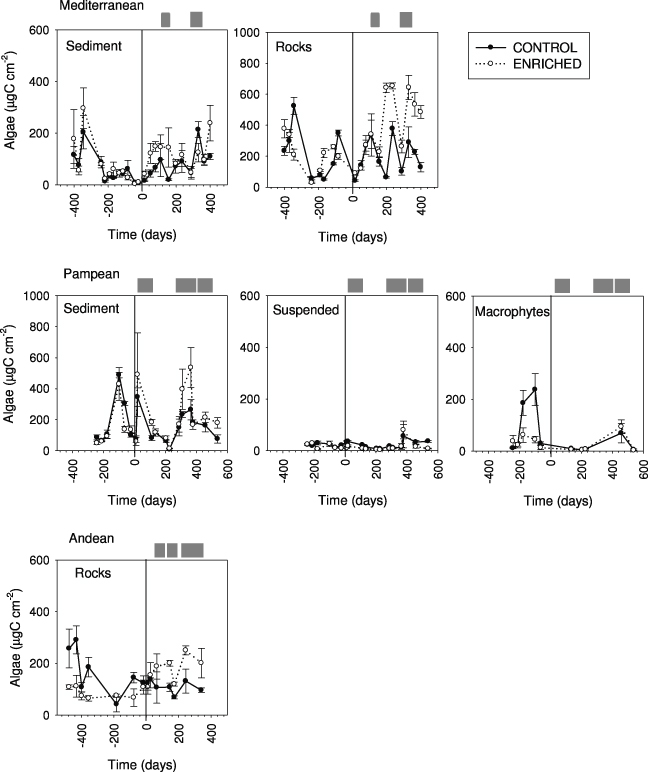
Figure 3. Algal biomass (in μg C cm−2) at the C and E reaches from Mediterranean, Pampean and Andean streams. Values are means (n = 3) and standard errors of different types of communities (from sediment, rocks, suspended and macrophytes) at the different sampling times. The vertical line indicates the beginning of the enrichment experiment.
Download figure:
Standard imageNutrient enrichment produced an increase in algal biomass in the three streams (figure 3, table 2), although the responses varied in magnitude and differed between compartments. The largest increase occurred on rocks in the Mediterranean stream (163% on average; peak of 273% during spring). In the Andean stream algal biomass on rocks rapidly increased (62%) and remained steady thereafter. The smallest biomass increase was registered in the Pampean stream, particularly in the water column and for macrophytes, but biomass increased up to 49% on fine sediments. The algal biomass responses to nutrients in the three streams were strongly related with favorable conditions of light, temperature and water flow (figure 3). The difference between the extension of the respective windows of opportunity determined the steadiness of the response. The Mediterranean and Andean streams represented the maximum and minimum variability in favorable conditions for primary producers' growth; accordingly, the coefficients of variation of the biomass ratio's change were the highest in the Mediterranean (CV = 1.6) and the lowest in the Andean (CV = 0.8) stream.
Nutrient enrichment affected the composition of benthic algal assemblages. Some diatom taxa decreased (e.g., Achnanthes biasolettiana Grunow (−57%), Achnanthes minutissima Kutzing (−43.2%) in the Mediterranean, Fragilaria ulna (Nitzsch.) Lange-Bertalot var. ulna (−68%) in the Pampean and Cocconeis placentula Ehrenberg (−40%) in the Andean stream), whereas others increased (e.g., Rhoicosphenia abbreviata (Ag.) Lange-Bertalot (94%) and Cocconeis placentula Ehrenberg (59.4%) in the Mediterranean, Nitzschia frustulum (Kutzing) Grunow var. frustulum (352.8%) in the Pampean and Reimeria sinuata (Gregory) Kociolek and Stoermer (64.6%) in the Andean stream). Enrichment in the Pampean stream had no effect on the macrophyte composition; Ludwigia sp. and Bacopa sp. dominated both the C and E reaches and were later replaced by the macroalga Spirogyra sp.
3.5. Invertebrate biomass and composition
Invertebrate biomass before the enrichment ranged from 5 to 750 μg DM cm−2 in the Mediterranean and Andean streams, and reached 1093 ± 311 μg DM cm−2 in the sediments of the Pampean stream. The effects of nutrient enrichment were generally non-significant but often larger (figure 4, table 2) and more pronounced in some habitats than others. In the Pampean stream, effects were not apparent on invertebrates occurring on macrophytes, and were minor (3%) on fine sediments. Invertebrate biomass increased up to 155% in the fine sediments of the Mediterranean stream while no increase was observed in the Andean stream. The effects on invertebrate biomass were the least variable in the Mediterranean stream (per cent increase ratio CV = 0.9; CV = 1.2 in the Andean, and 2.7 in the Pampean).
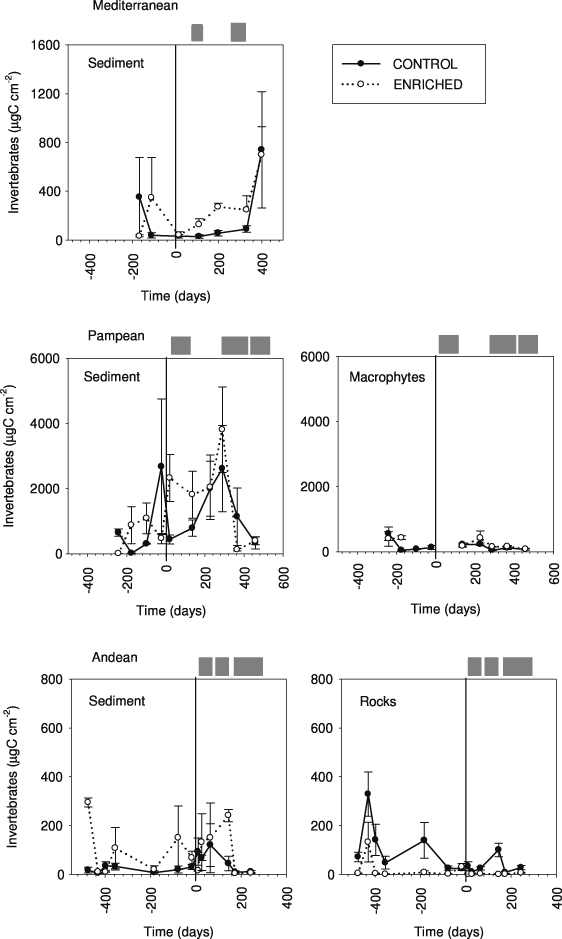
Figure 4. Invertebrate biomass (μg C cm−2) at the C and E reaches from the three streams analyzed. Values are means (n = 5) and standard errors of different types of communities (from sediment, rocks, suspended and macrophytes) at the different sampling times. The vertical line indicates the beginning of the enrichment experiment.
Download figure:
Standard imageAlthough the general enrichment effects on invertebrate biomass were weak, some specific invertebrate taxa were distinctly affected. The grazer Ancylus fluviatilis increased by 17% in the Mediterranean stream, and the grazer Camelobaetidus increased by 92.7% in the Andean stream. Densities of the scrapers Heleobia parchappei Orbigny (in fine sediments) and Hyalella curvispina Shoemaker (on macrophytes) increased in the Pampean stream (48% and 762%, respectively). Potamopyrgus antipodarum Gray (scraper) and Corbicula fluminea Müller (filterer) occurred only in the respective fertilized reaches of the Mediterranean and Pampean streams. The Tubificidae (−38%) and the Tanytarsini chironomidae (−29%) significantly decreased in the respective sediments of the Mediterranean and Andean streams.
3.6. Fish composition, biomass, and condition
The fish community in the Pampean stream was diverse, Astanax eigenmanniorum Cope, Bryconamericus iheringii Boulenger and Cheirodon interruptus Jenyns being the most abundant of the 16 species collected. Oncorhynchus mykiss Walbaum was the only species observed in the Andean stream. There were no fish in the studied reaches of the Mediterranean stream.
Fish biomass decreased (25–35% on average) in the Andean stream during the enrichment, but increased in the Pampean stream (figure 5). Most fish species in the Pampean stream showed no significant effects on fish condition (weight/length), except for Cnesterodon decenmaculatus (Jenyns), whose condition increased in the E reach and decreased in C. Alternately, the condition of O. mykiss in the Andean stream decreased in the E reach.
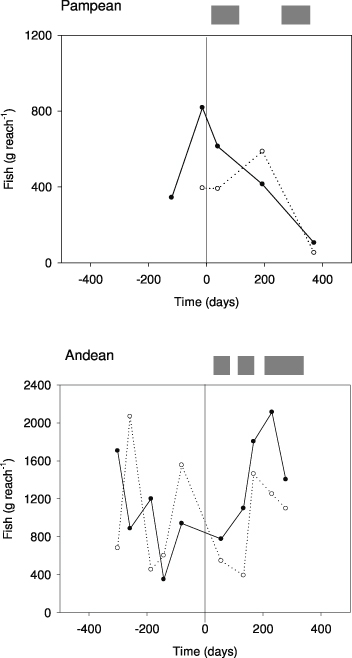
Figure 5. Fish biomass (fresh weight, FW) per area sampled (BPUE) in the C and E reaches of the Pampean and Andean streams at different sampling times. The C communities are represented by solid line, while the dotted line is for E communities. The vertical line indicates the beginning of the enrichment experiment.
Download figure:
Standard image3.7. Proportion of biomass variance explained by nutrient enrichment
The proportion of biomass variance explained by the nutrient enrichment varied markedly between biological compartments and streams (from 2 to 77%, figure 6). In the Andean stream it was greatest for algae (77% of the variance) whereas in the Pampean and Mediterranean streams it was highest for invertebrates (averaging 63% and 54%, respectively). Enrichment effects also explained important variation in fish communities in the Andean and Pampean streams (48% and 9%, respectively). The greatest overall effects of enrichment were recorded in the Andean stream whereas the lowest effects occurred in the Mediterranean stream (figure 6).
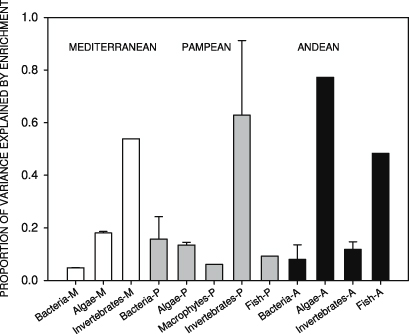
Figure 6. Proportion of variance explained by nutrient enrichment on the biomass of biological communities (bacteria, algae, macrophytes, invertebrates and fish) in the three streams. The values represent the η2 values calculated with the before/after effect (BA) plus the control/enriched × time interaction (C × BA) in the ANCOVAs (see section 2 for further details). The values are the averages of the different variables in table 2 averaged per biological compartment and stream. Bars indicate the standard error. Please note that standard errors could only be computed when there was more than one variable per compartment.
Download figure:
Standard image4. Discussion
The three studied streams showed specific and contrasting responses to nutrient enrichment. Nutrient enrichment globally enhanced the biomass of autotrophs and heterotrophs, although the magnitude, as well as the timing and the extent to which it affected the different trophic levels differed. These results showed that nutrient enrichment can trigger different responses depending on environmental conditions. The largest effects occurred in the Andean stream, followed by the Mediterranean stream, whereas at the Pampean stream communities were less affected by enrichment despite wide windows of opportunity. This result corroborates our first hypothesis, that the increase in biomass would be proportional to basal nutrient limitation. It is worth noting that in the present experiment the enrichment was moderate, and is likely that responses between systems would have differed even more had we increased nutrient concentration above the defined goal (Hilton et al 2006).
Although their basal nutrients concentration was similar, the Andean and Mediterranean streams responded quite differently to nutrient enrichment. In these two systems the increase in biomass was related to the occurrence and duration of windows of opportunity, as we hypothesized. The response was highest in algae, and especially in the Andean stream, where temperature and light regime are favorable throughout the year, and periods with base flow are relatively long. The moderate response of the Mediterranean stream communities despite strong P limitation (N:P = 68–70 before enrichment) derives from the narrow extension in the windows of ecological opportunity. Indeed, algal biomass in this stream mostly respond to nutrient enrichment for a brief period from late spring to early summer, when temperature was favorable, light not completely limiting and flow moderate (Sabater et al 2011). Bacterial response to nutrient enrichment followed more complex patterns. Effects were immediate in the Andean stream and more extended in the Mediterranean stream, where bacterial biomass peaked from early summer to autumn, coinciding with higher temperatures, higher algal biomass and large inputs of detritus (Artigas et al 2009, Sabater et al 2011). Bacterial response to nutrient enrichment could hence be a direct response to the higher nutrients availability, as well as a response to higher algal and other detritic material. The immediate rise in bacterial density indicates an initial independent response, since bacteria are organisms with a high affinity for phosphorus (Coveney and Wetzel 1992). Instead, the coupled long-term response of bacteria and algae to nutrients may be a result of the algal biomass increase, since algae and bacteria maintain mutualistic relationships (Rier and Stevenson 2002), expressed in higher bacterial biomass when more algal material is available.
The effect of nutrient enrichment on consumer biomass, and hence energy flow from producers to higher trophic levels, was in general moderate. The magnitude observed in the experimental response was related to the magnitude and duration of effects in basal trophic levels (Van de Koppel et al 2006). In the Mediterranean and Andean stream the sustained increase in algal biomass promoted a moderate increase of consumer biomass (e.g. the grazers Ancylus or Camelobaetidus), as observed in other studies (Hairston and Hairston 1993). In the Mediterranean stream the effect on algal biomass was high but fluctuant, and thus only some invertebrate taxa with short life cycles and the capacity to use autochthonous organic matter (e.g. the grazer Ancylus fluviatilis) responded. The large response in the Pampean stream could be related with the microbial increase in the sediments, a preferential habitat for invertebrates in that system. The fact that stream grazers were the ones showing the highest response among invertebrates suggests that algal-based food webs responded more than detritus-based food webs to the experimental manipulation. It could happen that enrichment was not sufficiently high to cause the response of decomposers observed in other experiments, which used more substantial nutrient increases (Suberkropp et al 2010). Our biomass-based estimations could only yield limited information on trophic interactions, and alternative approaches like stable isotopes (e.g. Bergfur et al 2009) might be necessary to disentangle the transference of effects through the food webs in the streams. In addition, flow irregularities occurring in the Mediterranean stream (e.g. the lengthy drought during summer) could have impaired the response of consumers to bottom-up effects.
The responses of the different trophic levels could not be separated from the complexity of the trophic food web. The multiplicity of stream habitats as well as the complexity of the food web may cause disparity of biological responses to nutrient enrichment (Davis et al 2010). Hilton et al (2006) predicted two different types of response of rivers to eutrophication: in slow-flowing streams and rivers the response would be similar to that found in lakes, and result mainly in increased phytoplankton biomass, whereas in fast-flowing streams the response would affect mainly benthic organisms. In our case, the Pampean stream was slow moving and very productive (Acuña et al 2011), but the response of incidental plankton was weak and the macrophytes were not affected. At the top of the trophic cascade, fish did not show an increase in biomass, although the condition of some species improved. In the Pampean stream, the fish species Cnesterodon decenmaculatus improved their condition during the enrichment. This response was explained by greater amounts of autochthonous organic matter (algae, macrophytes) and higher quality relative to allochthonous detritus that allows fish to survive unfavorable periods in better condition (see Wang et al 2006). In the Andean stream, where enrichment clearly enhanced autochthonous organic matter resources, fish condition was not improved and biomass decreased. However, the greater mobility of fish species, as well as their feeding preferences (mostly salmonids, which are insectivorous), could be linked to the large response to enrichment observed by trout in the Andean stream.
Nutrient enrichment also had some effects on the structure of biological assemblages. Although we did not detect reduced species richness, the enrichment favored taxa more tolerant to the new conditions and therefore increased in their relative abundances. This was the case for several diatoms (Rhoicosphenia or Nitzschia; Leira and Sabater 2005), and several generalist invertebrates (Potamopgyrgus antipodarum or Corbicula fluminea). Increased dominance of generalist taxa is a common outcome of nutrient enrichment (Stevenson and Pan 1999). However, the fact that sensitive species did not disappear shows that enrichment levels were moderate, but alternatively may also indicative that the enrichment was not sufficiently long. Moderate nutrient addition tends to have smaller effects on community composition than disturbances such as floods or severe droughts (Stevenson and Sabater 2010). The shift in species proportions might result in decreased efficiency of resource use, but probably not in the impairment of the functioning of the whole ecosystem (Rapport and Whitford 1999).
The present research showed that stream ecosystems respond to moderate nutrient enrichment in highly specific ways, depending on environmental constraints and specific nutrient limitation. In general, the enrichment reinforced autotrophic pathways (algae–invertebrate grazers) rather than the heterotrophic ones (bacteria–invertebrate shredders), that could have important consequences in cases of long-lasting enrichment. Our results also suggested that the ecological consequences can be highly site specific, but that some patterns can be related to existing climatic differences. We showed that the tropical stream had the strongest response because its windows of ecological opportunity were the widest. Windows of opportunity might be wide in tropical streams given their lesser seasonality, and this makes them more sensitive to eutrophication than other systems. These systems might be sensitive to additional disturbances, such as the elimination of riparian cover (which could favor light entrance and warmer water). Other stream types (mostly in the temperate region) may also increase their susceptibility to eutrophication because of ongoing scenarios of global change. In many headwater streams of the temperate zone, nutrient loads will increase and river discharge decrease (especially as a consequence of water abstraction; Sabater and Tockner 2010). Finally, the effect of nutrient enrichment may be less predictable in those systems having high basal nutrient concentrations, such as the naturally enriched Pampean streams, which could be close to saturation. This stream shows the most complex and more compartmentalized food web of the three, and this complexity can buffer the potential transference of bottom-up effects after nutrient addition.
Overall, these results indicate that a range of measures could be taken to reduce the effects of eutrophication on streams, such as preserving the riparian vegetation to regulate light and temperature or preserving of hydrological variability to guarantee nutrient dilution and biomass control.
For site photographs, please see the supplementary material (available at stacks.iop.org/ERL/8/014002/mmedia).
Acknowledgments
This study was funded by the project GLOBRIO of the Banco Bilbao Vizcaya Argentaria (BBVA) Foundation. Additional funding was obtained from the projects SCARCE (Consolider Ingenio 2010, CSD2009-00065) and CARBONET (CGL2011-30474-C02-01) of the Spanish Ministry of Science and Innovation.