
Abstract
A novel synergistic approach to reducing emissions from residential wood combustion (RWC) is presented. Wood energy fuel cycle optimization (FCO) aims to provide cleaner burning fuels through optimization of forestry and renewable energy management practices. In this work, beech and spruce forests of average and high quality were modelled and analysed to determine the volume of fuel wood and its associated bark fraction produced during typical forestry cycles. Two separate fuel wood bark production regimes were observed for beech trees, while only one production regime was observed for spruce. The single tree and stand models were combined with existing thinning parameters to replicate existing management practices. Utilizing estimates of initial seedling numbers and existing thinning patterns a dynamic model was formed that responded to changes in thinning practices. By varying the thinning parameters, this model enabled optimization of the forestry practices for the reduction of bark impurities in the fuel wood supply chain. Beech forestry cycles responded well to fuel cycle optimization with volume reductions of bark from fuel wood of between ∼10% and ∼20% for average and high quality forest stands. Spruce, on the other hand, was fairly insensitive to FCO with bark reductions of 0–5%. The responsiveness of beech to FCO further supports its status as the preferred RWC fuel in Switzerland. FCO could easily be extended beyond Switzerland and applied across continental Europe and North America.
Export citation and abstract BibTeX RIS
1. Introduction
Combustion of log wood fuel during residential wood combustion (RWC) leads to emissions of particulate matter, volatile organic species and greenhouse gases. Greenhouse gases (GHGs), including CO2, CH4, N2O etc, absorb solar radiation, contributing to global warming while combustion derived particulate matter (PM) emissions incur significant health and environmental impacts globally. Particular to biomass fuels, low combustion efficiencies lead to significant generation of black carbon (BC) along with products of incomplete combustion (PIC). BC and PIC contribute significantly to global warming [1], with BC thought to be the second largest contributor to climate change after CO2 [2]. Contributions of direct biomass emissions to the global black carbon budget are thought to be around 20%, a value similar to the contribution made by combined industrial and transport emissions from diesel engines [3]. As usage of biomass fuel increases in response to climate, sustainability and economic factors [4, 5], increases in efforts to reduce these emissions are required.
Biomass as a combustion fuel encompasses solid materials (e.g. wood logs) [6–8], processed materials (wood chip, pellets) [9], waste products (recycled wood, agricultural by-products) [7, 10–13], gasified materials (methanization of solid fuels) [14, 15] and liquefied materials (e.g. esterification products) [16, 17]. These fuels can be classified according to their origin and production method (life cycle stage). Primary fuels are sourced specifically for the purpose of energy (heat or electricity) generation while secondary fuels have undergone processing to reach a preferred combustion format (e.g. chips or pellets). Finally, tertiary fuels are those derived from materials having already undergone a greater portion of their lifecycle (e.g. recovered building materials). These materials are then recycled, producing pellets, chips or briquettes for use as combustion fuels.
This letter focuses predominantly upon primary fuels. In particular we are interested in log wood fuels and their bark fraction. Bark is known to be rich in resins and minerals and, as such, combustion of wood and bark together leads to significantly higher emissions of PM, BC, organics etc than combustion of clean wood alone [18, 19]. Additional to the influence of bark upon emission factors, the presence of bark in log wood fuels has also been shown to reduce the particle removal efficiency of electrostatic precipitators [19].
Swiss forestry and, subsequently, wood fuel production is dominated by three wood species [20]. Spruce (Picea abies) and fir (Abies alba Mill.) are the prevalent softwoods (55% and 16% respectively) while beech (Fagus sylvatica L.) is the prevalent hardwood (16% of total production). In addition to the dominant species, larch (Larix decidua Mill.) makes up 5.5% of total production and 12 other species contribute less than 2% each. Industry and expert estimates indicate that the ratio of hard to softwoods used in energy production is 57:43 in Switzerland [21]. On the other hand, hardwood species account for 72% of log wood fuel produced in Switzerland, while softwoods account for the remainder [22]. Beech contributes 67% of the hardwood fuels and spruce contributes 72 % of the softwoods [23].
In Switzerland RWC supplies ∼5% of the consumed primary heating energy [24] but is responsible for 20–50% of particulate and gas-phase emissions [25]. Future energy scenarios suggest that current levels of consumption could sustainably increase by a factor of two [4, 26], likely leading to increased emissions. RWC emissions can be reduced by replacing existing combustion systems with modern combustion technology [27, 28] or by installing after-treatment devices [29–31], however these options require significant capital expenditure [32].
As a complementary technique for reducing RWC emissions we propose that optimizing the log wood fuel cycle to reduce impurities in the fuel will contribute to lower emissions. The fraction of the tree that contains the most combustion emission precursors by volume is the bark. Reduction of the bark fraction could be achieved through mechanical processes, or through long-term fuel cycle optimization (FCO). The premise of cleaner fuels leading to lower emissions has been applied extensively in the automobile industry with significant positive outcomes [33–35]. We hypothesize that combining FCO with existing forestry and energy fuel management practices will lead to reductions in combustion emissions of green house gases, particulate matter, volatile organics etc.
2. Assumptions and methodology
2.1. Assumptions
During the initial stages of this research, relevant analytical boundaries were established. These included: the wood species analysed, the region of production, the harvesting method employed and the destination of the wood produced. In the interests of preparing a simple, yet relevant model we settled on the analysis of high beech and spruce forests, grown in the Swiss Mittelland. Regionally, wood production in Switzerland is separated into five regions with the dominant region being the Swiss Mittelland (or Plateau). This region encompasses the plain to the north of the Alps, extending from Geneva in the south-west through the populated Zurich and Bernese regions into the Appenzell region bordering Austria in the north-east. The Plateau generates 2.90 Mm3 of wood products [23] including 41% of total Swiss wood energy production [22]. In all regions in Switzerland, high forests are dominant [36].
Wood production (thinning) characteristics of a single forest stand of one hectare were acquired from the Swiss Federal Institute for Forest, Snow and Landscape Research (WSL) permanent plot yield tables [37–39]. The yield table describes the growth of high timber forests located in the Swiss Plateau region at altitudes of 400–1000 m.a.s.l. during a growth period of ∼120 yr. The tables give the density of the stand every 10 yr in the entire rotation period of the forest. In addition to the thinning tables, additional tables provide information on the remaining trees in the forest after each thinning episode. Adding the two tables together, it was possible to calculate total tree numbers at the beginning of, and during, the cycle. The production and thinning processes used in this work were based on yield tables for beech and spruce forests of average and high quality. In forestry terminology, these forests are classified as having site index of H16 and H22 respectively. Site indices H16 and H22 describe average and high forest stand growth conditions, respectively.
Wood products are defined by their potential usage and these can be specified by diameter. Using assumptions based on Swiss commercial standards for beech and spruce [40–44] we dimensionally classified the wood according to its usage profile (table 1). Roundwood is suitable for industry and construction purposes. Primary fuel wood derives from both fuel stem wood and branches. Branch sections having diameter greater than 7 cm are classified as primary fuel wood. Smaller branch material (e.g. twigs) is classified as secondary fuel. Utilizing available data [36, 45], good quality and high quality beech were found to constitute 41.1% and 55.4% of all beech in the Swiss Mittelland. The quality of spruce in the Mittelland is estimated to be extremely high, with H22 contributing 94.3.
Table 1. Usage profile classifications for beech and spruce of average and high quality.
| Roundwood (cm) | Primary fuel wood (stem wood & branches) (cm) | Secondary fuel wood (chips) (cm) | Prevalence in Swiss Mittelland (%) | |
|---|---|---|---|---|
| Beech H16 | >35 | 7–35 | <7 | 41.1 |
| Beech H22 | >25 | 7–25 | <7 | 55.4 |
| Spruce H16 | >25 | 7–25 | <7 | 3.8 |
| Spruce H22 | >15 | 7–15 | <7 | 94.3 |
2.2. Methodology
To assess the potential of FCO, separate models characterizing both single trees and a typical forest stand were required. The single tree (micro) model was used to quantify the production of round wood, fuel wood, bark and chips (as well as waste) from trees of user-defined diameter. The forest stand (macro) model incorporated output from the individual single tree models. Based upon stock levels and thinning operations, the stand model enabled production per hectare (m3 ha−1) to be quantified.
2.2.1. Single tree model.
The single tree model was developed to calculate the total volume of a tree (stem, branches and twigs), with and without bark. Our initial premise was to utilize a conical taper model to determine the volume of stem intervals (Vi), with and without bark. Primary inputs to the model were diameter at breast height (db), in centimetres, and total height (ht), in metres. Existing work in this area includes assessments of average [46] and diameter dependent [40, 47] bark percentage by species.
The method employed in this letter evolved from an existing method. The Lemm method describes a taper function with and without bark for a given tree species as a function of tree height and breast height, d(ht,db) [48]. These diameters were then used to determine the volume of a user-defined beech tree with and without bark. However, estimates of the volume of the tree without bark were found to be unrealistically low. The bark volume estimate used by Lemm derives from the tree diameter without bark, which is a function of a percentage bark fraction. In this method, the term is diameter independent. That is, the formula returned a fixed bark percentage for a given height, regardless of the diameter of the tree. (i.e. both small trees and large trees exhibited the same bark fraction at a selected height). This led to an underestimation of the calculated bark fraction for small trees.
In consultation with Lemm, it seemed more appropriate to reparameterize the bark terms in the formula. Single large trees (db ∼ 60 cm) were modelled and their percentage bark versus diameter was plotted and parameterized as a function of diameter. This new function was then used as a guide to determine bark percentage at a given diameter, rather than for a given height. The beech bark function was fitted using third order polynomials, while the spruce bark function was fitted using a second order polynomial. Coefficients of the parameterizations are given in table 2.
Table 2. Coefficients of the reparameterization of the bark terms in the taper model.
| a1 | a2 | a3 | a4 | db range (cm) | |
|---|---|---|---|---|---|
| Beech fbark (db) | 0.000 0359 | −0.002 7104 | −0.055 4414 | 8.156 0223 | 2–60 |
| Spruce fbark (db) | −0.000 33 | −0.079 21 | 10.307 49 | — | 2–55 |
| Spruce fbark (db) | 0.0126 | −1.544 84 | 51.6037 | — | 55–60 |
Applying the new bark parameterizations, a modified version of the taper function was used to calculate the volumes of a series of stem intervals, with and without bark. The sum of the intervals gives the total volume of the stem and its bark fraction. Interval volumes were calculated using the volume formula of a truncated conical section. During methodology development, the height interval used for each truncated section (δh) was 10 cm. Intervals were summed from the base of the tree up to a user-defined reference height. This height was estimated using the SILVA 2.2 single tree simulator [49] and represented the base height of the branches, otherwise known as the crown height (hcrown). In this work hcrown is determined as a function of ht, db and species and location dependent constants c1–3, such that

c1 =− 0.5478 ± 0.0229; c2 =− 0.1094 ± 0.0158; c3 =− 0.0023 ± 0.0003.
Using hcrown as the maximum height of the stem it was possible to calculate the volume of a series of truncated conical sections (Vi) from the ground up to hcrown. The sum of the section volumes gave the stem volume Vstem. The same procedure was performed for bark free conical sections. The volume difference between each of the two sections was calculated, from which the volume fraction of bark (%barkvol) in each section was determined.
Revision of existing literature and consultation with experts did not reveal any direct methods for estimating the bark fraction of the branches (diameter > 7 cm) or twigs (diameter < 7 cm). However, the Brassel–Lischke method models the volume relationship between stem wood, branches and twigs [50]. For each species, Brassel–Lischke incorporates regression coefficients (k1 and k2) that describe the volume relationship of branches and twigs to a corresponding stem (table 3). These constants are representative of beech and spruce trees in the Swiss Mittelland [42, 50]. Based on assumptions made in the Swiss National Forestry Inventory, spruce trees are considered not to have branches of >7 cm diameter, and therefore no coefficients exist [50].
Table 3. Branch and twig regression coefficients for beech and spruce.
| Branches | Twigs | |||
|---|---|---|---|---|
| K1 | K2 | K1 | K2 | |
| Beech | −5.990 3924 | 0.101 889 09 | −0.759 6139 | 0.033 555 23 |
| Spruce | — | — | −1.206 1326 | −0.019 1865 |
Utilizing this method, the volume of the branches was calculated as follows

where ω is equal to:

Combining the modified taper function and the Brassel–Lischke method the total volume of a typical tree as a function of its height and db can be determined as follows:

In the absence of empirical or modelled data, the bark fraction in the branches was taken as the average of percentage bark volume (%barkvol) in the tree section ranging from crown height to the point where the taper thins to 7 cm. The volume of the bark fraction in the twigs was taken as the average of %barkvol in the taper section from 7 cm to the apex. As such, the volume with and without bark for each tree segment (stem wood, branches and twigs) can be determined as a function of ht and db. By summing each segment, the total bark and wood fractions can be quantified.
Based upon assumptions given in section 2.1 the entire volume of the tree can be allocated to one of the following usage profiles: stem wood, fuel wood (stem and branch), bark and chips. For each profile the wood and bark volumes can be modelled, and as such, the total volume of wood and bark for a given tree can be estimated. In total 18 trees with db ranging from 2 to 60 cm were modelled, with δh, the height interval, set to 1 m. During methodology preparation, comparisons of δh set at 10 cm and 1 m were made and the stem volume variance was found to be less than 1%. The characteristics of these trees were used to prepare the forest stand model and are presented in section 3.1.
2.2.2. Forest stand model.
Assessing the production of fuel wood per hectare required the implementation of a forestry stand model. Complex models describing stand characteristics do exist [43] however, within the scope of this work, these were unnecessarily detailed where only tree numbers per hectare and initial seedling numbers were required. Typically, yield tables provide this information, detailing the number of trees thinned and those remaining for a typical forest area. Existing yield (thinning) tables for beech and spruce forests indicate that each tree increased in breast height diameter by an average of 4.2 cm (site index 22) or 3 cm (site index 16) every 10 yr. This information was used to estimate the volume fraction of each of fuel modes (i.e. fuel wood, etc) for each of the beech and spruce combinations and formed the baseline against which later optimizations were considered.
Combining the modified taper model and the yield tables provided information on the fuel and bark outputs arising from the specified forestry management practices. However, this method was static and did not enable analysis of variations in management practices. Consideration of the influence of the variations required the development of a dynamic model. The layout of the existing yield tables (table 4) was transposed by 45°, enabling vertical representation of the cycles (table 5). The transposed cycles were more manageable computationally and still contained the required information: tree age, diameter at breast height and thinning numbers. Table 5 shows thinning as a function of cycle year (Ty) and diameter (di) for cycle C1–CN. It is worth noting that for a given Ty, trees in Cn+1 have larger diameter than trees in Cn because they started growing earlier and are part of an on-going cycle.
Table 4. The layout of the original thinning tables.
| Diameter (cm) | 2 | 6 | 10 | 4(N − 1) | (4N) | |
|---|---|---|---|---|---|---|
| Cycle years | C1 | C2 | C3 | — | CN−1 | CN |
| 20 | T20di | |||||
| 30 | T30di | |||||
| 40 | T40di | |||||
| — | — | |||||
| 100 | T100di | |||||
| 110 | T110di |
Table 5. The transposed layout of the thinning tables.
| Diameter (cm) | 2 | 6 | 10 | 4(N − 1) | (4N) | |
|---|---|---|---|---|---|---|
| Cycle years | C1 | C2 | C3 | — | CN−1 | CN |
| 20 | T20d1 | T20d2 | T20d3 | — | T20dN−1 | T20dN |
| 30 | T30d2 | T30d3 | T30d4 | — | T30dN | T30dN+1 |
| 40 | T40d3 | T40d4 | T40d5 | — | T40dn+1 | T40dN+2 |
| — | — | — | — | — | — | — |
| 100 | T100dN−1 | T100dN | T100dN+1 | — | T100d2N−1 | T100d2N |
| 110 | T110dN | T110dN+1 | T110dN+2 | — | T110d2N | T110d2N+1 |
3. Results and discussions
3.1. Single tree models (wood)
Estimates of the total volume of beech and spruce trees in the range 2–60 cm were generated. Each diameter class was apportioned, by volume, into one of the four usage profiles (figures 1(a) and (b)). For both beech and spruce trees, the smallest trees (2–6 cm db) contribute solely to the chip/waste profile. Trees from 10–22 cm (beech) and 10–14 cm (spruce) db are predominantly used as fuel wood. For db of 25 cm (beech) and 18 cm (spruce), trees are suitable for construction (e.g. lumber) use and contribute to the roundwood profile. For beech trees, a second regime of fuel wood production can be attributed to fuel coming from the branches. As such, fuel stem wood (Fsw) dominates the volume contribution to fuel wood for trees having diameter less than 41 cm while for trees of larger diameter, fuel wood is primarily sourced from branches (Fb). For spruce trees, all branches are considered to have diameter less than 7 cm and are corralled into the chips/waste supply chain. As such, spruce fuel wood production is derived solely from Fsw.
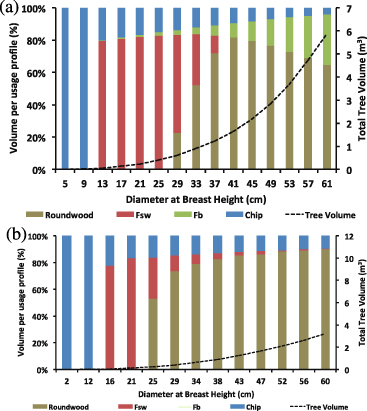
Figure 1. (a) Volume contribution of each usage profile to the total volume of beech (H22) trees (as a function of db). (b) Volume contribution of each usage profile to the total volume of spruce (H22) trees (as a function of db).
Download figure:
Standard image3.2. Single tree models (bark)
Analysis of bark production with respect to fuel wood produced by single trees confirms the existence of two bark production regimes in beech trees and one production regime in spruce trees. For a single beech tree (H22), the percentage of fuel wood bark is at a minimum at the intersection of the two fuel wood regimes, db ∼ 41 cm (figure 2(a), upper panel). Fuel wood bark is comprised of bark from stem wood (Bsw) and bark from branches (Bb). For a H16 beech tree, the minima (or rather a shoulder) occurs at db ∼ 32 cm (figure 2(a), lower panel). Spruce trees do not exhibit explicit minima. However a region of minimal bark production exists from 35 to 50 cm db for H22 and from 30 to 50 cm for H16 classed spruce. These minima were used as guide for optimizing the fuel wood production.
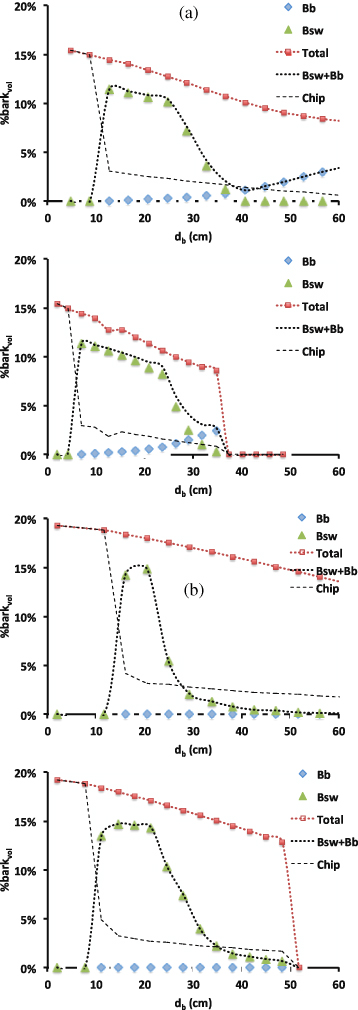
Figure 2. (a) Volume percentage of bark as a function of db of the three non-roundwood profiles in the beech single tree model. Upper panel represents H22, lower panel H16. Total bark production is shown by the red dotted line. (b) Volume percentage of bark as a function of db of the three non-roundwood profiles in the spruce single tree model. Upper panel represents H22, lower panel H16. Total bark production is shown by the red dotted line.
Download figure:
Standard image3.3. Stand results
The tendency of these species to produce less fuel wood bark at a certain point in their lifetimes was analysed to find optimum conditions for reducing the bark fraction. Utilizing the combined single tree and stand models, the production of wood and bark for each of the profiles was determined for beech and spruce trees. As an example, the absolute production (m3) of roundwood, fuel wood and fuel wood bark for beech H22 is reported in table 6. The upper section shows the original production, based on the yield tables, while the lower section shows the results of the optimizing the thinning to reduce bark. As far as was possible, absolute production of fuel wood was held constant during the optimization process. For the case presented in table 6, this led to a 7% reduction in bark fraction. The bark reduction was calculated as a weighted average of the production. Applying the same method, bark reductions of 13.1% were found for the beech H16 stands, while spruce H22 and H16 exhibited reductions of 0.5% and 3.6% across the cycle. A positive side effect of the optimization process is an ∼340% increase in round wood production. We believe that this change has the potential to increase the carbon storage potential of forests managed in this way. In fact, the extension of forest cycles and corresponding increases in forest density has been shown increase carbon storage [51, 52]. Further, increasing the availability of sustainably grown wood for production purposes, particularly as a substitute for alternate materials (e.g. concrete), has been shown to have significant lifecycle benefits [53].
Table 6. Absolute production of roundwood, fuel wood and fuel wood bark for beech H22.
| C1 (m3) | C2 (m3) | C3 (m3) | C4 (m3) | C5 (m3) | Totals | |
|---|---|---|---|---|---|---|
| Original | ||||||
| Roundwood | 7.7 | 20.9 | 29.1 | 38.4 | 48.8 | 144.9 |
| Fuel wood | 25.1 | 36.2 | 42.6 | 39.7 | 35.6 | 179.1 |
| Fuel wood bark | 3.2 | 4.7 | 5.5 | 5.0 | 4.3 | 22.6 |
| Fuel wood bark (%) | 12.8 | 12.9 | 12.8 | 12.5 | 12.1 | 12.6 |
| Model | ||||||
| Roundwood | 23.0 | 52.7 | 131.9 | 139.0 | 159.5 | 506.1 |
| Fuel wood | 16.9 | 32.3 | 30.5 | 40.2 | 53.3 | 173.2 |
| Fuel wood bark | 2.0 | 3.8 | 3.6 | 4.8 | 6.1 | 20.3 |
| Fuel wood bark (%) | 11.8 | 11.8 | 11.9 | 11.9 | 11.5 | 11.7 |
| Bark reduction (%) | 8.0 | 8.5 | 7.1 | 5.1 | 5.1 | 7.0 |
The values presented in table 6 summarize the production curves shown in figure 3. Figure 3(a) shows a single mode of production for roundwood and the now expected dual production mode of fuel wood. Alternatively, figure 3(b) shows the single productions modes for both roundwood and fuel wood from spruce, with the majority of fuel wood produced by trees having db less than 20 cm.
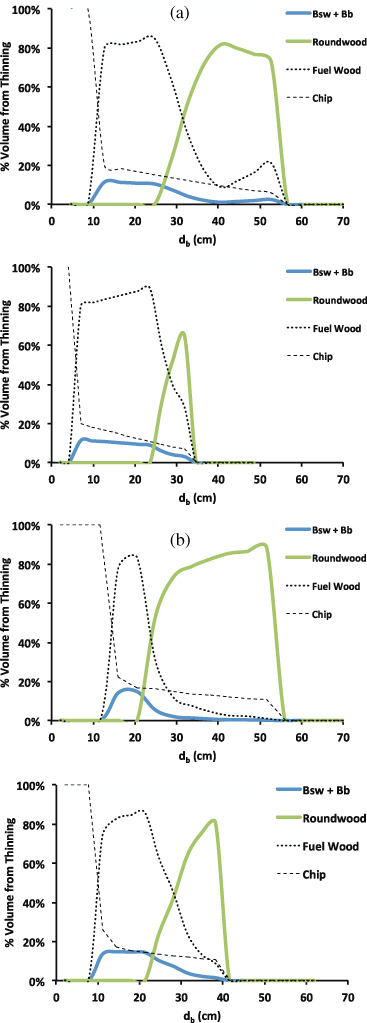
Figure 3. (a) Percentage production (by volume) of fuel wood bark, roundwood, fuel wood and chip for beech cycles C1–C5. Upper panel represents H22, lower panel H16. (b) Percentage production (by volume) of fuel wood bark, roundwood, fuel wood and chip for spruce cycles C1–C4. Upper panel represents H22, lower panel H16.
Download figure:
Standard image3.4. Optimization results
For each of the tree species, the initial inputs for the dynamic thinning model were the original starting values (tree numbers) of each of the cycles. These were manually adjusted and fine tuned to find the minimum value of the bark production for each cycle. Examples of the influence of the original and optimized thinning processes upon beech fuel wood and fuel bark are shown for cycles C1 and C5 (figure 4(a) and (b)). Fuel wood production in cycle C1 is initially in the db range 10–30 cm, as is the bark production. Varying the thinning strategy so that the majority of remaining trees are thinned at db between 20 and 40 cm leads to an 8% reduction in the relative production of bark.
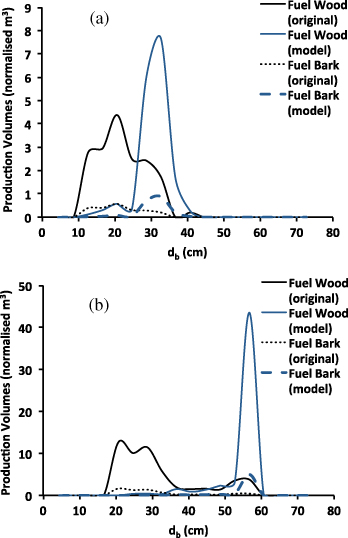
Figure 4. (a) Shift in thinning volume for an exemplary beech (H22) fuel wood production cycle (C1). (b) Shift in thinning volume for an exemplary beech (H22) fuel wood production cycle (C5).
Download figure:
Standard imageApplying the same method to C5, a significant shift to the right in fuel wood production was observed. This led to a 5% reduction in bark fraction. Similar analysis was conducted for beech and spruce (H16 and H22) cycles, the results of which are summarized in figure 5.

Figure 5. Summary of the bark reduction potential for beech (H16 and H22) and spruce (H22).
Download figure:
Standard imageBark reduction due to FCO for each of the beech and spruce stands is presented in figure 5. Significant differences between beech and spruce are immediately apparent. Beech responds well to FCO while spruce was found to be less sensitive. Comparing beech H22 and H16, it is clear that the lower quality H16 benefits most from FCO. This of some importance, given that a not insignificant volume of Swiss fuel wood is derived from beech H16 stands. A similar relationship exists between the spruce coming from H22 and H16 stands. The different responses of beech and spruce to FCO should be taken into account when considering which fuels have the potential for lower emissions. Generally, for RWC, hardwoods are preferential to softwood and they also exhibit lower emissions [54]. As such, FCO complements the existing support for the use of hardwood RWC fuels.
Further analysing figure 4, the differences between, for example, C1 and C5 can be explained as follows. For C1, production lies to the left of the 41 cm optimum, while for C5, the production is distributed fairly evenly around this diameter. For C1, the distribution provides space to shift production to the right and the significantly lower bark production regime. For C5, the distribution is already centred around dopt and, as such, only limited gain can be had by shifting production to the right. In summary, forests with dominant fuel wood allocations are most responsive to FCO (e.g. beech H16).
Extending the concept beyond the beech and spruce cases discussed here, FCO could also be applied to forest stands solely grown to produce fuel wood. In the Swiss case however, no such plantation forests exist. However, in other countries, forests that solely produce fuel wood and are characterized by short forest cycles do exist (e.g. Italian beech coppice with 10–30 yr cycles) [55]. In principle FCO could be extended to, and would well suit, these solely fuel producing rotation forests. Additionally, FCO could be applied to fuel wood plantations (short rotation); these are relatively widespread throughout Europe. Given the standardized management techniques employed in plantation forests, applying FCO would be simpler than for natural forests. These applications of FCO could be extended throughout continental Europe and North America. Further, FCO could be further applied to Swiss forests where stem defects exist. In this case, entire tree stems are downgraded to fuel quality wood [41, 44] and these could be managed similar to fuel wood plantation forests. Finally, combining cleaner fuels, modern combustion appliances and after-treatment devices leads to a comprehensive emission reduction suite (and lowest possible emissions).
4. Conclusions
A novel method for reducing emissions from residential wood combustion by lowering the bark fraction in log wood has been proposed. An existing single tree model was extended, enabling quantification of the bark fraction in stem wood, branches and twigs. Applying this model over the full growth cycle of single beech and spruce trees led to the identification of fuel wood bark production minima. Single tree data was then applied to modified forestry production (yield) tables. Forestry stands of average and high quality, typical to Switzerland, were analysed. Exploiting the fuel wood bark production minima enabled optimized (reduced bark) production tables to be developed. Of the average quality forests analysed in this work, bark fraction reductions of 10–20% and 3–4% were observed for beech and spruce. Although spruce did not respond as well as expected to FCO, the results from beech wood were pleasing (and give support for deeper analysis). Given global utilization of beech wood as a renewable fuel, FCO has the potential to be applied across continental Europe and North America, especially in forests with prevalent fuel wood usage profiles.
Acknowledgments
Both authors are grateful for expert advice provided by: Oliver Thees and Renato Lemm (WSL); Christian Rossett (Swiss Agricultural College); Edgar Kaufmann (WSL); Jean-Philippe Schutz (ETH (Emer. Professor)), Christoph Aeschbacher (Holzenergie Schweiz) and Fabrizio Cioldi (WSL).
N K Meyer is supported financially by the Competence Center for Environment and Sustainability of the ETH Domain (CCES) as part of the IMBALANCE project. M Mina's internship was funded by The Energy Departments of Paul Scherrer Institute.