

Abstract
The 168 year trends of summer (July–September) sea ice area (SIA) variations in six Arctic regions during 1850–2017 are analyzed. SIA has been significantly decreasing in most Arctic regions since 1850. The rate of retreat for the period of 1948–2017 accelerated multi-fold. For the nearly four decades since 1979, most Arctic regions are experiencing the highest reduction rate. Besides the increasing surface air temperature, the key drivers to the accelerated summer Arctic sea ice decline are found to be the combined global warming and the regional Arctic warming exerted simultaneously by the Arctic Oscillation, North Atlantic Oscillation, Atlantic Multidecadal Oscillation and Pacific Decadal Oscillation during the last several decades. The dynamical and thermodynamical warming, driven by the internal variability of the teleconnection patterns, occurred in the last several decades, in particular on the multidecadal timescales. This leads to Arctic amplification that accelerates the positive ice/ocean albedo feedback loop, resulting in accelerating summer sea ice decline.
Export citation and abstract BibTeX RIS

Original content from this work may be used under the terms of the Creative Commons Attribution 4.0 license. Any further distribution of this work must maintain attribution to the author(s) and the title of the work, journal citation and DOI.
1. Introduction
Arctic sea ice plays an important role in the climate system. It is sensitive to climate change and strongly affects the atmospheric energy budget, ocean circulation, and air–sea interactions (Walsh 1983, Mysak et al 1990, Deser et al 2000). The persistent decline in annual sea ice cover, which can lead to unprecedented changes in the global climate, has been well documented since the 1980s (Stroeve et al 2012, Schweiger et al 2019).
Various studies have shown that the warming air temperature (Stroeve et al 2007, Polyakov et al 2012) resulting from the increased downward infrared radiation (Ikeda et al 2003, Kapsch et al 2016) and positive ice/ocean albedo feedback (Wang et al 2005, Screen and Simmonds 2010, Lei et al 2016), anomalous ocean currents (Kinnard et al 2011), anomalous wind forcing (Ogi et al 2010), northward transport of atmospheric moisture and sensible heat (Park et al 2015, Hegyi and Taylor 2018), and some dominant patterns of atmospheric circulation variability such as Arctic dipole anomaly (DA) (Wang and Ikeda 2000, Overland and Wang 2005, 2015, Wang et al 2009) are recognized as the possible key drivers of rapid Arctic sea ice loss.
This study examines the longest (168 year) summer sea ice area (SIA) time series regarding trend and variability. Compared with other studies (Alekseev et al 2016, Connolly et al 2017), the detailed geographical features in six Arctic regions are more emphasized (figure 1). Based on the evaluation of trends for different periods (1850–2017, 1948–2017 and 1979–2017), the impacts of global warming and dominant internal climate variability on the accelerated sea ice decline in the recent decades are further investigated, which was due to the accelerated positive ice/ocean albedo feedback at work (Wang et al 2005, 2014).
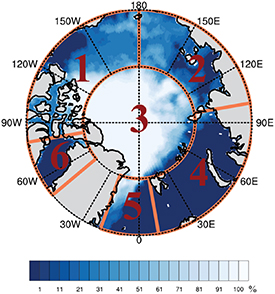
Figure 1. The Arctic ocean is divided into six regions used in this study (record breaking summer sea ice concentration in 2012 is shaded; units: %). Region 1: Beaufort and Chukchi Seas, also including the Canadian Archipelago; 2: Laptev and East Siberian Seas; 3: Central Arctic; 4: Barents and Kara Seas; 5: Greenland Sea; and 6: Baffin Bay.
Download figure:
Standard image High-resolution image2. Data and methods
The SIA data is the sum of the grid cell areas multiplied by the ice concentration (Peng et al 2013, Meier et al 2017, Walsh et al 2017) from the National Snow and Ice Data Center (NSIDC). The dataset consists of two types of measurements: traditional ship-based and airborne before 1979 and satellite-based since 1979. The data from 1900–1978 were merged to a gridded dataset (Chapman and Walsh 1993), which has been used by previous studies (Wang and Ikeda 2000, 2001, and many others). Using the same approach, Walsh et al (2017) further synthesized Arctic sea ice data from a variety of historical sources into the database, extending it back to 1850 with monthly time‐resolution. The synthesis procedure includes interpolation to a uniform grid and an analog‐based estimation of ice concentrations in areas of no data. Large uncertainty may exist in the data prior to 1979 and, in terms of mean, its systematic error should differ from that of the satellite era. However, in this study we investigate the variability rather than the mean, similar to Wang and Ikeda (2001) and Wang et al (2005), who used the dataset for analysis of sea ice variability and trend during the period 1900–1995. Brennan et al (2020) pointed out that the lower interannual variability during the instrumental era is mainly due to a lack of high quality sea ice observations in the early 20th-century warming (ETCW; 1918–1948) in this dataset. Therefore, we evaluated and compared the trends of 1850–2017, 1948–2017 and 1979–2017, respectively.
We mainly focus on the analysis in summer because that is the time period in which SIA reaches the minimum value (July–September) and high standard deviations usually occur (Wang and Ikeda 2001), indicating that summer ice cover can capture major interannual and decadal variability. The time series of summer SIA anomalies are calculated by removing the summer climatology (figure 2). The summer Arctic surface air temperature (SAT) time series (1850–2017; Morice et al 2012) is the standardized July–September averaged SAT anomalies over 70°–90° N by using HadCRUT4 from the Climatic Research Unit (University of East Anglia) and Hadley Centre (UK Met Office). For composite analysis (figure 4), the SAT is from the NOAA-CIRES Twentieth Century Reanalysis version 3 (1836–2015; 20CRv3; Slivinski et al 2019).
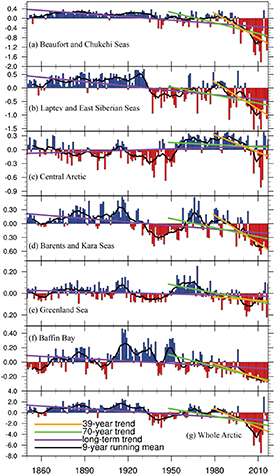
Figure 2. The time series of summer SIA anomalies in each Arctic region for the periods of 1850–2017 (units: 106 km2). (a) Beaufort and Chukchi Seas. (b) Laptev and East Siberian Seas. (c) Central Arctic. (d) Barents and Kara Seas. (e) Greenland Sea. (f) Baffin Bay. (g) Whole Arctic. The orange lines are 39 year trends, the green lines are 70 year trends, the purple lines are 168 year long-term trend and the black lines are 9 year running mean.
Download figure:
Standard image High-resolution imageBy applying empirical orthogonal functions (EOFs) to the normalized Arctic (70°–90° N) sea level pressure (SLP; 1948–2017) from the National Centers for Environmental Prediction National Center for Atmospheric Research (NCEP/NCAR) reanalysis I dataset (Kalnay et al 1996), the leading mode is Arctic Oscillation (AO) and the second mode is named Arctic DA pattern (Overland and Wang 2005, Wu et al 2006, Wang et al 2009). The station-based North Atlantic Oscillation (NAO) index (1865–2017; Hurrell 1995) is the difference of normalized SLP between Lisbon, Portugal and Stykkisholmur/Reykjavik, Iceland and obtained from the NCAR's Climate Analysis section. The Atlantic Multidecadal Oscillation (AMO) index (1856–2017; Enfield et al 2001) is computed as the area weighted average sea surface temperature (SST) over the North Atlantic and further detrended from the NOAA Earth System Research Laboratory. The Pacific Decadal Oscillation (PDO) index (1854–2017; Mantua et al 1997) as the leading (EOF) mode of North Pacific (20°–70° N) SST monthly averaged anomalies are from NOAA's National Centers for Environmental Information. Since summer AO, summer DA, winter (January–March) NAO, and summer PDO show better correlations with the summer SIA variation compared to other seasons, only these seasonal indices are shown in this study. Though there are quantitative differences among different seasons, the main results are in good agreement regardless of seasons.
Trends for the yearly SIA are calculated using linear least squares regression and the Student's t-test is used for the significance (table 1). The Monte Carlo simulation (Wang and Ikeda 2000) is used for the correlation evaluation (table 2).
Table 1. The linear decadal rates of summer SIA (unit: 106 km2 decade−1; at the 99% significance level) and trend percentages (shown in parentheses; unit: per decade; relative to the 1979–2017 average) in each region over the periods of 1850–2017, 1948–2017, and 1979–2017.
| Unit: 106 km2 decade−1 | 168 year trend (1850–2017) | 70 year trend (1948–2017) | 39 year trend (1979–2017) |
|---|---|---|---|
| 1. Beaufort and Chukchi Seas (B&C) | −0.045 (−1.51%) | −0.15 (−5.02%) | −0.34 (−11.37%) |
| 2. Laptev and East Siberian Seas (L&E.S) | −0.054 (−2.83%) | −0.10 (−5.24%) | −0.33 (−17.28%) |
| 3. Central Arctic (C.Ar) | 0.010 (0.14%) | −0.015 (−0.21%) | −0.12 (−1.70%) |
| 4. Barents and Kara Seas (B&K) | −0.025 (−4.72%) | −0.065 (−12.26%) | −0.20 (−37.74%) |
| 5. Greenland Sea (Gre.) | −0.0033 (−1.43%) | −0.026 (−11.30%) | −0.011 (−4.78%) |
| 6. Baffin Bay (Baf.) | −0.011 (−5.50%) | −0.052 (−26.00%) | −0.065 (−32.50%) |
| 7. Whole Arctic | −0.17 (−0.96%) | −0.46 (−2.60%) | −1.10 (−6.22%) |
All the rates are statistically significant at the 99% level and the trend percentages in parentheses are shown in bold for highlight.
Table 2. The correlation coefficient between summer SIA (left: SIA with long-term trend; right: SIA without long-term trend) and summer Arctic air temperature, summer AO, summer DA, winter NAO, AMO and summer PDO in each region (The 95% significance levels in bold are determined by Monte Carlo simulation.).
| Arctic SAT (1850–2017) | AO (1948–2017) | DA (1948–2017) | NAO (1865–2017) | AMO (1856–2017) | PDO (1854–2017) | |||||||
|---|---|---|---|---|---|---|---|---|---|---|---|---|
| B&C | −0.57 | −0.30 | 0.05 | 0.10 | −0.27 | −0.28 | −0.14 | −0.12 | −0.29 | −0.37 | 0.15 | 0.15 |
| L&E.S | −0.60 | −0.35 | −0.01 | 0.05 | −0.36 | −0.37 | −0.13 | −0.10 | −0.26 | −0.32 | 0.15 | 0.16 |
| C.Ar | −0.06 | −0.17 | 0.03 | 0.01 | −0.10 | −0.11 | 0.09 | 0.07 | −0.20 | −0.20 | 0.17 | 0.19 |
| B&K | −0.61 | −0.39 | −0.12 | −0.08 | −0.16 | −0.16 | −0.07 | −0.04 | −0.34 | −0.39 | 0.09 | 0.08 |
| Gre. | −0.38 | −0.27 | −0.26 | −0.25 | 0.12 | 0.13 | −0.05 | −0.03 | −0.14 | −0.15 | −0.01 | −0.02 |
| Baf. | −0.39 | −0.22 | −0.27 | −0.25 | −0.11 | −0.11 | −0.15 | −0.14 | −0.14 | −0.15 | −0.01 | −0.03 |
| Arctic | −0.62 | −0.39 | −0.01 | 0.04 | −0.27 | −0.28 | −0.07 | −0.03 | −0.31 | −0.37 | 0.18 | 0.19 |
3. Regional summer Arctic sea ice variations
The time series of summer SIA anomalies show the pronounced interannual and decadal variations (figure 2). However, there is less variability prior to the satellite era (except for Baffin Bay; Alekseev et al 2016, Connolly et al 2017), a significant part of which is due to a lack of high quality sea ice observations in the ETCW (Brennan et al 2020). The Beaufort, Chukchi, Laptev, East Siberian, Barents, Kara and Greenland Seas and the whole Arctic experienced a sharp shift from the positive phase to the negative phase between the 1930s and 1940s (figures 2(a), (b), (d), (e) and (g)), which is the same as the results of the reconstructed dataset from Alekseev et al (2016) and Connolly et al (2017). The Central Arctic exhibited a transition from negative to positive phase in 1952–1953 (figure 2(c)). The generally increasing SIA from mid 1940s until late 1970s only occurs in the Greenland Sea (figure 2(e); Pirón and Pasalodos 2016, Alekseev et al 2016, Connolly et al 2017). Except for the Central Arctic, the summer SIA has been generally decreasing since the late 1970s.
The summer SIA anomalies in most Arctic regions (except for the Central Arctic) have been, statistically, significantly decreasing since 1850 (figure 2 and table 1). The largest decreasing linear trend of −5.50% decade−1 (−0.011 × 10⁶ km2 decade−1) occurs in Baffin Bay. The Greenland Sea shows the smallest negative trend of −1.43% decade−1 (−0.0033 × 10⁶ km2 decade−1). A reversed trend toward increasing SIA in the Central Arctic over the 168 years is apparent. For the whole Arctic, the overall rate of change is −0.96% decade−1 (−0.17 × 10⁶ km2 decade−1) during 1850–2017.
The declining trend has accelerated since 1948 and more than doubled compared to the long-term trend (table 1) over the Beaufort and Chukchi Seas (−5.02% decade−1 (−0.15 × 10⁶ km2 decade−1), (Laptev and East Siberian Seas (−5.24% decade−1 (−0.10 × 10⁶ km2 decade−1)), Barents and Kara Seas (−12.26% decade−1 (−0.065 × 10⁶ km2 decade−1)) and Baffin Bay (−26% decade−1 (−0.052 × 10⁶ km2 decade−1)). The Greenland Sea trend has increased nearly sevenfold and exhibited the most rapid decline (−11.30% decade−1). In the Central Arctic, the 70 year (1948–2017) trend has translated into a statistically significant negative trend of −0.21% decade−1 (−0.015 × 10⁶ km2 decade−1). The decline in the whole Arctic has increased 1.7 times at the rate of −2.60% decade−1 (−0.46 × 10⁶ km2 decade−1) since 1948.
Most Arctic regions (except for the Greenland Sea) have experienced the highest reduction of SIA over the last nearly 4 decades, since 1979. During the 39 year period, the trends have more than doubled over the Beaufort and Chukchi Seas (−11.37% decade−1 (−0.34 × 10⁶ km2 decade−1)), Laptev and East Siberian Seas (−17.28% decade−1 (−0.33 × 10⁶ km2 decade−1)) and Barents and Kara Seas (−37.74% decade−1 (−0.20 × 10⁶ km2 decade−1)). The fastest decrease in SIA over the Central Arctic (−1.70% decade−1) is seven times faster than the trend for the 70 year (1948–2017) period. For the whole Arctic, the decline has reached −6.22% decade−1 (−1.10 × 10⁶ km2 decade−1)—more than double the 70 year trend.
The accelerated decline in SIA in recent decades was due to both dynamical forcing (such as positive Arctic DA whose associated anomalous meridional wind effectively advects sea ice out of the Arctic via enhancing the Transpolar Drift Stream (see figure 2 of Wang et al 2009)) and thermodynamical effect, such as temperature amplification (see figure 4.18 of Wang 2014). In particular, the Arctic amplification has been attributed to a number of mechanisms, namely, sea ice albedo feedback (Wang et al 2005, Screen and Simmonds 2010, 2014), temperature feedbacks (Pithan and Mauritsen 2014), external global warming (Min et al 2008), large-scale atmospheric circulation variability of the internal climate system (Ding et al 2017, Mewes and Jacobi 2019), changes to the radiation balance (Graversen and Burtu 2016) and enhanced surface fluxes (Boisvert et al 2015).
4. Association between summer Arctic sea ice and dominant climate variability
The Arctic SAT record (Morice et al 2012) in summer shows a sustained cooling phase over the first 70 years as the result of Kinnard et al (2011), followed by the ETCW (1920s–1940s). Then, the Arctic went through a slight cooling (1940s–1970s), followed by another period of warming (1970s-present; figure 3(a)). With the accelerated warming trend of 0.59 K decade−1 in recent decades, the air temperature has increased by 2.24 K since 1979. Except for the Central Arctic, the correlation with SIA is statistically significant and the coefficient with the detrended SIA is reduced more than 30% (table 2), indicating that change in SAT is a critical mechanism, actively contributing to the accelerated decline of SIA in the Arctic (Vinnikov et al 1999).

Figure 3. The standardized time series of climate indices. (a) Summer Arctic air temperature. (b) Summer AO. (c) Summer DA. (d) Winter NAO. (e) AMO. (f) Summer PDO. The orange lines are 39 year trends, the green lines are 70 year trends, the purple lines are long-term trends and the black lines are 9 year running means. The 'warming' and 'cooling' presents the positive and negative SAT anomalies over the most Arctic seas for different phase based on figure 4.
Download figure:
Standard image High-resolution image
Figure 4. The differences of composited SAT anomalies (unit: K) between positive and negative events (one STD) during (left) 1800s–2015, (middle) 1948–2015 and (right) 1979–2015 for (a) AO (a) and (b), DA (c) and (d), NAO (e)–(g), AMO (h)–(j), and PDO (k)–(m). The regions above 95% confidence level are stippled. Based on figure 3, all five teleconnections had simultaneous warming for most Arctic regions in the recent decades, contributing to the Arctic temperature amplification, in addition to the overall global/Arctic warming impact.
Download figure:
Standard image High-resolution image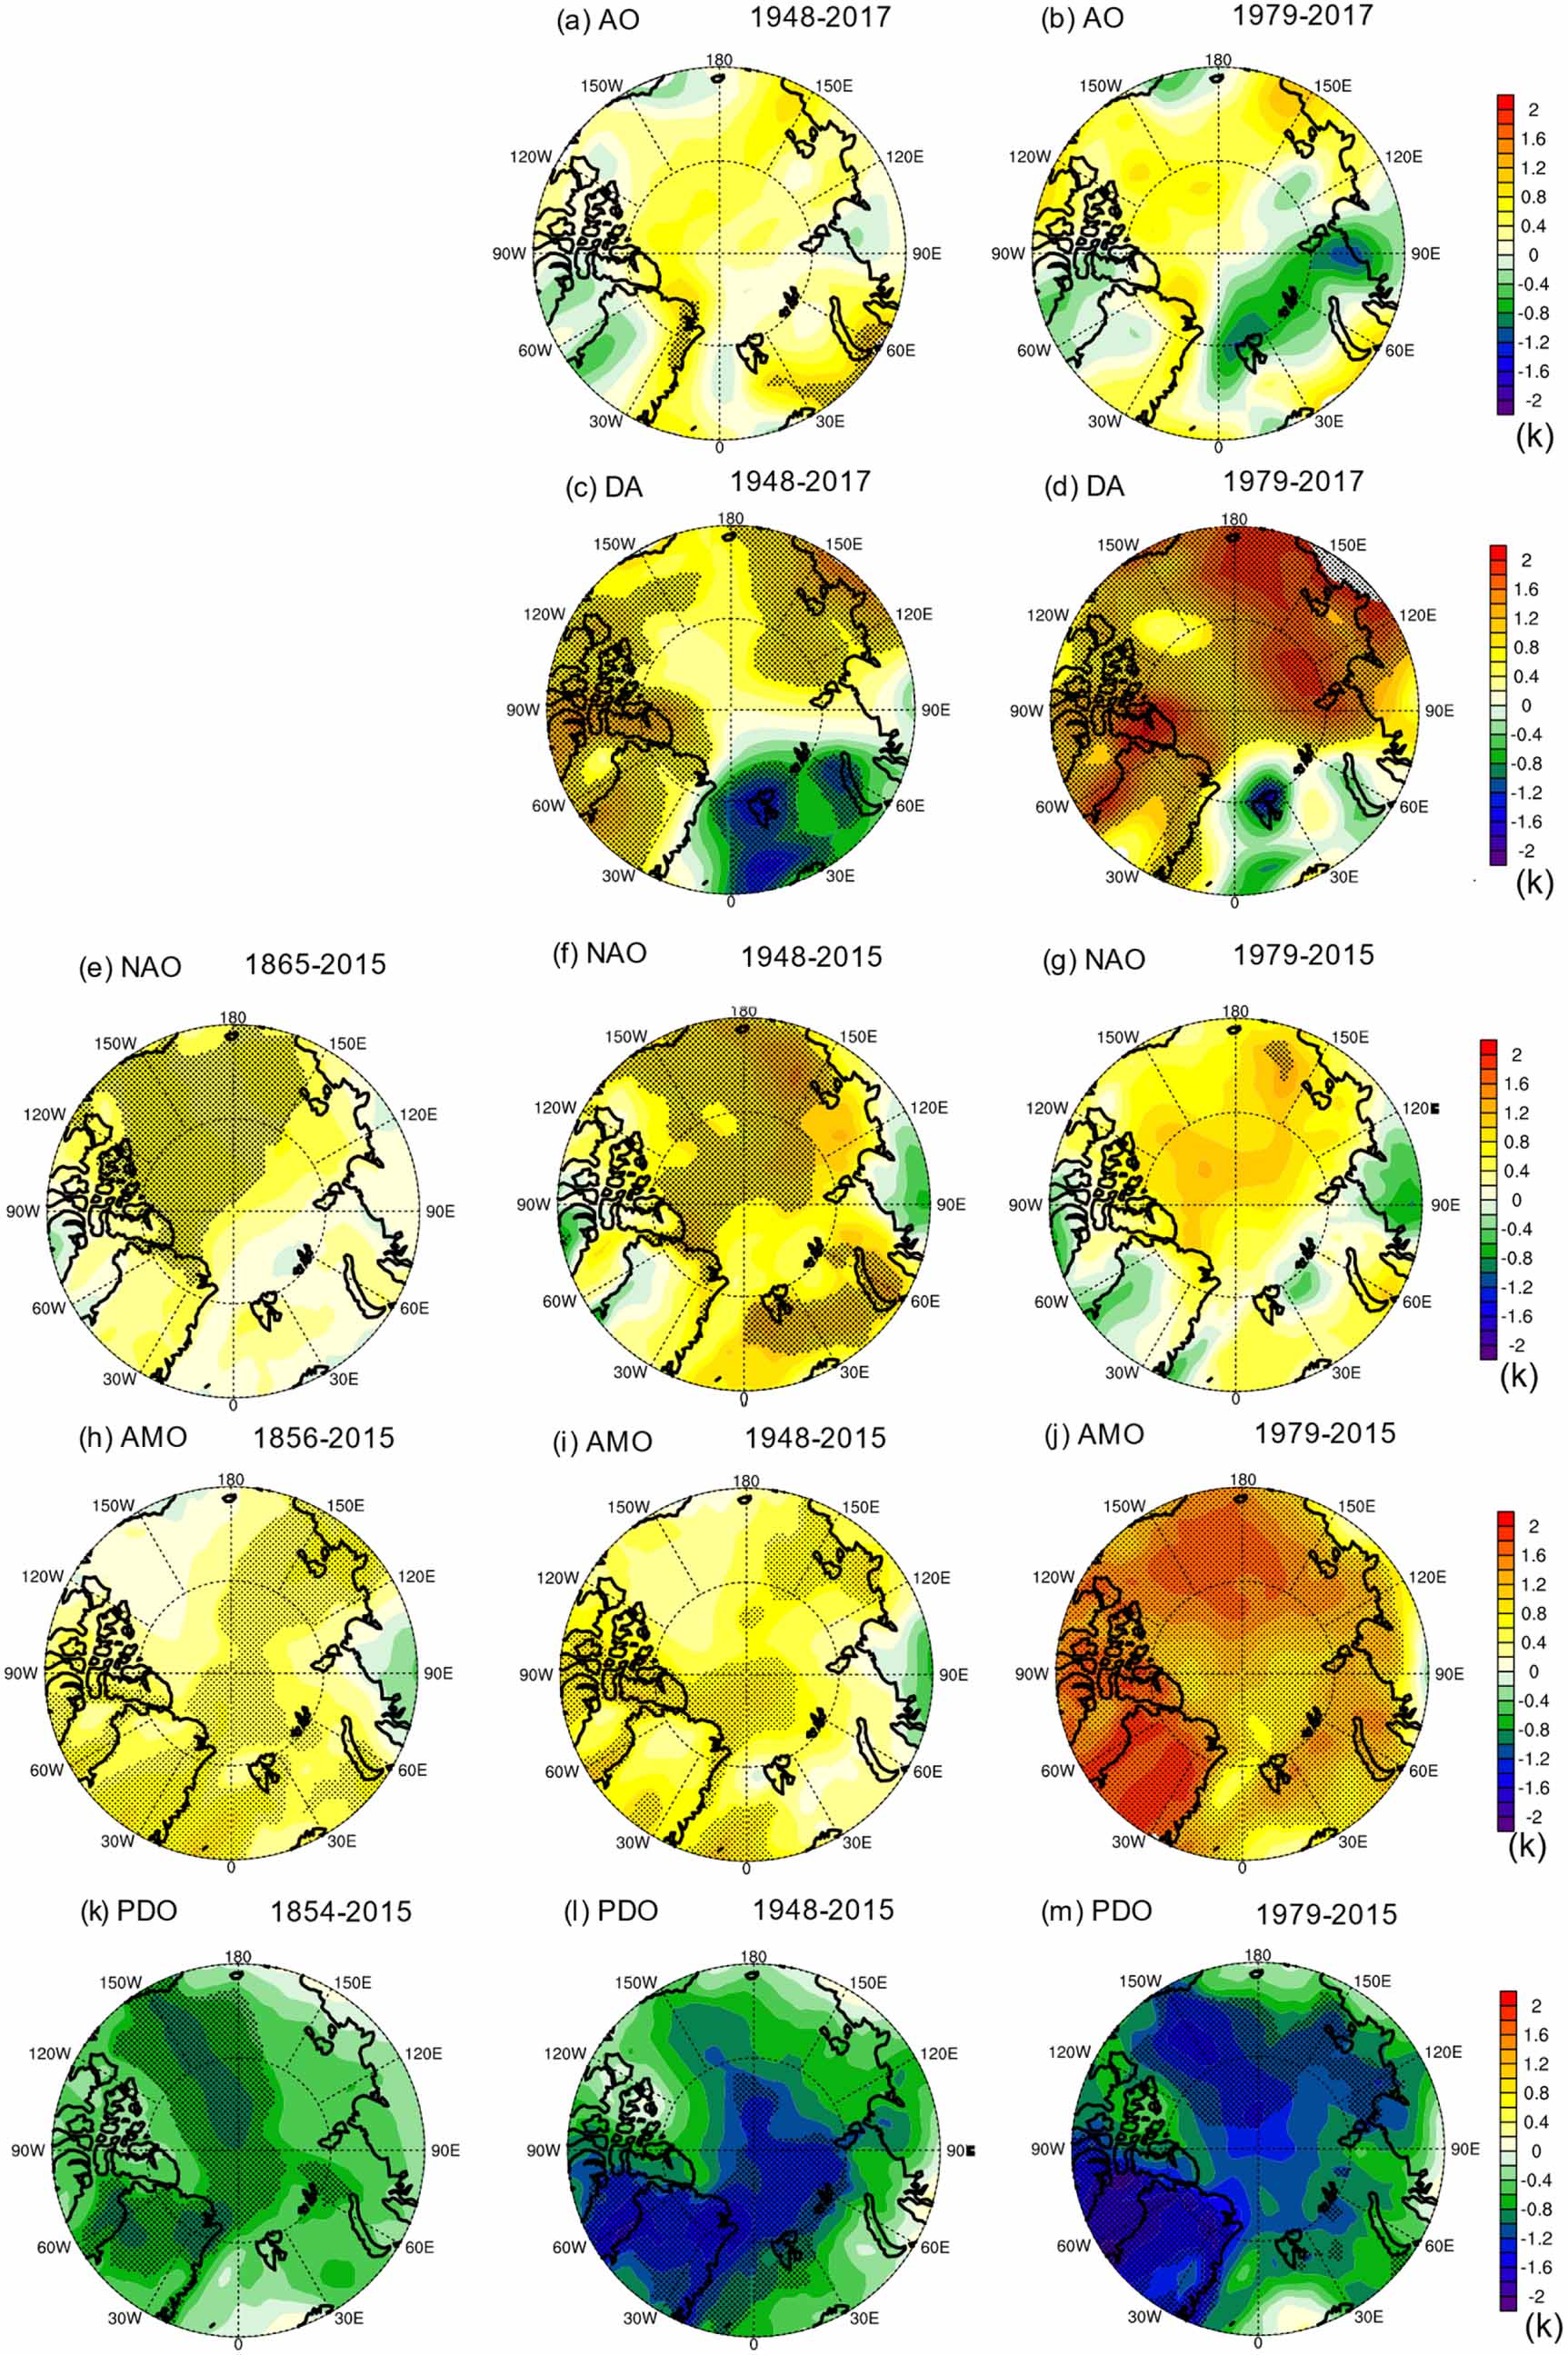
AO and Arctic DA are the first two leading modes of SLP anomalies in the Arctic (Overland and Wang 2005, Wu et al 2006, Wang et al 2009). In summer, both indices display large interannual and decadal fluctuations with weak increasing trend (figures 3(b) and (c)). AO (DA) shows higher correlation with SIA in the Atlantic (Pacific) Ocean (table 2). The correlation between summer AO and SIA becomes smaller in most regions after removing the long-term trend of summer SIA. However, the correlation between summer DA and the detrended summer SIA slightly increases in the Arctic regions. It indicates that DA has a much stronger relationship with the natural variability of SIA (Wang et al 2009) than the AO (Rigor 2002). DA (AO) has had a positive (warming in most Arctic regions) trend in the last two (four) decades (figures 3(b) and (c)), however the time span is relatively short compared with others.
NAO (Hurrel 1995) is one of the most prominent teleconnection patterns in all seasons (Livezey and Mo 1987, Gong and Luo 2017). The winter index exhibits considerable interannual variability and the increasing trend during 1948–2017 is more significant than that during 1865–2017 and 1979–2017 (figure 3(d)). It is found that the winter NAO shows relatively higher correlation with the summer SIA variations, and greatly weakens when removing the trend of SIA (table 2), which means NAO is well-related to the recent greater retreating rate of SIA in the Arctic. NAO underwent a positive (warming) trend in the last four decades (figure 3(d)).
The SST-based AMO index (Enfield et al 2001) provides a simple and concise way to describe Atlantic multidecadal variability. This long-term detrended record nearly covers two cycles, with increasing trend in the recent decades (figure 3(e)). After removing the linear trend from the summer SIA time series, the correlations become larger (table 2), which means AMO is better correlated to the natural variability of summer SIA. AMO has experienced the largest warming in the last two decades (figure 3(e)).
The PDO (Mantua et al 1997), as a long-lived pattern of Pacific SST variability, has a significant influence on the climate of the Arctic (Screen and Francis 2016). The summer index shows strong interannual and decadal variations with no significant long-term (1854–2017) trend (figure 3(f)). However, with recent, more negative values in the 21st century, there has been a downward trend since 1979. The correlation between the PDO and the detrended summer SIA has become larger in most regions (table 2), suggesting that PDO correlates with the natural variability of SIA. However, the small correlation coefficients suggest that summer PDO plays a relatively small role on the accelerated decreasing rate of SIA, compared to the summer AMO. PDO showed a negative (warming) phase in the last two decades (figure 3(f)).
To further highlight how the five teleconnection patterns impact Arctic SAT anomalies, composite analyses with Student's t-tests are used to confirm the significantly impacted regions. Figure 4 shows that during the positive phase of AO, DA, NAO, and AMO, and negative of PDO, the Arctic SAT experiences warming anomaly in most Arctic regions, and vice versa. DA, AMO and PDO have more significant (over 95%) impacts over the pan-Arctic, with AMO being most significant. Positive AO causes a relatively weak warming among all Arctic seas (figures 4(a) and (b)). It is noted that +DA, a local mode, causes warming in the Pacific and Central Arctic, and cooling in the Atlantic Arctic, and vice versa during −DA (figures 4(c) and (d)). Similar to the AO, during the positive NAO phase, the composite SAT shows warming anomalies among all Arctic seas (figures 4(e)–(g)). The positive AMO exhibits the overall Arctic warming (figures 4(h)–(j)). Negative (positive) PDO causes significant warming (cooling) along Baffin Bay. The amplitude became larger in the recent decades (1979–2015; figures 4(b), (d), (g), (j) and (m)), indicating the stronger positive phase of AO, DA, NAO, AMO and negative phase of PDO (see figure 3) simultaneously contributed to the Arctic amplification. However, we are cognizant that our results are based on fully statistical methods and that the understanding of the causal relationship requires dynamical modeling with coupled atmosphere–ocean–sea ice models, which remains an important topic for future research.
5. Conclusion
Using the longest (1850–2017) gridded sea ice data available, our study presents the long-term (168 year) trend in six Arctic regions and further compares the trends for the periods of 1948–2017 and 1979–2017, indicating that the declining trend has accelerated since 1948 and most Arctic regions (except for the Greenland Sea) have experienced the highest reduction of SIA over the last nearly 4 decades. This analysis suggests that the accelerated decline of SIA in recent decades was not uniquely driven by a single factor, but by a combination of global warming and internal variability of the climate system, particularly on the multidecadal timescales, which contributed to Arctic temperature amplification and anomalous atmospheric and oceanic circulation patterns over the pan-Arctic. The Arctic temperature amplification (Screen and Francis 2016) and oceanic and atmospheric dynamical and thermodynamical processes directly and indirectly accelerate the temperature feedbacks and the positive ice/ocean albedo feedback loop (Mysak et al 1990, Wang et al 2005, 2014), leading to the accelerating decline of summer Arctic sea ice.
Acknowledgments
QC thanks the National Key Research and Development Program of China (Grand Nos. 2016YFC1401800, 2016YFC1401409, 2016YFC1401405, and 2017YFC1404000). JW and JO appreciate support from NOAA GOMO Arctic Research Program. This is NOAA GLERL contribution number 1961 and CIGLR contribution number 1171. Funding was awarded to the CIGLR through the NOAA Cooperative Agreement with the University of Michigan (NA17OAR4320152). We appreciate Ms Nicole Rice of NOAA GLERL for editing this article.
Data availability statement
All data used in analysis available in public repositories. The sea ice concentration data is downloaded from http://nsidc.org/data/g10010, http://nsidc.org/data/G02202 and http://nsidc.org/data/G10016. The HadCRUT4 near surface temperature data set is from www.metoffice.gov.uk/hadobs/hadcrut4/data/current/download.html, 20CRv3 is from https://psl.noaa.gov/thredds/catalog/Datasets/20thC_ReanV3/Monthlies/catalog.html, NCEP1 SLP is from www.esrl.noaa.gov/psd/data/gridded/data.ncep.reanalysis.surface.html, NAO index is from https://climatedataguide.ucar.edu/climate-data/hurrell-north-atlantic-oscillation-nao-index-station-based, AMO is from www.esrl.noaa.gov/psd/data/timeseries/AMO/and PDO is from www.ncdc.noaa.gov/teleconnections/pdo/.
All data that support the findings of this study are included within the article (and any supplementary files).