

Abstract
Adaptation is a central component of climate policy, helping manage and reduce risks. Sometimes, however, adaptation to climate change may consume energy, threatening efforts to reduce greenhouse gas emissions. Examples are numerous, and include the use of air conditioning or water desalination. Nevertheless, no clear view exists on how energy demand globally can be impacted by climate change. In this paper we systematically map existing evidence on how and to what extent adaptation responses to climate change may impact energy demand. The literature is large, fast-growing and spans several disciplines, but we identify several research gaps. First, the literature focuses almost exclusively on heating and cooling demand, while overlooking other potential sectors. It also focuses heavily on a few world regions, while local specific climate and socio-economic conditions may highly influence the impacts, and focuses largely on average demand, while often disregarding peak energy demand. Finally, and most importantly, only a handful of papers—most of them with a specific geographical scope—consider that different adaptation possibilities may lead to different impacts on energy demand, which is an important prerequisite if the impact of adaptation on energy demand is to be lowered and maladaptation to be avoided. The reviewed papers study for the most part similar options, and most adaptation possibilities are conversely studied by just one or two papers.
Export citation and abstract BibTeX RIS

Original content from this work may be used under the terms of the Creative Commons Attribution 3.0 license. Any further distribution of this work must maintain attribution to the author(s) and the title of the work, journal citation and DOI.
1. Introduction/background
History has shown how harmful environmental changes can induce a society to take actions that reinforce the environmental problem (Rappaport 1977, Diamond 2004, Magnan et al 2016). Such 'maladaptation' has been identified with climate change: several adaptation actions consume energy, threatening efforts to reduce greenhouse gas emissions (Hallegatte 2009, Moser and Ekstrom 2010, Hallegatte et al 2011, De Cian and Wing 2019). Examples are numerous and include the use of air conditioning to deal with heat waves, desalination to cope with reduced freshwater availability, or artificial snowmaking in low-altitude ski resorts. Conversely, climate change impacts can also sometimes lead to a reduction in energy use, for instance when warmer temperatures reduce heating demand (De Cian and Wing 2019).
Understanding the impact of adaptation on energy demand is an important issue, both at a global scale and at a local scale. From a global perspective, it is a key question in order to assess the feasibility of GHG emission reduction pathways, as highlighted for instance in the IPCC Special Report on Global Warming of 1.5 °C (de Coninck et al 2018, De Cian and Wing 2019). Surges in energy demand due to adaptation may cause negative feedback loops in which climate change itself may make it more difficult to reduce GHG emissions. More generally, trade-offs and synergies between mitigation and adaptation have been identified as being a key issue for the IPCC AR6 report. In a budget constrained world, the balance between financing policies to mitigate climate change and policies to be adapted to climate change impacts is an acute question. Seeing some adaptation choices as a tool to remain on a low-carbon pathway is a central element in this balance: if planned adaptation may prevent future maladaptation and increasing energy demand, then adaptation financing may be considered a form of mitigation financing. Understanding the potential impacts of climate change adaptation on energy demand is also instrumental in tracking the global efficiency of adaptation policies: maladaptation is a major source of uncertainty in assessing global adaptation, e.g. for the Global Stocktake of the Paris Agreement in 2023 (Magnan et al 2016, Tompkins et al 2018; Berrang-Ford et al 2019).
At a local scale, it is also important to understand how climate change impacts and adaptation strategies can interact with local mitigation strategies (Grafakos et al 2020). Knowing what can be done to avoid potential future energy demand increases is a key question when designing a robust climate strategy (Viguie et al 2020). Conversely, anticipating potential energy demand reductions due to a changing climate is useful to be able to take gain from them. If extra energy demand in some regions appears difficult to avoid to prevent climate change impacts, renewable energy production should be planned for this. Anticipating this may help better designing long-term mitigation pathways.
Several review papers exist on the impact of climate change on the energy sector, but most of them study the other side of the impacts of climate change on energy, namely the impacts of climate change on energy supply, and especially renewable energy production (Mideksa and Kallbekken 2010, Cronin et al 2018, Craig et al 2018, Emodi et al 2019). This is different from our focus, as in this study we deal with the effects of climate change adaptation on energy demand.
Five review papers, all published between 2012 and 2014, examined the global consequences of climate change impacts on energy demand (Schaeffer et al 2012, Ciscar and Dowling 2014, Chandramowli and Felder 2014; M. Auffhammer and Mansur 2014, Dell et al 2014). However, all these papers focused only on one aspect of the issue, namely the impact of climate change on cooling or heating energy in buildings. They did not review other potential impacts of climate change on energy demand such as energy demand for desalination, artificial snow, tourism, fertilizers, etc. They concluded that large research gaps existed, especially in the consideration of more climate change scenarios (Schaeffer et al 2012), in the study of various adaptation possibilities (Ciscar and Dowling 2014), of heating and cooling in the industrial sector and not only in residential and office buildings (Auffhammer and Mansur 2014), and finally in the methodological approaches used (Dell et al 2014, Chandramowli and Felder 2014). They also concluded that the result of additional energy increases due to extra cooling and of energy decreases due to less heating would a priori lead to an overall global increase in demand, even if large variations would be observed locally. Since these papers were published, numerous other reviews have been conducted on the climate change impact on heating and/or cooling, and updated these results while maintaining the same conclusions (to cite a few: Li et al 2012, Salisu and Ayinde 2016, Santamouris 2016, Rydborg et al 2019, Mauree et al 2019, Andrić et al 2019a, 2019b). Among these papers, we note three systematic reviews, Mauree et al (2019), Andrić et al 2019b) and Andrić et al 2019a), which analyzed 187, 169, and 79 papers, respectively. In particular, Andrić et al (2019a) present a list of adaptation measures and review the extent to which they can impact energy demand. Similarly, the recently launched project EnergyA 7 , which aims at examining climate change impacts on energy demand, has produced several figures on climate change impacts on buildings and cooling demand (De Cian and Wing 2019, Van Ruijven et al 2019), even though its scope may a priori be larger in the future (Davide et al 2019).
In this study we examine all the current or potential effects of climate change adaptation on energy demand, including building energy for heating and cooling and other demands. Davide et al (2019) establishes a list of such potential impacts, and examines the extent to which adaptation actions listed in the nationally-determined contributions submitted in compliance with the Paris Agreement could affect energy use in other sectors than buildings. The only papers we are aware of that take an approach similar to ours are Wood et al (2015) and Wilbanks and Bilello (2014), but they only deal with impacts in the UK and in the USA, respectively, and do not provide a global overview.
To sum up, no systematic review exists on how global energy demand may be impacted by adaptation to climate change: the information is scattered. It is not obvious, for instance, which knowledge gaps exist, such as whether existing studies cover the full spectrum of potential energy demand increases. Moreover, it is not clear whether the geographical cover is exhaustive, and/or whether existing results can be translated into other geographical contexts. It is also not clear which climate scenarios and temporal resolutions have been covered, and most importantly, which range of adaptation pathways have been taken into account. Reflecting on these gaps, we undertake a systematic review of the effects of adaptation responses to climate change on energy demand, clarifying what has been covered or not, precisely identifying remaining knowledge gaps.
2. Methods/design
We conducted systematic mapping to identify and screen for papers studying cases where spontaneous or planned responses to climate change affects or may affect energy use, consumption, or demand. This process follows procedures outlined by Berrang-Ford et al (2015) and was guided by the checklist of Preferred Reporting Items for Systematic Reviews and Meta-Analyses (PRISMA) (Moher 2009). In the following sections we specify the protocol we used to build and select the literature corpus, extract the data, conduct the analysis and interpret the results. This protocol sets out to reduce the possibility of researcher bias, and to provide better transparency and reproducibility.
2.1. Research question and search string
A precise and detailed research question is a central component of a systematic review/mapping (Moher 2009). Here, our goal is to map the different potential or existing cases where 'climate change adaptation affects or may affect energy use, consumption, or demand'. The main challenge facing mapping literature on this issue comes from the choice of the definition of the word 'adaptation', which is inherently ambiguous, and therefore needs to be defined in our review (Ford et al 2015). What is of interest here is a broad definition, similar to what will be referred to as 'response to climate change' in the next IPCC report (AR6). We consider 'adaptation' being the resulting behavior of people (at the individual or collective level) when facing the effects of climate change. This point is important in the framing of the search query (see below), as a particular effort had to be devoted to the selection of words conveying this idea.
We reviewed the literature by conducting a systematic database search with a detailed search query. Two academic literature databases were used to ensure extensive literature coverage: Elsevier Scopus and Thomson Reuters Web of Science databases. We searched for publications in English, concentrating on scientific articles, book chapters and conference proceedings.
The following query was used:
((((('climat*' W/3 (chang* OR variabilit* OR impact* OR scenar* OR futur*)) OR 'global warming' OR 'futur* weather')) W/2 (adapt* OR respon* OR impact* OR effect* OR affect* OR implication* OR influence OR 'in the context of' OR considering OR incidenc* OR pressure* OR challenge* OR driv* OR under)) AND ((energ* OR electric*) W/15 (nexus OR consumpt* OR demand* OR usage* OR utilization* OR requir* OR consideration* OR expenditure* OR load* OR use)))
The query is composed of three main groups. The first reflects the concept of 'climate change'. The second—the largest group—reflects the concept of 'response [to climate change]', with the definition provided above. The third group reflects the concept of 'energy use'. This search query was built in an incremental process, based on a test list of relevant articles that the authors had identified, and on the relevant articles incrementally found with the queries previously tried. We also checked the coverage of the final search query by checking that references cited in seminal papers and in prior literature reviews related to the theme were included in the results (citation tracing).
We also searched for grey literature from different institutions that we identified as likely to produce reports on climate change shifting energy demand. We did different searches both on Google search engine and directly on institutions' websites. We searched the World Bank, the International Energy Agency (IEA), United Nations Environment Programme (UNEP), UN-Habitat, WWF, Greenpeace, Friends of the Earth, Organisation for Economic Co-operation and Development (OECD), European Union Energy Initiative (EUEI) and Climate Change Science Program (CCSP). We found possibly relevant documents from the World Bank, IEA, EUEI, CCSP, UN-Habitat and the Department of Sustainable Development Organization of American States. We also added one document from the French Observatory on the climate change effects (ONERC), and three research reports published in France (VURCA and MUSCADE and ADAMONT projects), which we knew to be relevant.
2.2. Study selection
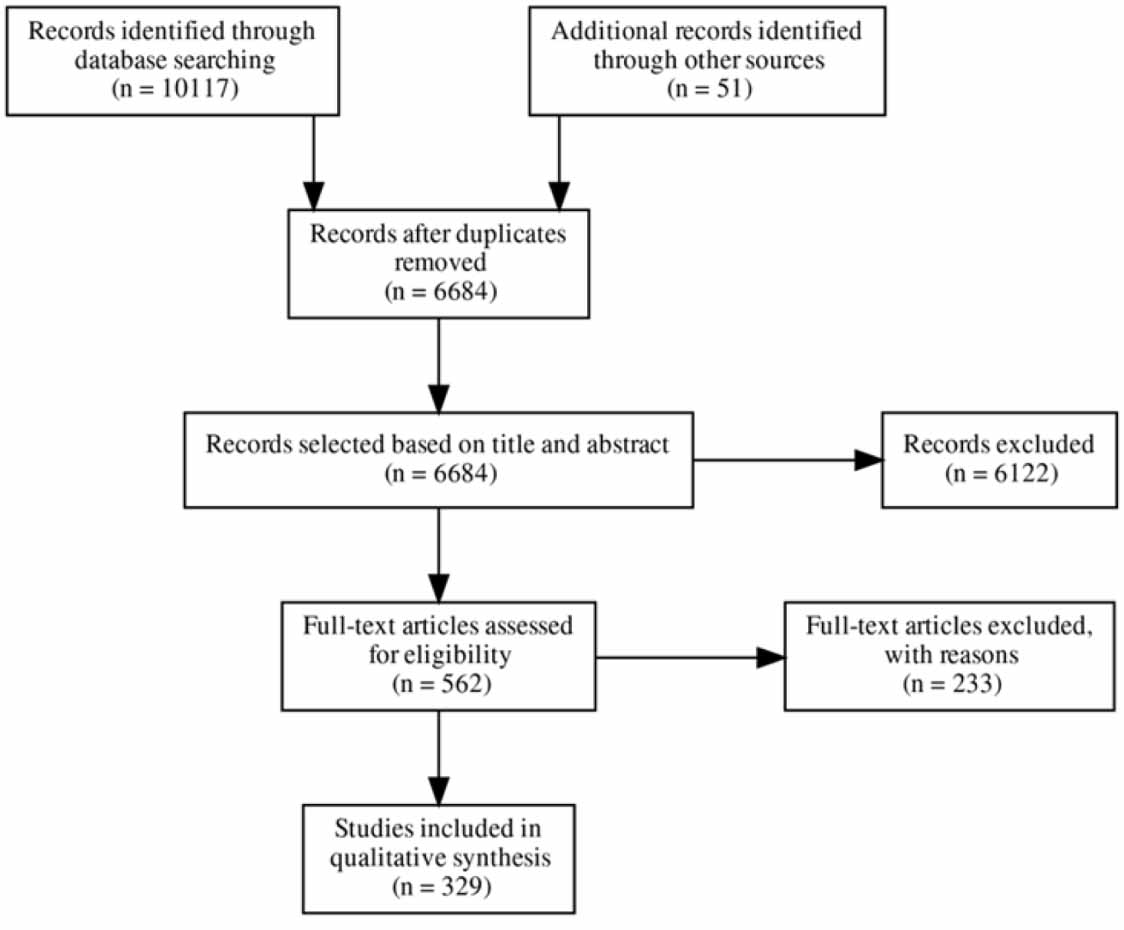
The database and grey literature search were done in Paris (France), on May 2nd 2019 and updated with Scopus database on November 11th, 2019. The search returned 10 117 papers in total, and 6684 after removing duplicates.
Not all papers were relevant, and we first excluded papers which were obviously out of scope based on their title (1266 papers selected). 8 We then checked for relevance based on the abstracts. This resulted in the selection of 562 papers. For robustness, more than half of the abstracts (randomly chosen) were screened by at least two different researchers (we used Abstrackr online tool (Wallace et al 2012) to carry this out). We excluded 233 publications after the full-text reading and finally found 329 publications being fully relevant at the end of the screening process. A synthesis of the whole process is shown in figure 1.
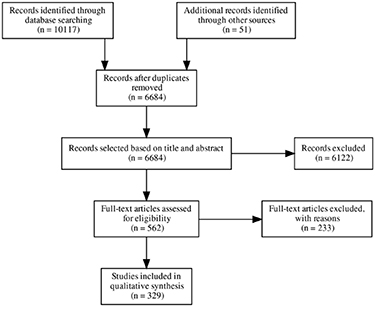
Figure 1. Prisma diagram.
Download figure:
Standard image High-resolution imageDuring this screening, we aimed at selecting papers which followed the following logic: 'climate changes can lead to changes in behaviors or choices by the population', and 'these changes can lead to changes in energy demand'. We therefore used the following inclusion and exclusion criteria:
- Candidate papers must deal explicitly with energy demand, consumption need or use by the human population (e.g. papers dealing with the metabolic energy demand of plants are excluded).
- Candidate papers must deal with climate change effects (e.g. papers about the impact of temperature on AC adoption and/or energy use are excluded if they do not specifically consider climate change scenarios; likewise for papers about current trends without explicitly considering climate change).
- Candidate papers must deal with the impact of climate change on energy (and not the other way around) (e.g. papers dealing with the impacts of energy consumption on climate change magnitude are out of scope).
- Candidate papers must deal with energy demand (e.g. impacts of climate change on renewable electricity production potential or physical impact of climate change on electricity transport network are out of scope).
2.3. Characterization of the selected articles and analysis grid
In order to extract relevant qualitative information from the publication, we designed the analysis grid shown in table 1. The adaptation actions or measures that we came across during full-text screening are listed in a supplementary database (note that we also included actions listed in papers excluded during full-text screening).
Table 1. Information gathered from the papers (analysis grid)
| Bibliographic information, publication metadata |
|
| Scales and geographic information |
|
| Scenarios and projections |
|
| Methodology and observations |
|
2.4. Databases and data management
We imported all bibliographic data and publication metadata directly from SCOPUS and Web of Science. We then attributed a unique ID for each article and built a SQLite database with different tables:
- A table containing the ID and bibliographic data of all the 6684 publications identified in our search and retained after removing duplicates, as well as their final status after screening.
- A table containing 6106 pieces of information gathered from the 304 publications reviewed (as one publication often studies multiple places, scenarios, projections, etc.). Each observation is linked to its publication by the unique ID.
- A separate table outlining all adaptation actions or measures reviewed, with links to the associated papers, flagging those providing quantitative estimates of impacts on energy demand.
3. Results
3.1. Which year were the papers published?
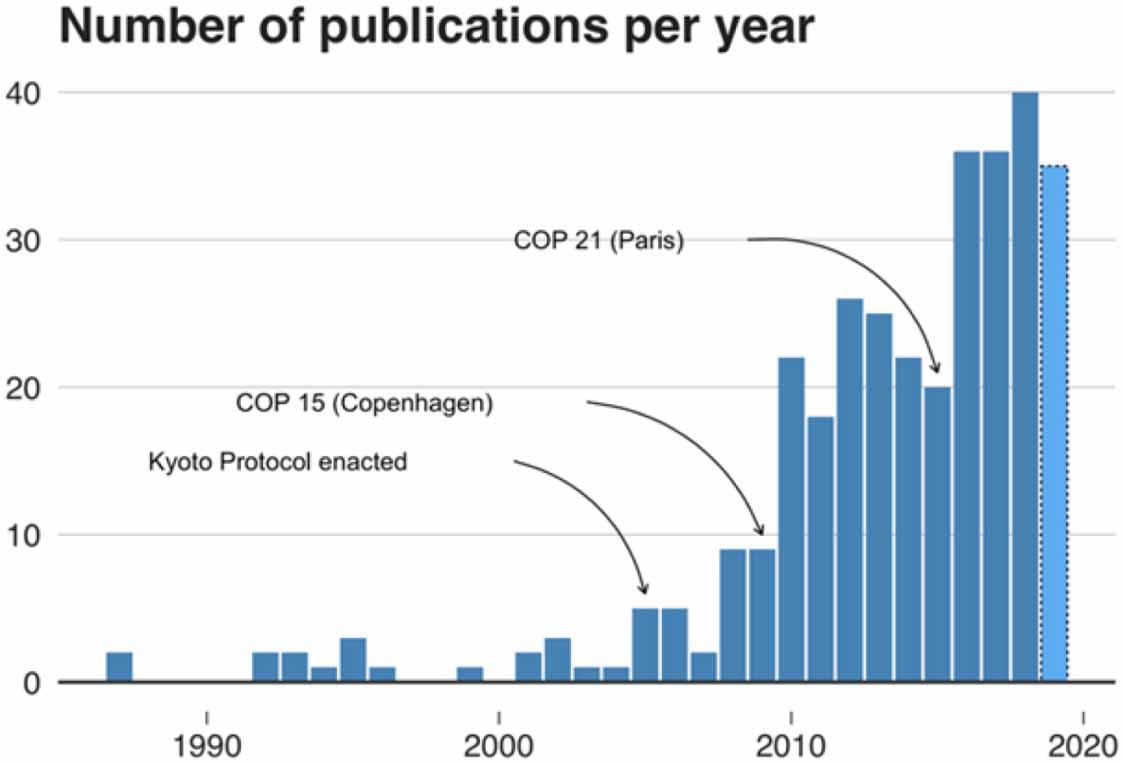
Figure 2 shows the date of publication of the papers (we stopped the selection on November 11th, 2019, so the year 2019 is incomplete). As can be seen on this figure, the number of publications dealing with our subject is sharply increasing over time, with more than 35 papers published each year between 2016 and 2019, compared to about 20 papers each year between 2010 and 2015, and fewer than 10 papers per year before 2009. Sharp increases can be observed in 2010 and 2016, just after the years of Copenhagen summit and COP 21 in Paris.

Figure 2. Repartition of the selected papers as a function of publication year. An increasing trend is visible, with significant increases in 2010 and 2016. Light blue line in 2019 present the number of papers until November, 11th 2019.
Download figure:
Standard image High-resolution imageOne of the reasons behind this trend is the fact that the overall number of papers published in climate change related literature is rapidly increasing globally. In order to test whether the increase shown in figure 2 is just a reflection of this global growth, we tried to evaluate the share of the papers on 'energy' or 'climate' that these papers represent. The result can be seen in figure 3, which shows the share represented by the paper that we selected in our review, relative to the total number of papers returned by a search on 'energy" OR "climate change' on Scopus for the same year. An increasing trend is still visible, showing that a larger share of climate change-related papers is each year related to the impact of climate change on energy demand.
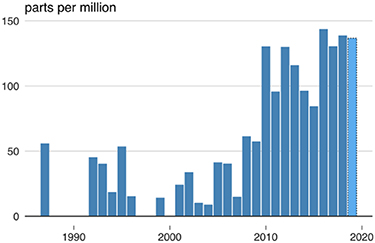
Figure 3. Share (in parts per million) of the total papers published on 'climate change" OR "energy' and which are selected in this review, as a function of publication year. Light blue line in 2019 presents the number of papers until November, 11th 2019.
Download figure:
Standard image High-resolution image3.2. How does adaptation to climate change impact energy demand ?
As stated in the introduction, climate change could impact energy demand in many different ways. Table 2 draws a tentative list of impacts (based on Wood et al (2015), Davide et al (2019) and the authors' expectations) and assesses their coverage in the reviewed papers. 9
Table 2. List of potential mechanisms through which response to climate change could impact energy demand, number of identified papers identified studying these mechanisms. (1) Mechanism mentioned in Wood et al (2015). (2) Mechanism mentioned in Davide et al (2019).
| Number of papers | Fraction of the papers | ||
|---|---|---|---|
| Heating and cooling of buildings | 277 | 80.30% | |
| Aggregated/unspecified | 42 | 12.20% | |
| Extra wastewater recycling to provide additional water supply | 9 | 2.60% | |
| Extra water pumping to provide additional water supply | 7 | 2.00% | |
| Water desalination | 3 | 0.90% | |
| Artificial snowmaking | 3 | 0.90% | |
| Water heating | 2 | 0.60% | |
| Extra infrastructure maintenance (e.g. road, railways) | 1 | 0.30% | |
| Heating of greenhouses for food production | 1 | 0.30% | |
| (1) | Extra energy to dry grains prior to storage because of wetter weather | 0 | – |
| (1,2) | Heating, cooling and ventilation for livestock | 0 | – |
| (1,2) | Variation in food storage heating, cooling and refrigeration | 0 | – |
| (1) | Extra field operations, fertilizer and pesticide use in agriculture | 0 | – |
| (1) | Air temperature impact on vehicles cooling and engine efficiency | 0 | – |
| (1) | Impact of climate change on global trade patterns and associated freight transport | 0 | – |
| Grey energy for the construction of flood defenses infrastructures(dikes) | 0 | – | |
| Grey energy for the reconstruction after natural disasters | 0 | – | |
| (1) | Impact of adverse weather events and increased temperatures on aviation fuel burn | 0 | – |
| (1) | Variation in energy demand for lighting in buildings (because of cloud cover variations) | 0 | – |
| (2) | Extra incentive to develop rural electrification and improve transport to cope with climate change impacts | 0 | – |
| (1) | Impact of climate change on tourism destination and related transport patterns | 0 | – |
| (1) | Opening up of the Arctic passageway provides a shorter route for ships | 0 | – |
| (2) | Increased awareness of climate change leading to behavior changes | 0 | – |
| Water pumping for flood prevention | 0 | – |
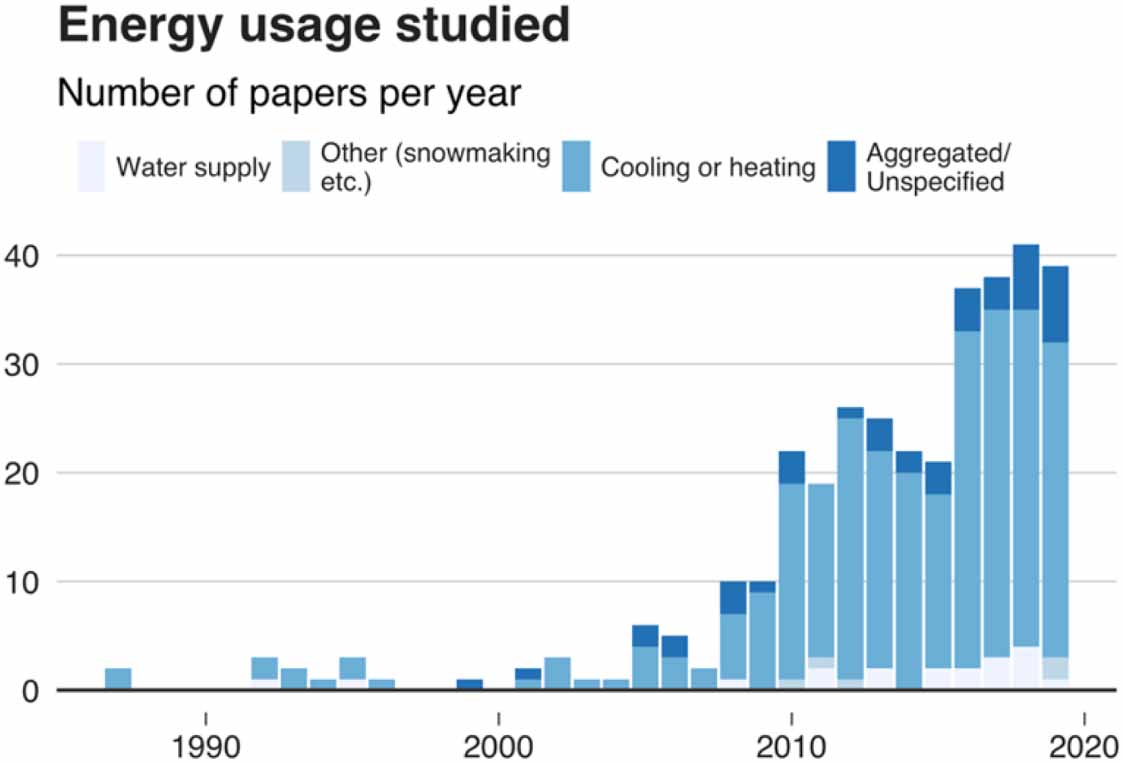
A majority of papers (80%, 277 papers) study variations in energy demand for heating and cooling in homes and office spaces. This figure may be even higher, as another 42 articles (12% of the selection) study aggregated energy demand variation (generally from top-down global approaches), which often actually mainly encompass energy demand for space heating and space cooling.
Amongst the papers focusing partly or entirely on heating and cooling, 230 study energy demand for cooling, 159 energy demand for heating, and 61 both. Other impacts of climate change on energy demand are only studied in a handful of papers. If we look at the number of case studies instead of the number of papers (one paper may contain several case studies, for instance by separately examining several cities or regions), the results are qualitatively the same (table 4 in appendix): other impacts of climate change on energy demand are only studied rarely.
Figure 19 (in appendix) shows the repartition of the papers each year, with respect to the energy use studied. No clear trend is visible: studies about heating or cooling seem to have always constituted a large part of the papers.
3.3. What places have been studied?
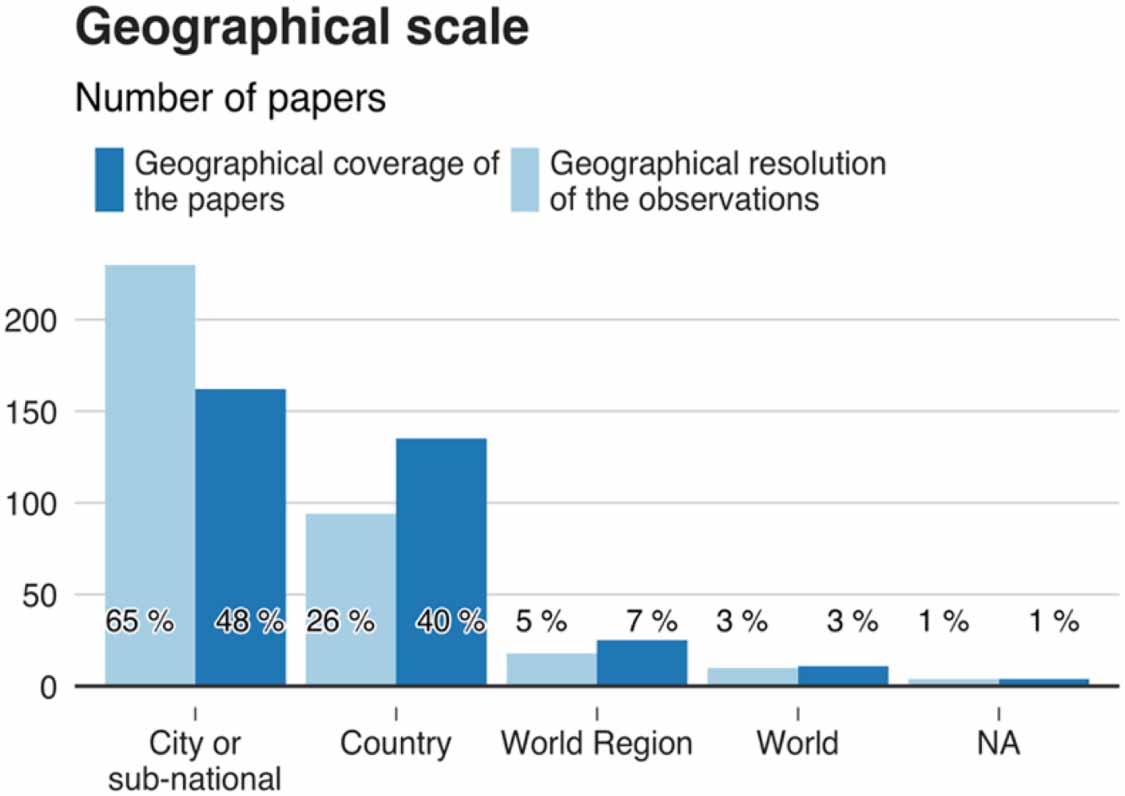
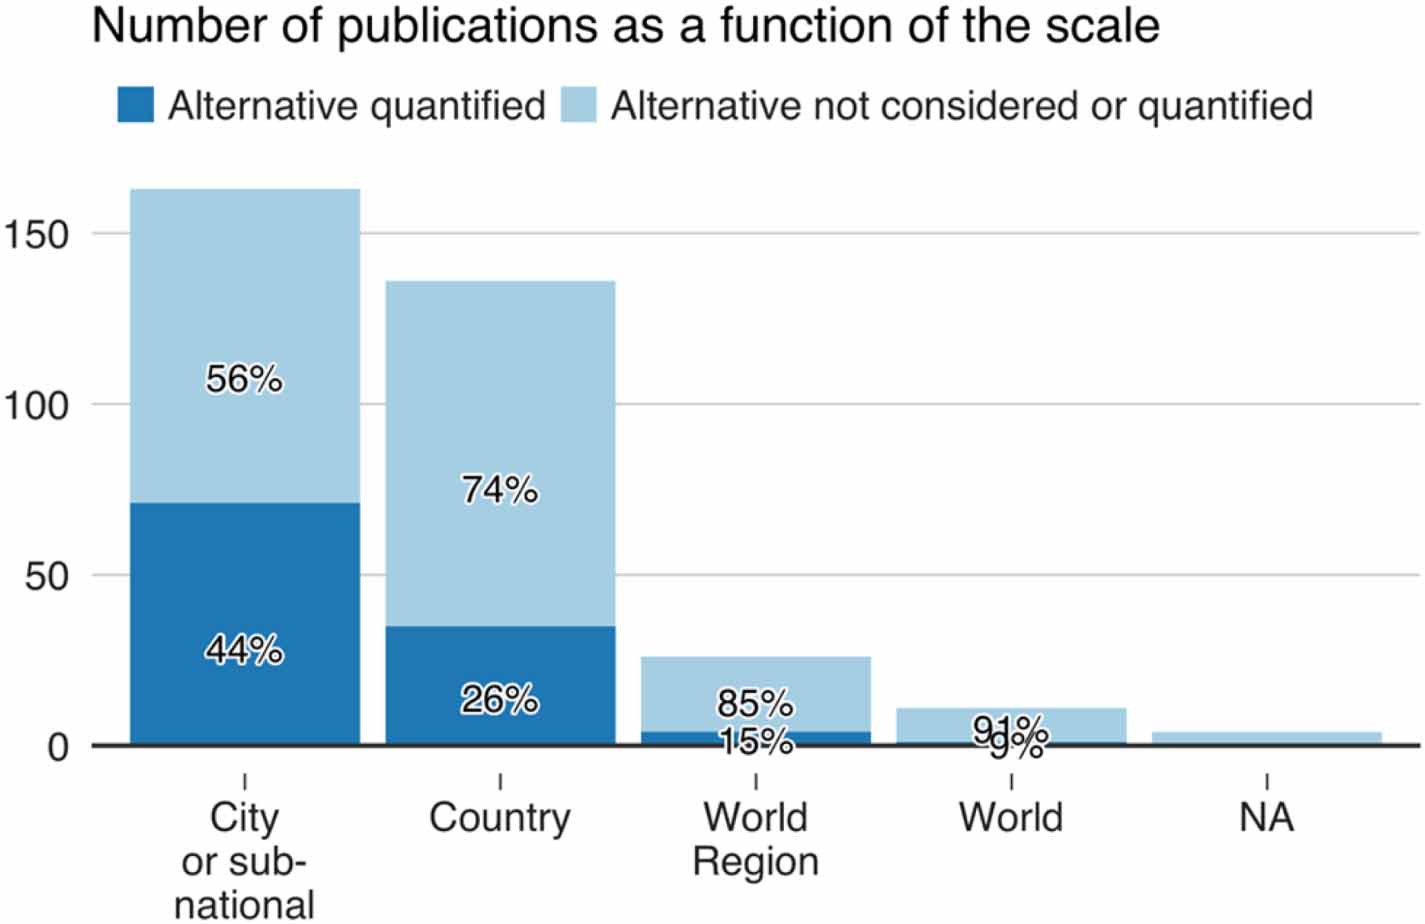
The papers have different coverages: they embrace different scales, from local, district level studies (see for example Giannakopoulos and Psiloglou 2006, Masson et al 2014, Waddicor et al 2016, Hooyberghs et al 2017) to global studies dealing with the whole world or large world regions (see for instance Labriet et al 2015, 2018a). The papers also use different resolutions. For instance, a paper may study a whole country by using aggregated country-wide data (for instance Parkpoom and Harrison 2008, Schweizer and Granger Morgan 2016), or by studying separately the regions inside the country (for example Zhou et al 2014, Mcfarland et al 2015). In the first case, the resolution of the paper will be the whole country, whereas in the second case the resolution will be the region. But both papers will have the same country-wide coverage. In figure 4 we present the distribution of papers as both a function of their geographical coverage, and a function of their spatial resolution.
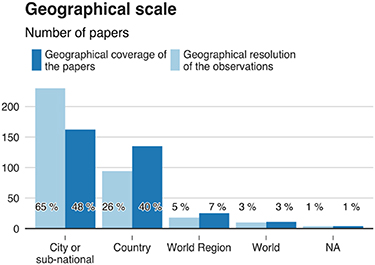
Figure 4. Geographical resolution of the observations and geographical coverage of the papers. A paper whose unit of study is a city, but which studies multiple cities in a given country will have a 'country' geographical coverage but a 'city' geographical resolution.
Download figure:
Standard image High-resolution imageAs can be seen in figure 4, both the geographical coverages and the geographical resolutions are widely different across the papers. Almost half of the papers (48%) have a geographical coverage of a whole country or a larger zone (the world or a world region). Conversely, approximately two thirds of the papers (65%) have a geographical resolution smaller than a country (e.g. states, provinces or cities) and only a quarter (26%) rely on data at country scale.
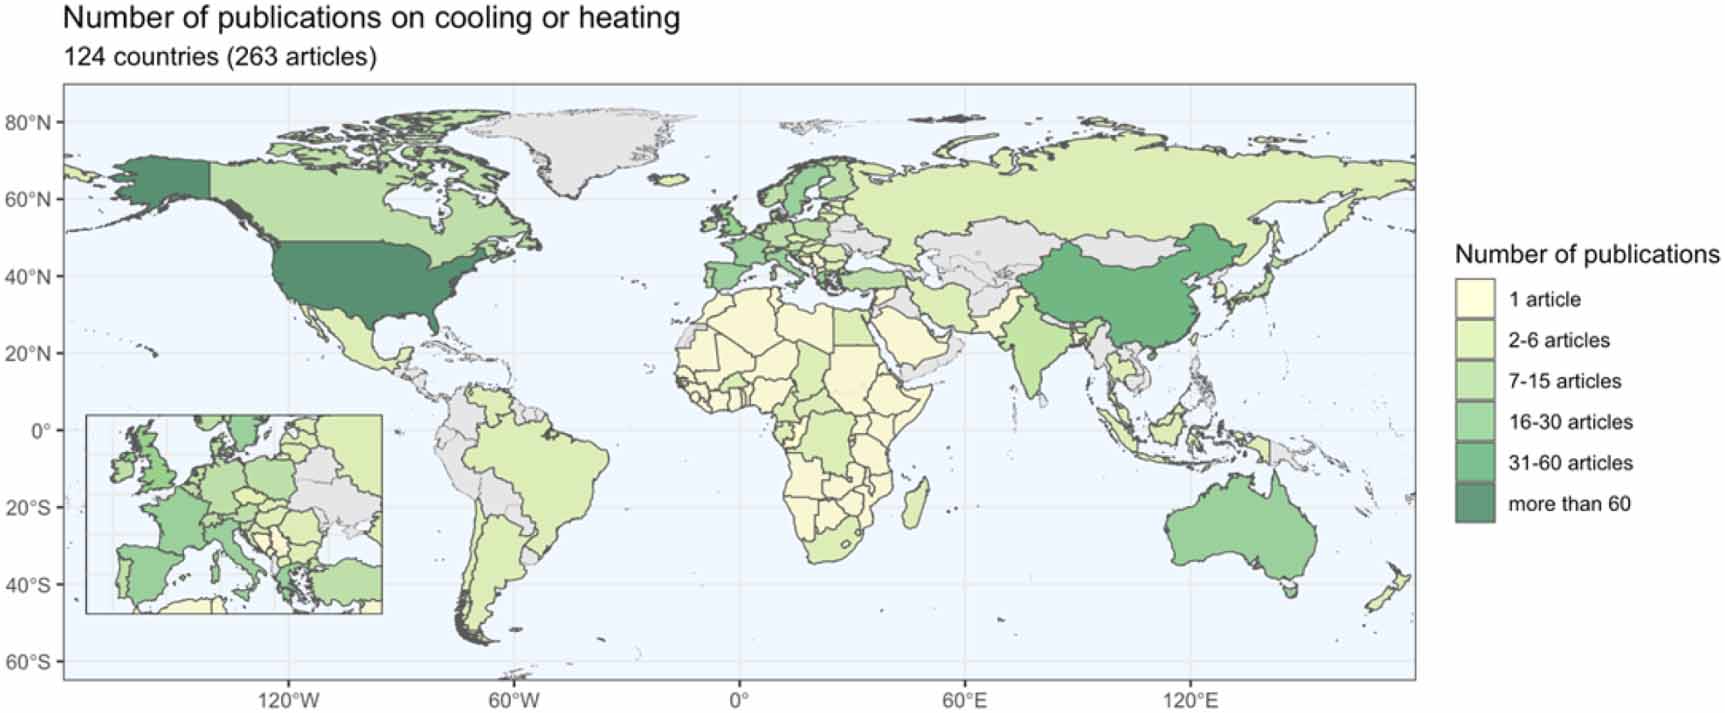
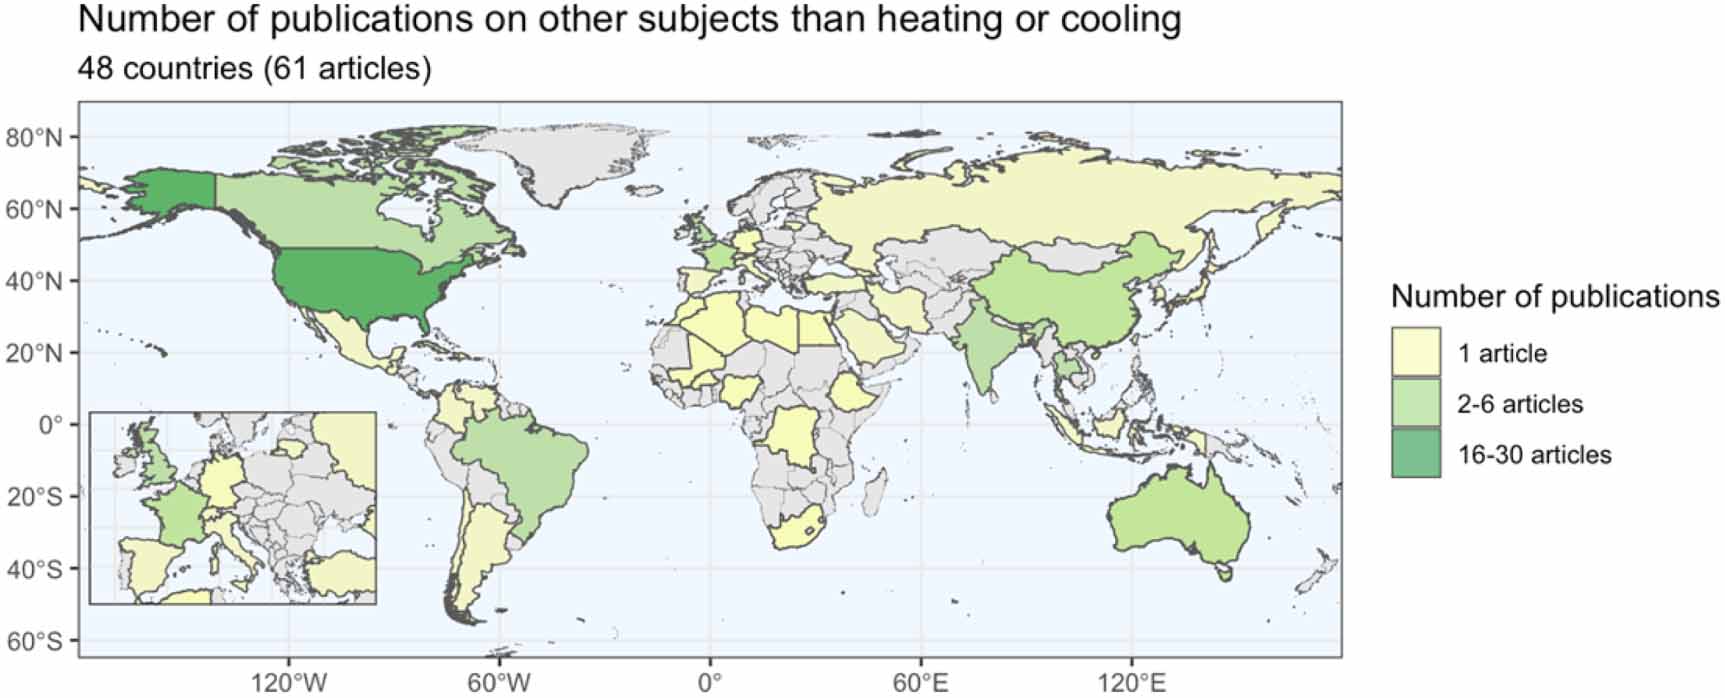
Figure 5 and figure 6 are maps of the locations studied in the papers, showing the number of papers studying a given country or a sub-national location inside it. Energy demand for heating and cooling has been studied in almost every country, the exceptions being mainly Central Asia and Northern Latin America. However, the number of articles per country varies widely. Most African countries have been studied by only one paper (Kahil et al 2018a), whereas 67 papers study the USA and 35 study China. The same pattern appears for the papers studying other subjects than heating or cooling, with, relatively, an even more extreme emphasis on the USA (26 papers, to be compared to 7 on China, the second most studied country) (see figure 6).

Figure 5. Number of papers studying cooling or heating in each country (either the whole country or a sub-national location inside).
Download figure:
Standard image High-resolution image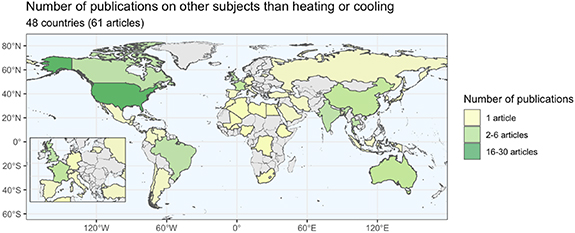
Figure 6. Number of papers studying other sectors than heating or cooling in each country (either the whole country or a sub-national location inside).
Download figure:
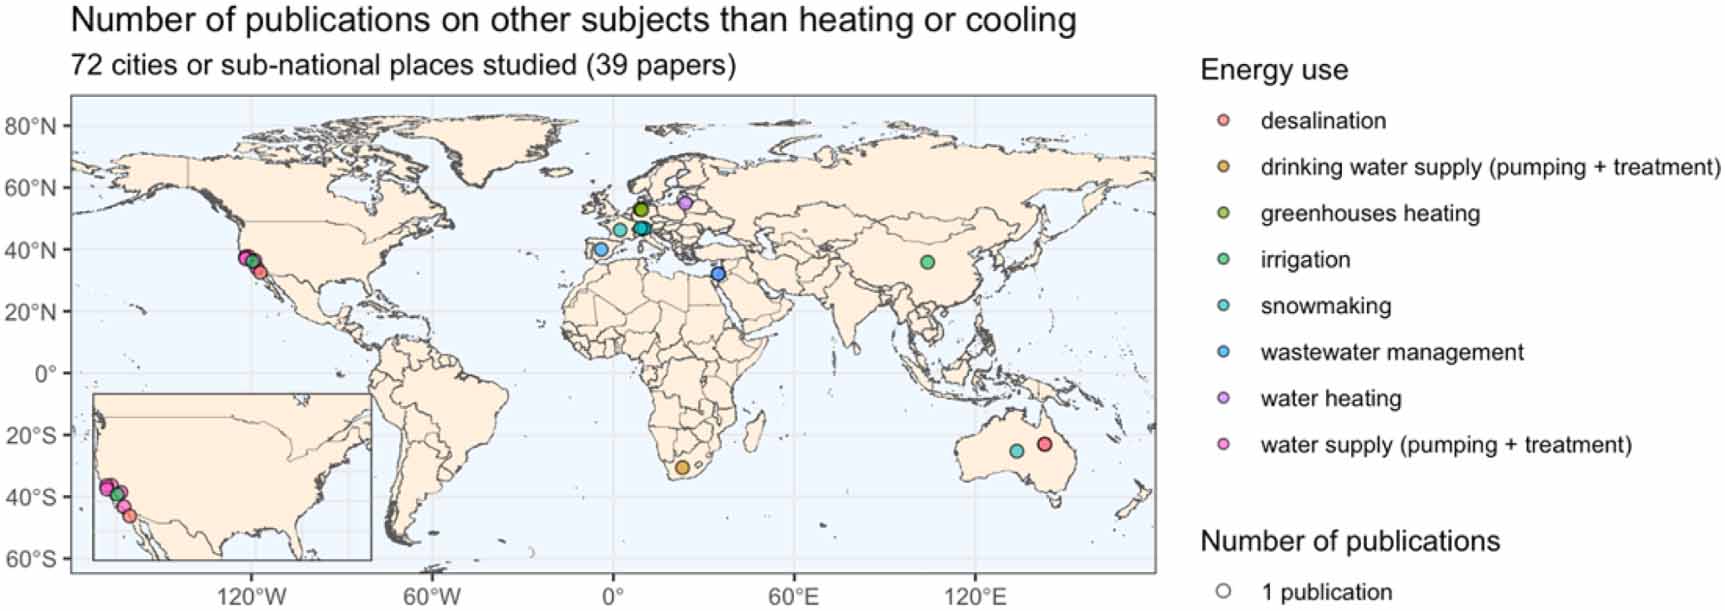
Standard image High-resolution imageAs most papers use data with a sub-national resolution, it is also interesting to look at the precise locations of the sub-national places studied. Figure 7 and figure 8 show maps of these locations. Figure 7 is for papers about heating or cooling, and figure 8 for papers on the other subjects. Studies on heating or cooling concentrate on USA, Europe, Eastern China and South-Western Australia. Almost no localized study examines Africa, India, or South America beyond Chile, Argentina and Mexico.
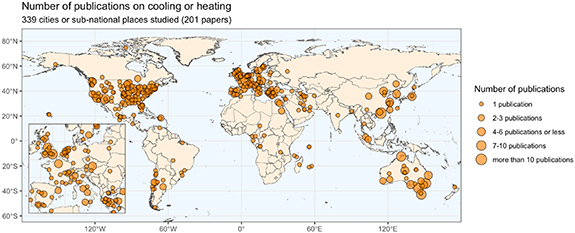
Figure 7. Number of studies on sub-national locations (heating and cooling).
Download figure:
Standard image High-resolution image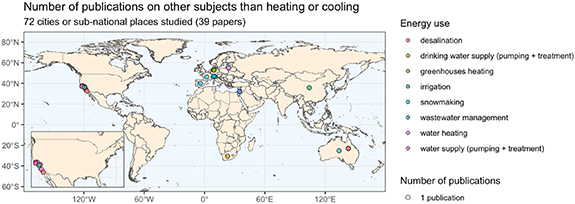
Figure 8. Number of studies on sub-national locations (other sectors than heating or cooling).
Download figure:
Standard image High-resolution imageThe pattern is different for studies focusing on usage other than heating and cooling: California has been by far the most studied area, with a strong focus on water issues. A few studies focus on Europe (for instance Flechsig et al 2000 studies wastewater in Spain; Gi et al 2018a, Sabunas and Kanapickas 2017 study water heating, among other questions; Hoffmann and Rath 2012 studies greenhouses heating; Spandre et al 2019 studies snowmaking), one on China (Yan et al 2018 about irrigation) and two on Australia (Mushtaq et al 2013 about irrigation; Pickering and Buckley 2010 about snowmaking).
It should be noted that, as it is common with systematic reviews, there may be a potential language bias in these results (see for instance Neimann Rasmussen and Montgomery 2018). Indeed, putting aside four reports in French that the authors knew to be relevant, we only reviewed here the academic and grey literatures in English.
3.4. Which climate change scenarios were considered to study the impacts ?
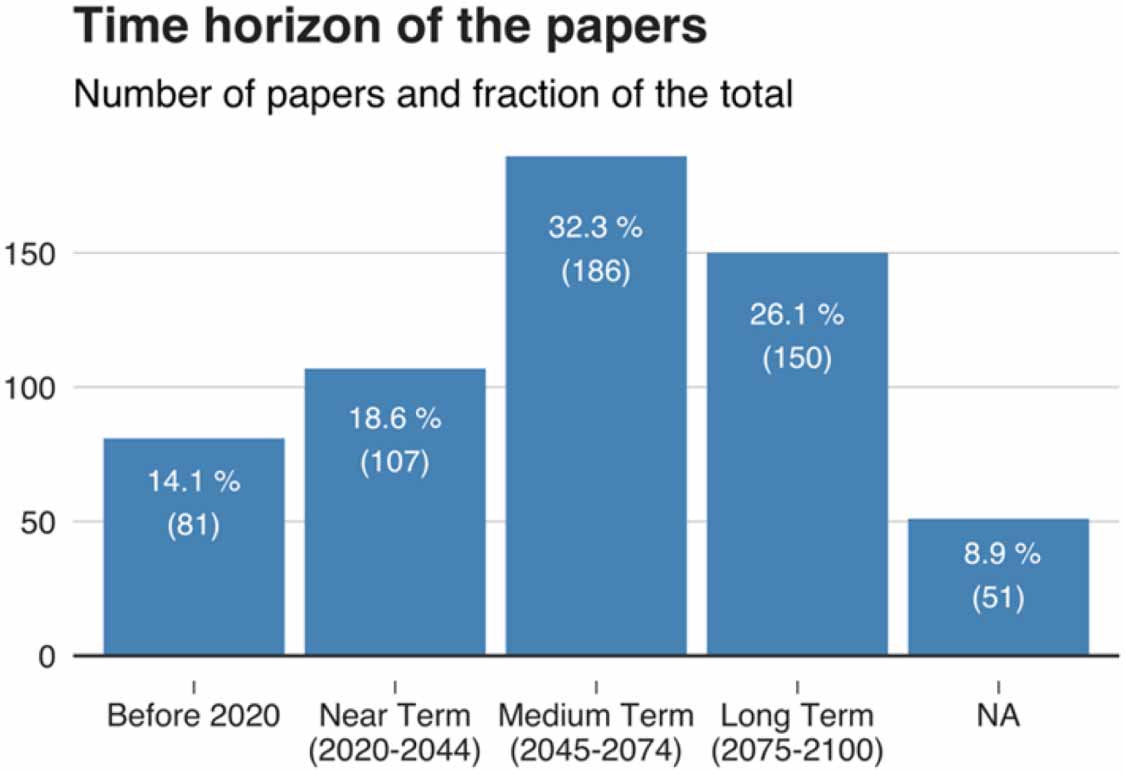
32% of the studies examine the medium term (around 2050), 19% the near term and 26% the long term (figure 9) (a paper can examine different time horizons, in which case we consider that it includes several studies). A few papers consider time horizons that were in the future at the time of publication but which are now in the past (see for instance Rosenthal et al 1995).

Figure 9. Time horizon of the papers.
Download figure:
Standard image High-resolution imageSeveral climate scenarios are studied, and we grouped them in four categories: Low (climate scenarios corresponding to +2 °C globally), Medium (scenarios leading to between about +2 °C and +4 °C globally), High (+4 °C or more globally), and Other (no information, or impossible to connect with a global scenario). The distribution of scenarios studied is rather mixed (figure 10). Whereas only a minority of papers (15%) study low climate change scenarios, about one third study medium and one third high scenarios. We provide more details in the appendix.
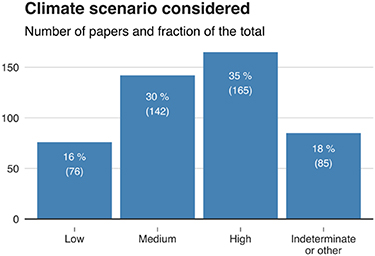
Figure 10. Climate scenario considered.
Download figure:
Standard image High-resolution image3.5. Was averaged or peak demand studied?
The variation in demand due to climate change may a priori not be homogenous over time, and this may be of importance for energy providers, especially if one wants to also take into account the impact of climate change on renewable energy production.
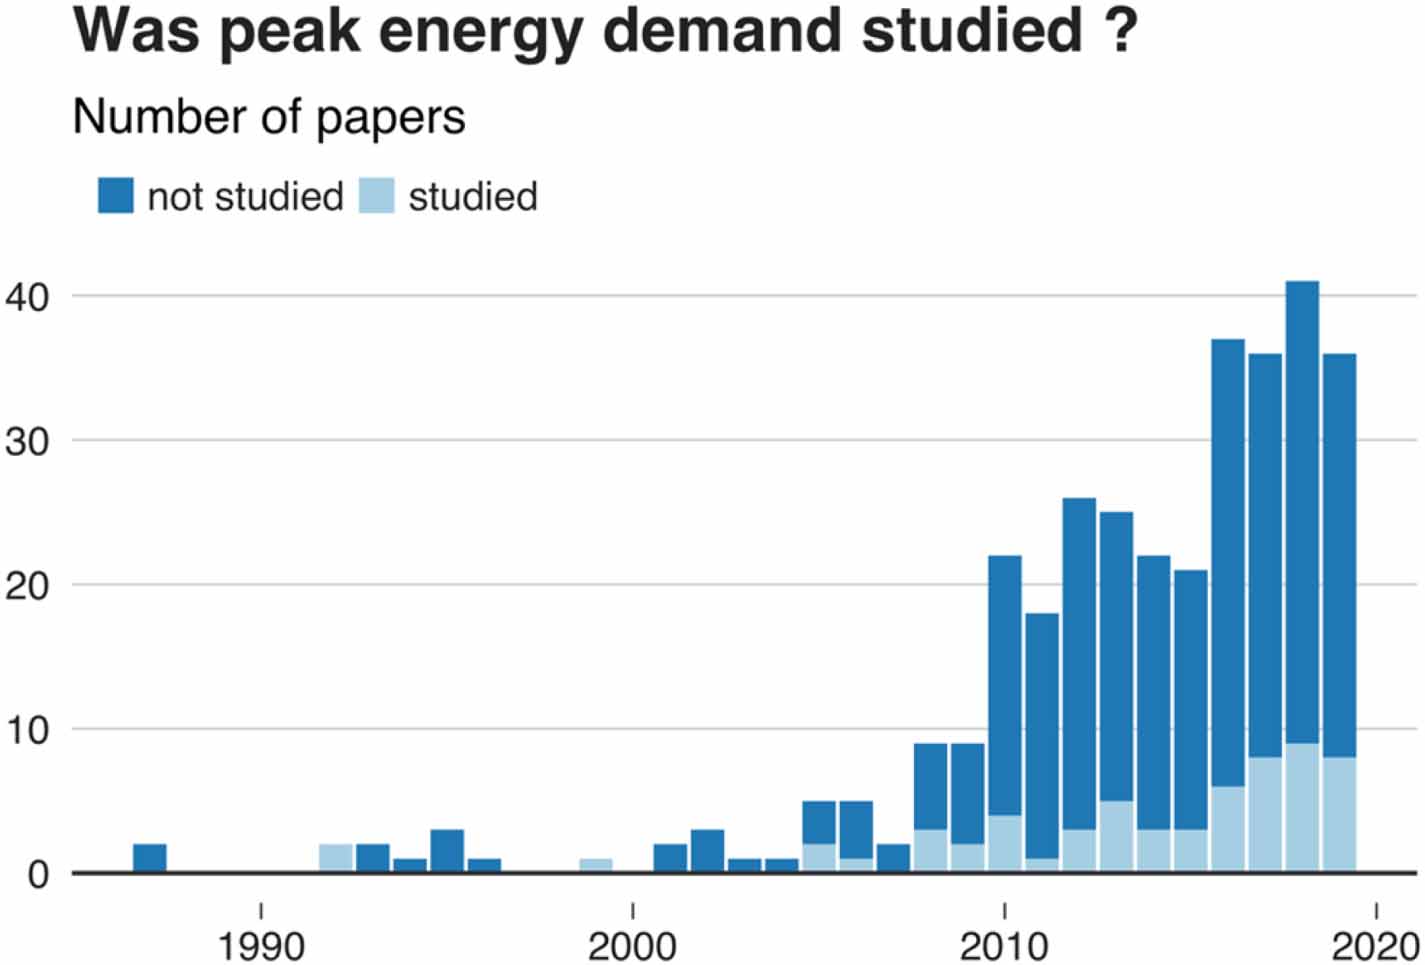
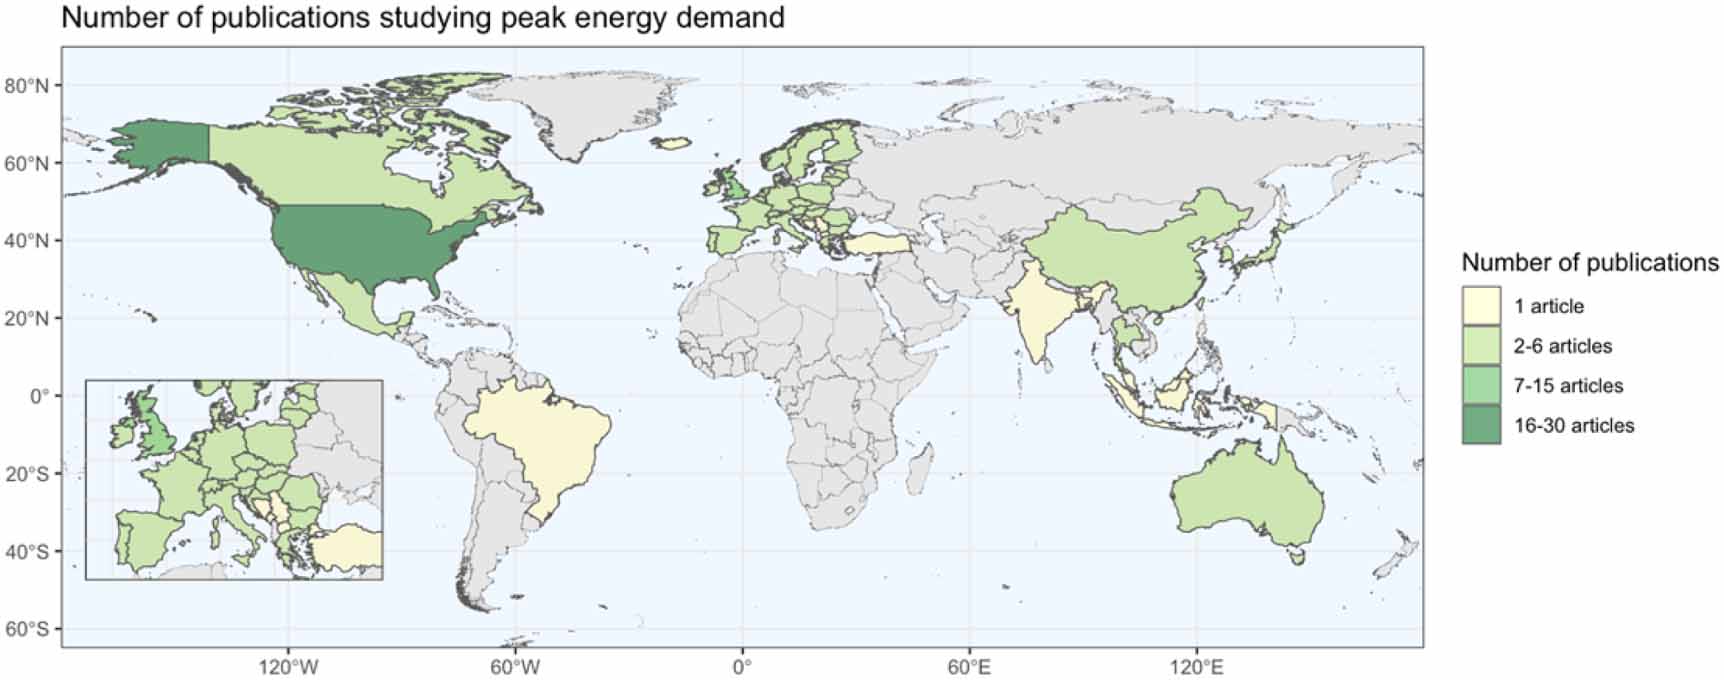
Fewer than 20% of the papers reviewed explicitly consider, beyond average, peak energy demand 10 (see for example Baxter and Calandri 1992; Colombo et al 1999; Hamlet et al 2010; Damm et al 2017; Maximilian Auffhammer et al 2017). Moreover, the fraction of these papers in the literature does not show any increasing or decreasing trend over time (figure 11). Almost all papers studying peak energy demand focus on Europe or the USA (figure 20 in the appendix).

Figure 11. Evolution of the number of papers studying peak energy demand.
Download figure:
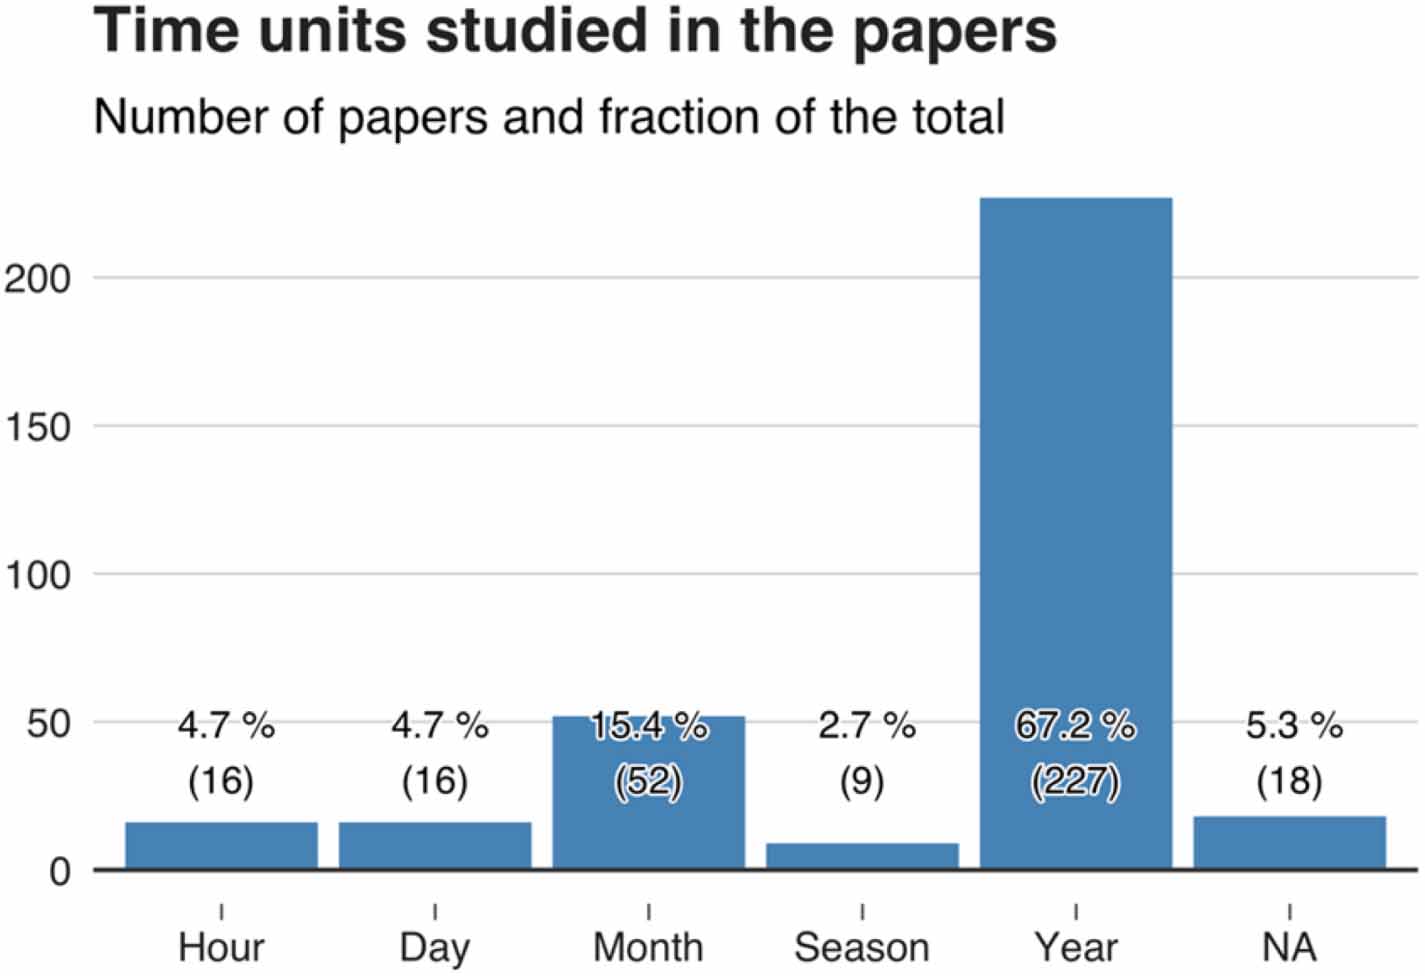
Standard image High-resolution imageThe papers of our sample study different time units, from hourly analyses (such as Conry et al 2015) to yearly averages (such as Gaterell and Mcevoy 2005; H. Wang and Chen 2014). The majority of papers—more than two thirds—study annual averages, and only a few deal with hourly, daily or monthly data (figure 12).

Figure 12. Time units studied in the papers. Note that one paper may study different time units at the same time.
Download figure:
Standard image High-resolution image3.6. Which methodology has been used to analyze climate change impact on energy demand?
We classified the methodologies used in the papers into four groups: Building energy models, Econometric/statistical models, Integrated models (coupled techno-economic models), and Others (qualitative studies, for instance). Building energy models make only sense for studies dealing with air or water heating and/or cooling, whereas the other methodologies may be used for all the subjects.
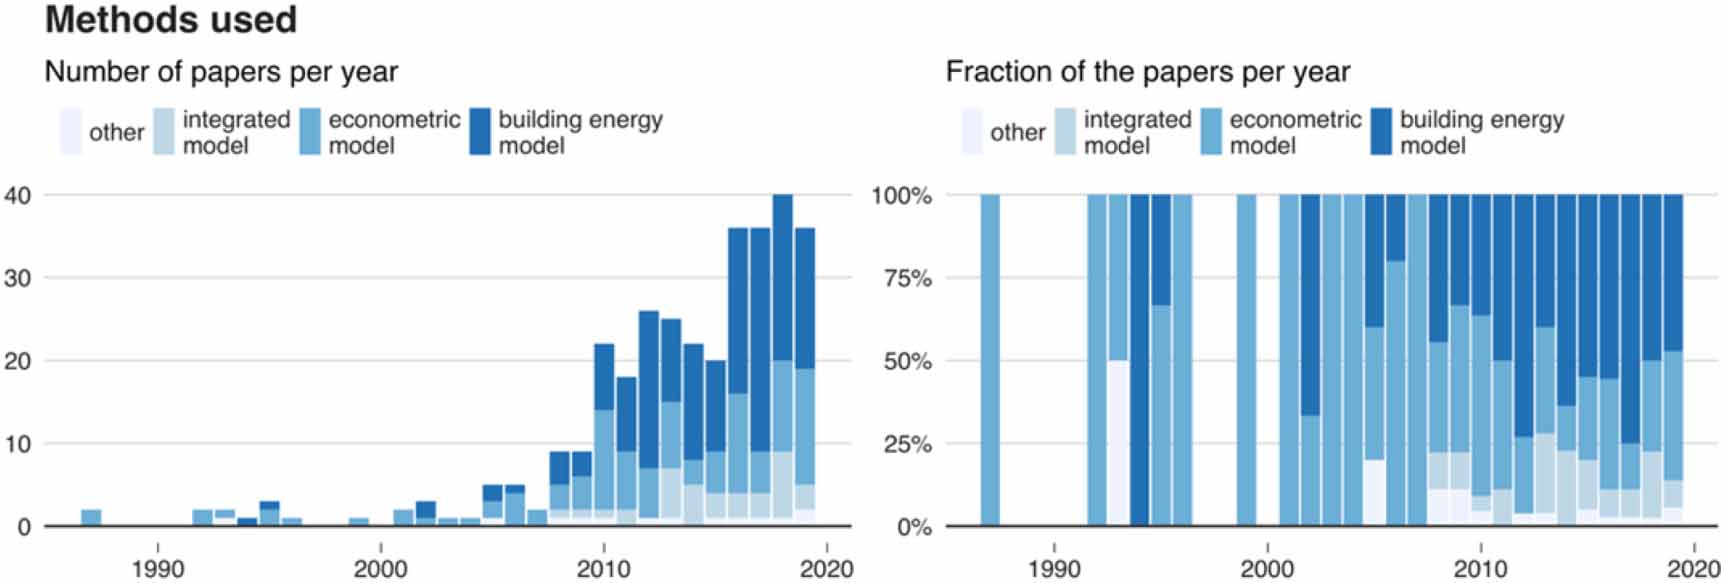
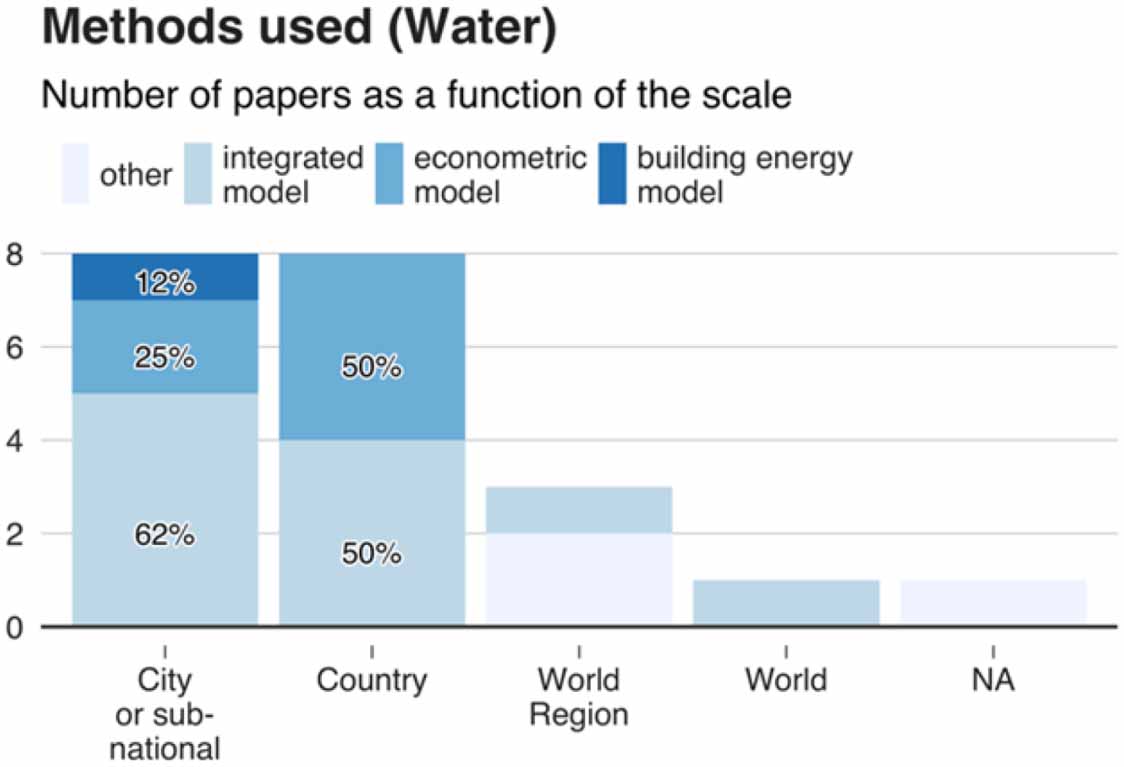
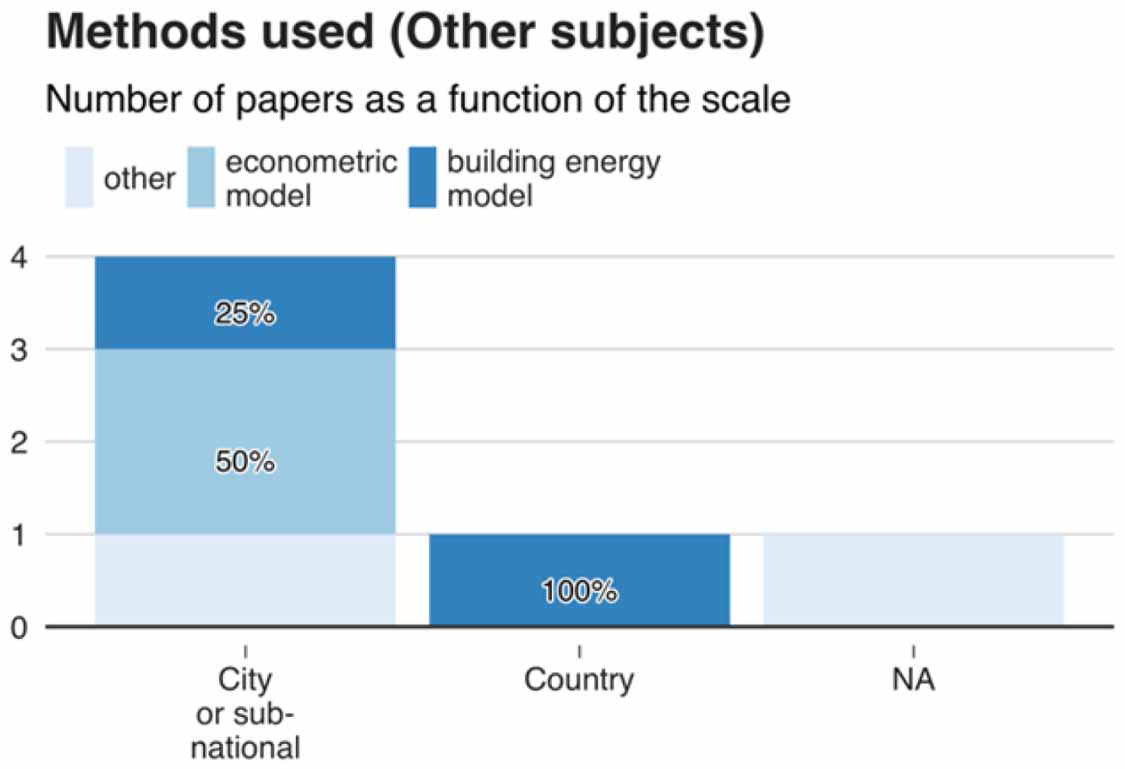
The methods primarily used in heating and/or cooling studies are building energy models (more than half of the studies) and econometric models (about a third). Integrated modeling represents about 10% of the publications (See figure 13). This, as would be expected, is different on other subjects, as the integrated models represent for instance a large part of studies on water related energy demand. Econometric models are used in a significant share of studies, whatever the subject.

Figure 13. Methods used in the papers.
Download figure:
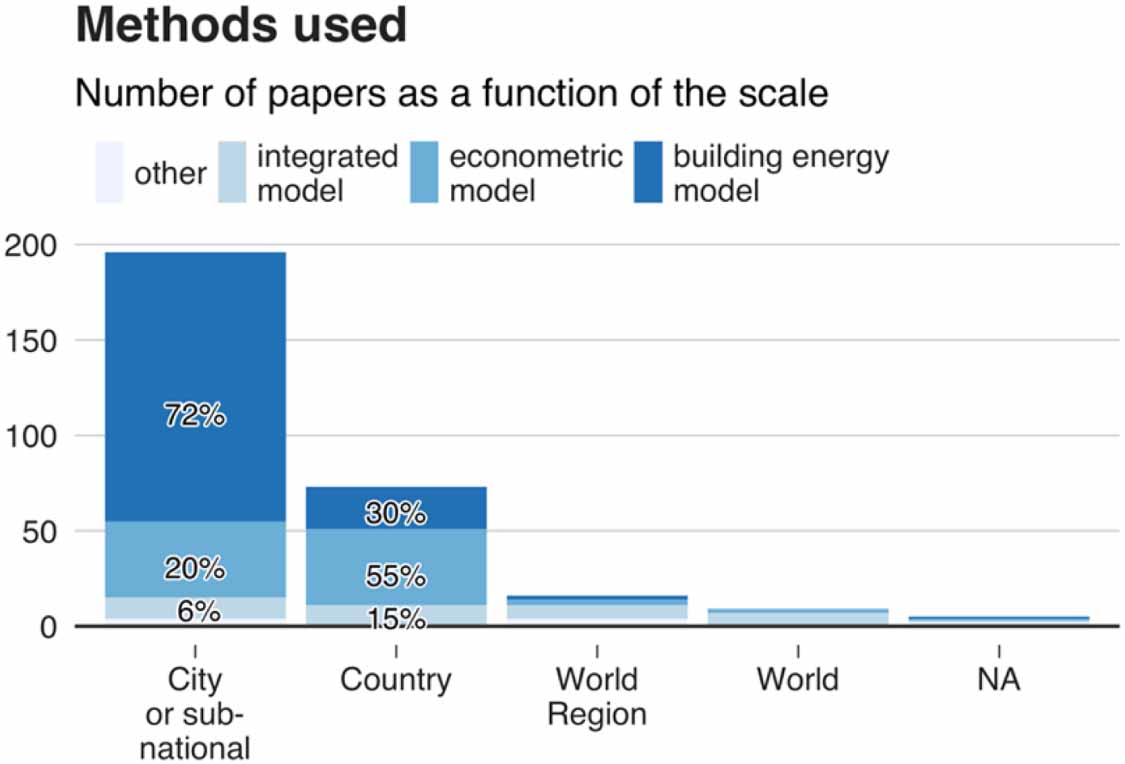
Standard image High-resolution imageIn the studies about heating and/or cooling, there is a clear link between the scale of the studies and the method used (figure 14). Building energy models are used primarily for city-scale studies, integrated models for global studies, and econometric studies for intermediate (in particular, national) scales. This pattern is stable over time (figure 21 in appendix). In the studies which are not about heating and/or cooling, building energy models are not necessarily meaningful, but a similar pattern can be seen between studies using econometric modelling and integrated modelling (figure 22, figure 23 and figure 24 in appendix).

Figure 14. Method used as a function of the scale of the studies.
Download figure:
Standard image High-resolution image3.7. Could alternative adaptation pathways reduce energy demand ?
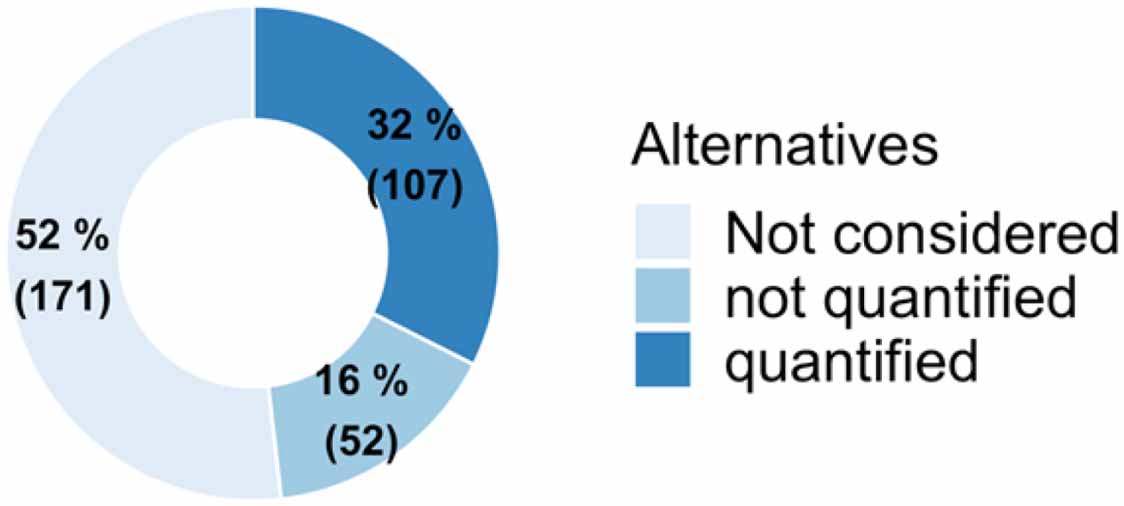
Some papers consider a direct, mechanistic link between climate change and energy demand variation, whereas other papers explicitly consider, for the same climate change scenario, that different response pathways may lead to different energy demands. This is what we assess in figure 15.

Figure 15. Share of the papers were several possible adaptation pathways were mentioned and/or quantified.
Download figure:
Standard image High-resolution imageMore than half (52%) of the publications only consider one response to climate change (planned or spontaneous adaptation). To take a few examples, Isaac and van Vuuren (2009) consider only one scenario for AC adoption by the population (the paper states that the scenario 'does not include any policy efforts towards either mitigation or adaptation to CC'), and studies the resulting variations in AC-related energy use. Many papers such as Sailor (2001), Giannakopoulos et al (2009) or Damm et al (2017) examine the current or past relationships between temperature and energy use. They then use this relationship to project potential future energy demand, thereby effectively ignoring any specific adaptation measure.
16% of the papers explicitly acknowledge alternative adaptation measures without quantifying their impact on energy demand. For instance, Solecki et al (2005) study different strategies to mitigate the heat island effect, but do not quantify their impact on energy demand. Amato et al (2005) or Auffhammer et al (2017) mention that different adaptation measures could impact the relationship between temperature and energy use, but do not provide quantitative estimates. Finally, only the remaining 32% of the papers assess quantitatively different response scenarios (using the methods reviewed in section 3.6). As can be seen in figure 25 in the appendix, there is no visible increase in this share over time, and this share is comparable for the different climate change impacts.
Whether different adaptation pathways are studied in the papers strongly depends on the scale of the studies and the methodology used. Quantified alternatives are more prevalent among smaller-scale studies (figure 16). Only four articles quantify alternatives at the regional or global scale (Quéfélec and Allal 2015, IEA 2018, Kahil et al 2018a, Nematchoua et al 2019). Quantified alternatives are rare among econometrics- or statistics-based papers (figure 17). In contrast, they are studied in almost half of the papers using integrated or building energy models. This is not illogical, as it is more difficult to study the consequences of potential changes in technology adoption or behaviors with econometrics models, which are by nature designed to analyze the consequences of existing technologies and behaviors.
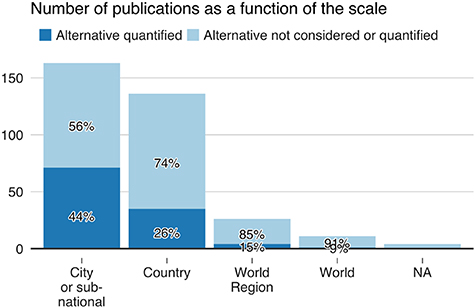
Figure 16. Share of the papers where several possible adaptation pathways were mentioned and/or quantified, as a function of the geographical resolution of the study.
Download figure:
Standard image High-resolution image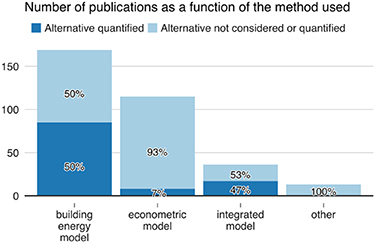
Figure 17. Number of papers quantifying alternatives, as a function of the method used.
Download figure:
Standard image High-resolution imageThe number and type of actions studied is very heterogeneous across the studies. Table 3 lists the main adaptation solutions studied in the papers dealing with heating or cooling (see table 5 in the appendix for the complete list, and table 6 for other energy usages). In some papers, generic measures are studied (e.g. 'better insulation', (see for instance X. Wang et al 2010, Ren et al 2011, Hosseini et al 2018, Lapisa et al 2018) whereas in other papers specific actions are documented (e.g. 'mixed mode ventilation', (see for instance Daaboul et al 2018, Sánchez-García et al 2019). A direct comparison across the papers is therefore difficult.
Table 3. Adaptation solutions found in the papers studying heating and/or cooling. 95 papers, in total, study heating and/or cooling and quantify the impact of at least one adaptation solution.
| Solution | Number of papers quantifying the solution | Number of papers mentioning the solution |
|---|---|---|
| Better insulation | 32 | 44 |
| Shading device, Blinds | 29 | 40 |
| Nightly ventilation | 14 | 16 |
| Higher setpoint temperature/Increased comfort range | 13 | 14 |
| Changing windows proportions | 12 | 13 |
| Increased natural ventilation | 11 | 20 |
| Increased mechanical ventilation/air conditioning | 10 | 16 |
| Changing windows technology | 9 | 11 |
| Changed thermal capacity | 7 | 15 |
| Vegetated roof | 7 | 15 |
| Increased albedo | 6 | 15 |
| Improved AC performance | 6 | 9 |
| Facade orientation | 6 | 8 |
| Facade inclination/Building geometry | 4 | 4 |
| Water pond/evaporative cooling | 3 | 8 |
| Increased thermal resistance | 3 | 4 |
| Tinted windows | 3 | 3 |
| Adaptative comfort control | 3 | 3 |
| Other | 2 or less | 8 or less |
Table 4. Energy usage studied in the papers.
| Number of case studies | Fraction of the papers | |
|---|---|---|
| Heating and cooling of buildings | 5966 | 88.0% |
| Aggregated/unspecified | 571 | 8.4% |
| Drinking water extra treatment processes | 80 | 1.2% |
| Water pumping for irrigation | 67 | 1.0% |
| Water heating | 36 | 0.5% |
| Drinking water extra pumping | 31 | 0.5% |
| a verifier | 10 | 0.1% |
| Artificial snowmaking | 8 | 0.1% |
| Heating of greenhouses for food production | 6 | 0.1% |
| Extra infrastructure maintenance (e.g. road, railways) | 2 | 0.0% |
Among the many adaptation alternatives considered, 'better insulation' and 'use of shading devices/blinds' stand out as most frequently cited. Both appear and are quantified in about a third of the papers. In contrast, at least 20 adaptation actions—e.g. 'reduced HVAC operation hours'—are only studied or mentioned in as few as two papers (see table 5).
4. Discussion
The aim of this systematic map was to review the state of the literature on current or potential effects of climate change adaptation on energy demand. This literature is large and fast-growing, reflecting the importance of this question. However, currently, it is difficult to get a clear global view on these potential effects because of four important research gaps.
4.1. First research gap: shortage of studies on other impacts of climate change on energy demand than space cooling and space heating
Climate change can impact energy demand via multiple types of usage. However, one specific usage, namely heating and/or cooling, received the majority of research effort (more than 80%, and almost 92% if we include the papers about 'aggregated energy demand', which often actually study heating and cooling demand). It is not obvious, though, whether this mechanism is the main channel through which climate change could impact energy demand. Desalination for water demand, or water pumping to prevent floods or submersion may also, for instance, represent a large consumption of energy, either globally or locally (See chapter 4 in IPCC 1.5 report).
A few reasons may explain why they have not been studied as much. First, present or past use of such technologies to cope with a changing climate is not commonplace, so it is difficult to find data for econometric studies, or with which models could be calibrated. Second, the impact of climate on heating and cooling demand primarily rests on behavioral adjustments, given a certain technology endowment (heating system, air conditioner). 11 In contrast, most other usages considered here—chiefly among them, water desalination (Jones et al 2019)—require new investments, involving more significant costs. The question whether this makes such energy-intensive technologies less likely to be used in the future is, however, open.
Another, third, reason may also explain our result. For heating and cooling, there is an already established and long-studied connection between weather and energy demand (through heating and cooling degree days). This serves as a convenient basis for estimating climate impacts, and has no equivalent with other usages. In almost all the studies about these other usages, energy is not the main variable studied (for example, it would be water in the case of irrigation) and figures about energy demand variation are often a by-product of another analysis. By construction, we have only analyzed in this review the papers which analyze the full chain between climate change and energy demand variation. Beyond papers about heating and cooling, however, this chain may likely be splitted between articles studying responses to climate change and articles studying potentially induced energy demand variations. Focused research and reviews on each of these sectors should be conducted to better investigate into this and assess the actual potential energy demand variations.
4.2. Second research gap: an unequal geographic distribution of the studies
Adaptation possibilities are highly case-specific and it is therefore not surprising that a large fraction of the papers study cities or smaller scales. It is a well-known fact that research case studies tend to concentrate on places where research funding is more abundant (Nagendra et al 2018, Lamb et al 2019). Yet it is striking to see that large fractions of the world are not studied in the literature. It should be noted that the same conclusion is true for the literature on climate change impacts on energy production, as highlighted by Cronin et al 2018).
The disconnect between the research effort within our corpus and the associated stakes becomes strikingly apparent when one compares our figure 7 to Ruijven et al (2019)'s distribution of projected impacts of climate change on energy use for heating and cooling (see figure 18). Almost all the literature concentrates on places where heating demand is expected to decrease, and only a few studies are on places where cooling demand is expected to increase (e.g. sub-Saharan Africa). These last studies moreover take a global or national perspective and therefore lack the degree of detail that can be found in less highly-disaggregated studies. This raises the question of whether the current literature, as a whole, presents a systematic bias leading to an under-estimation of climate change impacts on cooling demand.

Figure 18. Places where heating energy demand is expected to decrease (a) and cooling energy demand is projected to increase (b) in the study by Ruijven et al (2019). Reprinted from Van Ruijven et al (2019). Copyright © 2019, Springer Nature. CC BY 4.0.
Download figure:
Standard image High-resolution image
Figure 19. Repartition of the energy usage studied in the papers. Note: As some papers study several energy usages at the same time, they are counted several times, so the total number of papers here is different than in Figure 2.
Download figure:
Standard image High-resolution image4.3. Third research gap: only a few studies focus on peak energy demand
High-frequency variations in energy demand, and in particular the magnitude of demand peaks, are important issues for the optimal management and planning of electricity infrastructure, especially those associated with renewable energy production. Some papers study either specifically peak energy demand (20% of the papers) or time scales shorter than a year (less than a third of the papers), but they are a minority, and almost none of them deals with countries beyond Europe or the USA.
4.4. Fourth research gap: Various adaptation pathways can impact future energy demand, but few quantitative data exist
The impacts of adaptation to climate change on energy demand depends on the adaptation choices made: promoting air conditioning or adding vegetation in cities are two possible ways to fight against heat waves consequences, for instance, but they lead widely different energy consumption increases (Viguié et al 2020). This is a key idea if one wants to lower the impact of adaptation on energy demand and prevent maladaptation. However, fewer than half of the articles that we reviewed take into account the fact that different adaptation possibilities exist, and only a third actually assess quantitatively the consequences of such different possibilities. Also, most articles comparing different adaptation choices have a local geographical coverage, with virtually none taking a regional or global perspective. This is intrinsically linked to the methods used by the papers. Most large scale assessments indeed rely on statistical/econometric methods, in which it is by nature difficult to take into account of potential adaptation pathways which have not been implemented yet. As a consequence, globally, there is only a weak understanding of the extent to which various adaptation pathways could impact global energy demand. Moreover, we also found that most articles tend to focus on the same adaptation solutions. The literature does not seem representative of the actual panel of adaptation options available today.
| Low | +2 °C or lower (global) or less than 3 °C (local), or self-described as 'low' or 'minor', or RCP 2.6 |
|---|---|
| medium | Between +2 °C and +4 °C (global) or between +3 °C and +4 °C (local), RCP 6.0 or 4.5, SRES A1b, B2, B1, or self-described as 'medium-high', 'medium' or 'moderate' |
| high | +4 °C or more (global or local), RCP 8.5, SRES A1, A1F1 or A2, or self-described as 'high', 'medium', 'significant' or 'extreme' |
5. Conclusion
The literature on the impact of adaptation on energy demand is diverse and fast-growing. The papers reviewed here, which arguably cover the vast majority of the field, were published in a number of journals representing a variety of disciplinary approaches and geographical focus. This illustrates the inherently interdisciplinary and global nature of the question. Still, at least four important research gaps remain and thereby question whether our current understanding of climate impacts on energy demand is so solid as to provide a sound basis for long-term decision-making.
The first gap is thematic, with the literature focusing on one specific mechanism through which climate change impacts could influence energy demand, namely the issue around heating and cooling. Many other potential mechanisms are overlooked. The second is geographical, as the literature focuses, to a large extent, only on a few regions. The third is methodological, with only a minority of studies going beyond yearly energy average or examining peak energy demand. Finally, the fourth is conceptual, as here again, only a minority of papers, and especially almost none with a large geographical coverage, takes into consideration the fact that our response to climate change is by no means obvious, and that different adaptation pathways, more or less energy intensive, are possible. Moreover, the papers that do consider such possibilities study for the most part similar options, and most adaptation possibilities are conversely studied by just one or two papers. Filling these gaps is a priority for further research.
Acknowledgments
This study received funding from the French Agence Nationale de la Rercherche through the projects VITE (ANR-14-CE22-0013-03) and DRAGON (ANR-14-ORAR-0005). We also thank the French ANR Convergence Institute CLAND project for support. This paper wouldn't have been possible without the help of Patrice Dumas, David Makowski, Samuel Morin, Vivien Fisch and Thierry Brunelle.
Data availability statement
All data that support the findings of this study are available at https://doi.org/10.5281/zenodo.4452045 (Juhel et al 2021).
Appendix: Classification of climate change scenarios
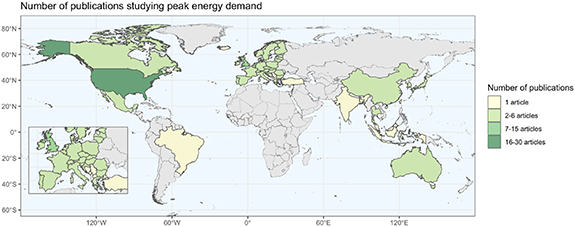
Figure 20. Number of publications studying peak energy demand.
Download figure:
Standard image High-resolution image
Figure 21. Evolution of the methods used over time.
Download figure:
Standard image High-resolution image
Figure 22. Method used as a function of the scale of the studies (papers about 'aggregated demand').
Download figure:
Standard image High-resolution image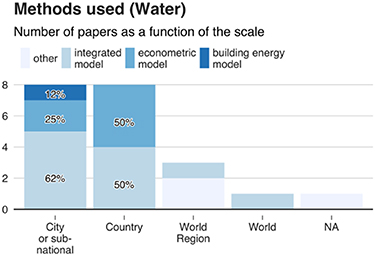
Figure 23. Method used as a function of the scale of the studies (papers about water).
Download figure:
Standard image High-resolution image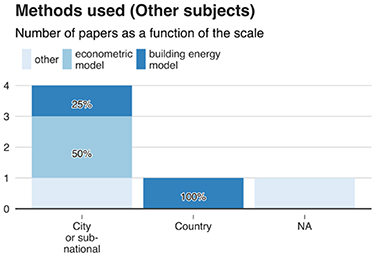
Figure 24. Method used as a function of the scale of the studies (subjects other that heating, cooling water and 'aggregated demand').
Download figure:
Standard image High-resolution image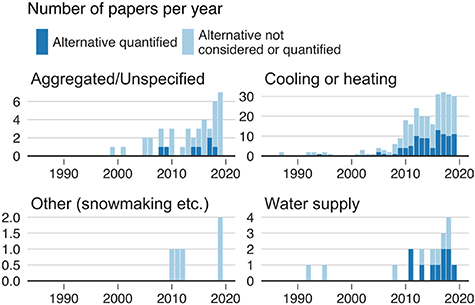
Figure 25. Repartition over time and as a function of climate change impact of the figures of Figure 15.
Download figure:
Standard image High-resolution image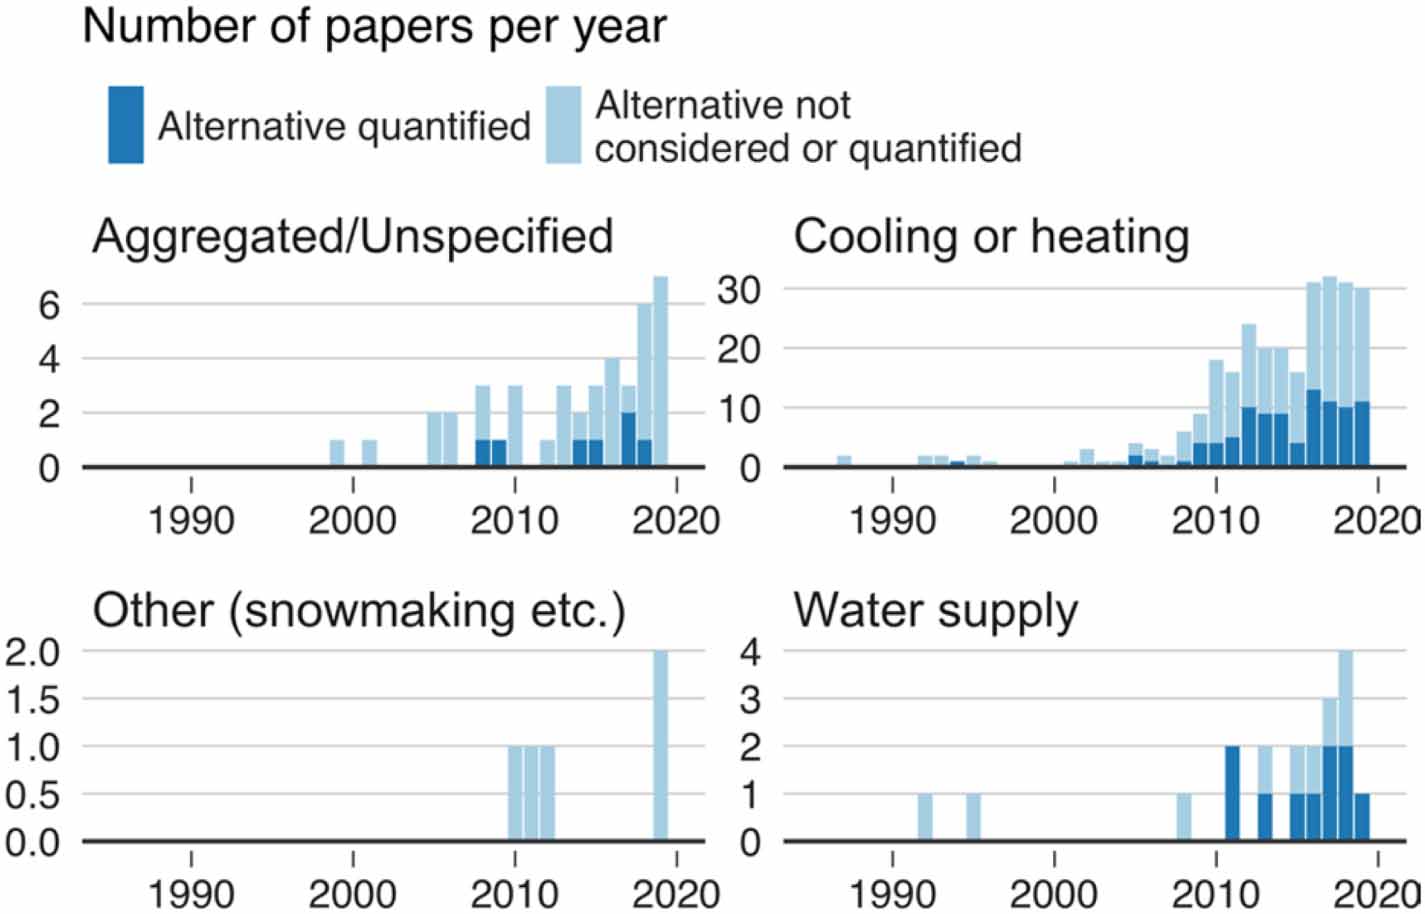
Table 5. Adaptation alternatives for heating and cooling. Respectively 95 and 135 papers quantify or more generally mention or quantify at least one adaptation alternative.
| Solution | Number of Papers quantifying the solution | Number of papers mentioning the solution |
|---|---|---|
| Better insulation | 32 | 44 |
| Shading device, Blinds | 29 | 40 |
| Nightly ventilation | 14 | 16 |
| Higher setpoint temperature/Increased comfort range | 13 | 14 |
| Changing windows proportions | 12 | 13 |
| Increased natural ventilation | 11 | 20 |
| Increased mechanical ventilation/air conditioning | 10 | 16 |
| Changing windows technology | 9 | 11 |
| Changed thermal capacity | 7 | 15 |
| Vegetated roof | 7 | 15 |
| Improved AC performance | 6 | 9 |
| Facade orientation | 6 | 8 |
| Increased albedo | 6 | 15 |
| Facade inclination/Building geometry | 4 | 4 |
| Increased thermal resistance | 3 | 4 |
| Tinted windows | 3 | 3 |
| Adaptative comfort control | 3 | 3 |
| Water pond/evaporative cooling | 3 | 8 |
| reducing internal load density | 2 | 5 |
| Mixed mode ventilation | 2 | 2 |
| Solar roof | 2 | 4 |
| earth to air heat exchanger (EAHE) | 1 | 1 |
| Clothing adjustment | 1 | 2 |
| reduced HVAC operation hours | 1 | 1 |
| Overhang | 1 | 2 |
| Increased vegetation | 1 | 8 |
| Chiller full variable speed | 1 | 1 |
| Water cooled chiller | 1 | 1 |
| Cool materials | 1 | 1 |
| Cool roof | 1 | 1 |
| Mist Pre-cooling chiller | 1 | 1 |
| Phase change materials | 1 | 2 |
| Ground cooling/Earth tube | 1 | 5 |
| Vegetated walls | 0 | 4 |
| Dynamic thermal insulation | 0 | 2 |
| Cool paving | 0 | 1 |
| Solar chimneys | 0 | 1 |
| Greening the ground | 0 | 4 |
Table 6. Adaptation alternatives for other energy usages.
| Solution | Number of papers quantifying the solution | Number of papers mentioning the solution | Energy use |
|---|---|---|---|
| Drip | 2 | 4 | irrigation |
| sprinkler | 1 | 4 | irrigation |
| Micro-irrigation | 0 | 1 | irrigation |
| Low-pressure pipe | 0 | 1 | irrigation |
| channel lining | 0 | 1 | irrigation |
| More efficient snowguns | 0 | 1 | snowmaking |
| business change | 0 | 1 | snowmaking |
| Solar water heater | 0 | 1 | water heating |
| Water recycling | 2 | 4 | water supply |
| Desalinization | 2 | 4 | water supply |
| Water conservation | 1 | 1 | water supply |
| Rainwater tanks | 1 | 2 | water supply |
| increased storage | 0 | 1 | water supply |
| Permeable pavement | 0 | 1 | water supply |
| Stormwater use | 0 | 1 | water supply |
Footnotes
- 7
- 8
Examples of papers rejected based on their title include biology papers dealing with the metabolism of various animals (e.g. 'A winter energetics model for bobcats in a deep snow environment', published in the Journal of Thermal Biology), climatology papers dealing with heat and energy exchanges in the atmosphere (e.g. 'Changes in the normal mode energetics of the general atmospheric circulation in a warmer climate' published in Climate Dynamics) or papers dealing purely with climate change mitigation (e.g. 'Climate impact of transportation: A model comparison' published in Climatic Change.)
- 9
To avoid double counting, we focused on primary research papers and excluded review papers.
- 10
Studying peak demand is related, but not directly connected to the time scale of the papers. Some papers for instance first study yearly average consumption, and then quantiles of consumption over an entire year.
- 11
It is important to recall here that AC adoption is strongly uneven across the globe, with ownership rates as high as nearly 100% in the US, Japan and urban China and below 10% in Europe, Africa and India.