

Abstract
We estimate CO2 emissions from the Nile Delta region of Egypt, using over five years of column-averaged CO2 dry air mole fraction (XCO2) data from the NASA's OCO-2 satellite. The Nile Delta has significant anthropogenic emissions of CO2 from urban areas and irrigated farming. It is surrounded by the Sahara desert and the Mediterranean Sea, minimizing the confounding influence of CO2 sources in surrounding areas. We compiled the observed spatial and temporal variations of XCO2 in the Nile Delta region (XCO2,del), and found that values for XCO2,del were on average 1.1 ppm higher than XCO2,des (mean XCO2 in desert area). We modelled the expected enhancements of XCO2 over the Nile Delta based on two global CO2 emission inventories, EDGAR and ODIAC. Modelled XCO2 enhancements were much lower, indicating underestimation of CO2 emissions in the Nile Delta region by mean factors of 4.5 and 3.4 for EDGAR and ODIAC, respectively. Furthermore, we captured a seasonal pattern of XCO2 enhancement (ΔXCO2), with significantly lower ΔXCO2 during the summer agriculture season in comparison to other seasons. Additionally, we used solar-induced fluorescence (SIF) measurement from OCO-2 to understand how the CO2 emissions are related to agricultural activities. Finally, we estimated an average emission of CO2 from the Nile Delta from 2014–2019 of 470 Mt CO2/year, about 1% of global anthropogenic emissions, which is significantly more than estimated hitherto.
Export citation and abstract BibTeX RIS

Original content from this work may be used under the terms of the Creative Commons Attribution 4.0 license. Any further distribution of this work must maintain attribution to the author(s) and the title of the work, journal citation and DOI.
1. Introduction
Our planet Earth has witnessed about 40% increase in atmospheric CO2 concentrations since the pre-industrial age. This increase is attributed to anthropogenic activities (IPCC 2013), primarily from combustion of fossil fuels. Agricultural activities are important sources of CO2 associated with combustion of fossil fuels by farm machinery, biomass burning, and emissions from soil. Soil emissions can be especially high from intensively farmed, irrigated carbon rich soils in river deltas (Telmer and Veizer 1999, Hannam et al 2019).
Most global estimates of CO2 emissions are provided by state-of-the-art emissions inventories which employ 'bottom-up' methods to quantify emissions, using human activity data and emission factors (Oda and Maksyutov 2011, Janssens–Maenhout et al 2019, Peylin et al 2013, Boden et al 2017, Oda et al 2018) as per the directions of IPCC (Intergovernmental Panel on Climate Change). These models have not been extensively tested for intensively farmed areas, like river deltas. Bottom-up methods use energy consumption data sets, such as fossil fuel consumption along with fuel purity, mix, efficiency, etc (see Boden et al 2017, Quéré et al 2018). There are discrepancies and uncertainties in the reported datasets on national scales (Miller et al 2013, Hutyra et al 2014, Liu et al 2015), especially for developing countries (Xue and Ren 2012). These discrepancies can result in ∼40% to ∼100% uncertainty in emission estimations at the country and the local scales, respectively (Peylin et al 2013, Wang et al 2013).
Effective monitoring of greenhouse gas emissions is also essential to keep track of humanities long-term emission reduction goals for keeping the global warming below 2 °C compared to pre-industrial levels, as defined in the Paris agreement. Ground-based or airborne monitoring of these emissions can be a tedious and expensive task because of the spatial distribution of various anthropogenic emission sources (Mckain et al 2012, Chang et al 2014, Lindenmaier et al 2014, Chen et al 2016, 2020, Viatte et al 2017, Luther et al 2019). The most promising way to monitor these emissions with consistent precision at different spatial scales is the use of satellite-based measurements (Wang et al 2018).
Satellites like SCIAMACHY (Scanning Imaging Absorption Spectrometer for Atmospheric Cartography) and GOSAT (Greenhouse Gases Observing Satellite) have been previously used to detect and analyze anthropogenic CO2 signatures (Yokota et al 2009, Kort et al 2012, Schneising et al 2013, Janardanan et al 2016). These studies generally suggested use of satellite-based observations with better spatial resolution to improve the detection of anthropogenic CO2 emissions as the enhancement of CO2 mixing ratio due to localized sources are a small fraction of the background values, thus making it a challenging task for low spatial resolution sensors to detect (Bovensmann et al 2010).
Here we use the observations from NASA's OCO-2 (Orbiting Carbon Observatory-2) satellite as a primary monitoring tool to assess the CO2 emissions in the Nile Delta, one of the most important, intensively farmed regions in the world. The OCO-2 measures column-averaged dry air mole fraction of CO2 (XCO2) with high spatial resolution (∼3 km2) (Crisp et al 2017) and precision (∼1 ppm). The megacity Cairo lies just to the south of the Delta. Both are surrounded by desert in three directions, except for the narrow Nile valley leading southward, with the Mediterranean in the north. OCO-2 tracks are situated over and nearby this area making it an excellent target for quantifying emissions using OCO-2 data. Our work builds on previous studies to detect localized emission sources (Yokota et al 2009, de Gouw et al 2014, Hakkarainen et al 2016, 2019, Kuze et al 2016, Nassar et al 2017, Schwandner et al 2017, Ye et al 2017, Wang et al 2018, Labzovskii et al 2019, Reuter et al 2019, Zheng et al 2019) using OCO-2 data.
We examine the spatiotemporal gradients of XCO2 between the Nile Delta and surrounding desert over a 5 year period, and compared the observed enhancements to values modeled using global emission inventories. We find that the two investigated inventories underestimate CO2 emission rates in the region by large factors with significant seasonality during the winter and summer agriculture season. We conclude that intensively-farmed deltaic areas may be significantly more important in global CO2 emissions than appreciated hitherto.
2. Data and methods
2.1. Study area
The Nile Delta is considered to be one of the oldest cultivated areas in the world, having been continuously cultivated since 3000 B.C. (Negm et al 2017). It is a triangular shaped, tide-dominated delta (figure 1(a)) occupying about 2.5% of Egypt's area (∼25 000 km2) and giving shelter to about 60% of its population (Zeydan 2005, Negm et al 2017). Moreover, 96% of Egypt's population is concentrated around Nile Delta (north of Cairo) along with Nile valley (south of Cairo) (Abd El-Kawy et al 2011). Since the construction of Aswan High Dam in 1970, the Nile Delta has received less input of nutrients and sediments from the river floods. This shift has resulted in intensive use of fertilizers for agriculture, thereby degrading the soil quality and potentially leading to loss of soil organic matter (Negm et al 2017). Furthermore, about 75 000 ha of fertile agricultural land was lost to urbanization within the Nile Delta between 1992 and 2015 (Radwan et al 2019). Nevertheless, the Nile Delta produces two-thirds of Egyptian crops (FAOSTAT 2019, www.fao.org/faostat/en/) with its still rich and fertile soil allowing two or more crops over the year (Osama et al 2017). Two main growing season in Nile Delta is the winter growing season (peak in January/February) and summer season (peak in July/August). Important winter crops are wheat, vegetable and clover crops, whereas in summer—maize, rice and cotton are extensively grown (El-Beheiry et al 2015). The Nile Delta today is mostly characterized by artificially irrigated agriculture and spreaded urban settlements (figure 1(a)), with minimal natural sources or sinks of CO2.

Figure 1. Study area (triangular Nile Delta and Nile valley) with land use map and OCO-2 measurement (with 10 km swath) on 2016/02/15 with five different receptor locations (in solid circular shape) considered for forward modeling of XCO2 enhancements. The locations are 10, 15, 20, 25 and 30 km within the delta in the direction of OCO-2 trajectory. Center location of background section in the desert is shown as black solid-circle. The land-use map is based on the ESA-CCI (European space agency-climate change initiative) land cover map of 2015 with a spatial resolution of 300 m (Hollmann et al 2013).
Download figure:
Standard image High-resolution image2.2. OCO-2 satellite data
We used five years of XCO2 data from NASA's OCO-2 satellite. The OCO-2 satellite was designed to accurately measure XCO2 at kilometer-scale spatial resolution around 13:30 local time with a repeat cycle of 16 d (Crisp 2015) and 10 km swath (Bhattacharjee and Chen 2020). The satellite uses the Atmospheric CO2 Observations from Space (ACOS) algorithm (Wunch et al 2011a, 2011b, Crisp et al 2012, O'Dell et al 2012). We used the high quality measurement soundings of the latest version of the OCO-2 Level 2 Version 9 Lite product from September 2014 to July 2019 provided by the NASA's Jet Propulsion Laboratory website (https://co2.jpl.nasa.gov/build/?dataset=OCO2L2Stdv8&product=FULL#download). The measurement soundings are obtained using an improved bias-correction approach and are pre- and post-filtered for potentially unreliably measurements (O'Dell et al 2018). The downloaded measurement data also contain surface wind velocity information at each measurement sounding taken from the NASA's GEOS5-FP-IT (Goddard Earth Observing System Version 5-Forward Processing for Instrument Teams). Each trajectory of OCO-2 measurement covers both the delta and desert area (figure S1 (available online at stacks.iop.org/ERL/15/095010/mmedia)), which enables us to quantify the spatial (delta-desert) XCO2 gradient.
In addition to XCO2 data, we also employed OCO-2's SIF (Solar-induced fluorescence) data. SIF is a signal emitted from plants/crops during photosynthesis, thus indicating photosynthetic activities (Sun et al 2017, Shekhar et al 2019, Castro et al 2020). OCO-2 measures SIF at two wavelengths, 757 nm and 771 nm (Frankenberg et al 2014, 2015), based on the infilling of the Fraunhofer lines (Frankenberg et al 2011). We used SIF (measured at 757 nm) to help understand how the CO2 emissions from the Nile Delta were related to agricultural activities.
2.3. Emission inventories
We computed the expected values of XCO2 over the Delta, compared to surrounding desert areas, using two CO2 emission inventories, EDGAR (Emissions Database for Global Atmospheric Research) and ODIAC (Open-source Data Inventory for Anthropogenic CO2). Both are constructed based on the IPCC methodology. The latest version of EDGAR v5.0 (Crippa et al 2020) was recently made available. It provides global annual CO2 emissions at 0.1° × 0.1° spatial resolution until 2018. EDGAR emissions are calculated using a bottom-up methodology: the inventory scales activity data, which is based on international annual statistics with the best-available emission factors. Then, it uses the monthly share and spatial proxies such as population and road density to downscale the national or state-level data to a finer spatial resolution. We used the CO2_excl_short-cycle_org_C variable of the EDGAR v5.0 which includes total CO2 emissions (in kgCO2 (m2 s)−1) from the considered fossil fuel sources such as fossil fuel combustion, various non-metallic mineral processes like cement production, various metallic and chemical production processes, urea productions and agricultural liming processes. The EDGAR v5.0 dataset was downloaded from the European Commission's Joint Research Centre-EDGAR website (https://edgar.jrc.ec.europa.eu/overview.php?v=50_GHG). Mean EDGAR emissions over the Nile Delta from 2014–2018 was 108 Mt CO2/year.
The latest ODIAC v2019 provides monthly CO2 emissions (in tons of Carbon/(km2-month)) from fossil fuel combustions at a much higher spatial resolution of 1 km × 1 km (GeoTIFF file format) till the end of 2018 (Oda et al 2018). A hybrid approach is implemented to construct the ODIAC emission inventory, which integrates national emission estimates produced by CDIAC (Carbon Dioxide Information Analysis Center, Andres et al 1996) and nightlight data with individual power plant emissions/location profiles (Oda and Maksyutov 2011). The ODIAC v2019 dataset was downloaded from the CGER-NIES (Center for Global Environmental Research, National Institute for Environmental Studies) website (http://db.cger.nies.go.jp/dataset/ODIAC/DL_odiac2019.html).
Since neither the EDGAR nor the ODIAC dataset was fully available for the time period of this study (September 2014–July 2019), we used the latest available data point for each inventory for the remaining time period, i.e. the EDGAR and ODIAC estimates of 2018 were used for the year of 2019. It is important to note that neither of these two emission inventories include CO2 emission from agricultural soil degradation. Both EDGAR and ODIAC emission datasets are widely used by the international carbon cycle research community (Quéré et al 2018). Mean ODIAC emissions over the Nile Delta from September 2014–July 2019 was 136.5 Mt CO2/year. Figure S3 shows the CO2 emission map for Nile Delta as per EDGAR and ODIAC.
2.4. Modelling methods
To simulate the enhancement of XCO2 values from the local CO2 emissions sources we employed a forward model based on the emission inventories and an atmospheric transport model.
For any location, the XCO2 can be modelled as the sum of the initial background concentration and the enhancement due to the upstream sources and sinks (Gerbig et al 2003, Hu et al 2018a). Equations (1) and (2) describe our calculations:

where, XCO2,fm is the forward modelled concentration for any location, XCO2,bkg is an initial background XCO2 value and XCO2,enh is the enhancement due to upstream CO2 emission sources. The 'footprint' is obtained from an atmospheric transport model and the 'emission' data are obtained from the emission inventories (more information below). Therefore, XCO2,enh is the summation of the enhancements caused by all locations (xi,yj): i = 1,2...Nx; j = 1,2...Ny., in the study domain containing the Nile Delta and valley (Latitude:[26, 32]; Longitude:[29, 33]). For the case of simplicity here, we have neglected the effect of sinks on XCO2,enh as the Nile Delta is characterized by minimal or no natural vegetation, and net emissions are plainly positive. To study the XCO2 enhancement in the Nile Delta we applied a local regression smoothing (LOESS, Jacoby 2000) with loess parameter (span) of 0.15 to the XCO2 concentrations along the OCO-2 trajectory (latitude-wise) for each measurement day, and these locally regressed XCO2 (XCO2,O) values were used for further calculation.
Since OCO-2 measures XCO2 along a narrow swath of 10 km (figure 1), selection of background concentration (XCO2,bkg) can be tedious. In this study, we leveraged the wind data from ECMWF's ERA5 dataset (Copernicus Climate Change Service (C3S) 2017) to select a particular section of one degree latitude range (background section) of XCO2 values in the desert that did not pass over the Nile Delta as XCO2,bkg. The selection of 'background section' was semi-automated for all the 32 dates. The semi-automated process involved visual inspection and automated selection of the background section. The detailed procedure is given in supplementary section S1. Figure 2 illustrates the background section for few dates. For example on 2014-09-23, the wind direction is north, contaminating the proximate observations with CO2 from the Delta, so we selected the lower section of OCO-2 measurements (shown in green box in figure 2), where the wind was coming from the east side. Similarly, for 2015-05-19, the selected section does not have any influence from Nile Delta and minimal influence from the Nile valley. The mean of the locally smoothed XCO2 values within this section was taken as a XCO2,bkg for each day. The selected background section for all the other dates is shown in figure S3.

Figure 2. Demonstration of background values selection for selected dates. The section of OCO-2 measurement used as a background (background section) is shown in green box. The wind data is obtained from the ECMWF's ERA5 dataset. Background section of all the dates is shown in figure S3.
Download figure:
Standard image High-resolution imageCalculation of XCO2,enh requires footprint information from the atmospheric transport model, and local emission data. The geographic distributions of emissions were adopted from EDGAR and ODIAC (section 2.2). Here, we simulated the footprints using the STILT (Stochastic Time-Inverted Lagrangian Transport) model that is based on HYSPLIT model (Lin et al 2003, Fasoli et al 2018, Wu et al 2018). The STILT model simulates convective and diffusive air transport patterns by releasing a certain amount of particles (N) from a receptor (i.e. an observation location in this case) and tracking the particles backwards in time (Hu et al 2018b). Thus, the STILT footprints are equivalent to the sensitivity of XCO2 (unit of ppm·m2·s·µmol−1) at the receptor location with respect to changes in surface flux (Gerbig et al 2003).
Our STILT simulation was based on ERA5 meteorological data and we chose a backward time of 32 h and N = 500 particles and 11 vertical levels for each receptor location. Figure 3 shows column averaged STILT footprints for 2014-09-23 and 2016-02-15 at 13:30 (local overpass time of OCO-2). Finally for each OCO-2 trajectory we chose 5 receptor locations within the Nile Delta at a distance of 10, 15, 20, 25 and 30 km along the OCO-2 trajectory to calculate XCO2,fm (in ppm), which is the accumulated CO2 enhancement occurring over the 32 h back trajectory at the receptor location due to emissions from the upstream sources. Figure 1 shows the receptor locations along the delta and within the background section for OCO-2 measurements on 2016-02-15. It is also evident from figure 3 that the footprints of the background receptor are not influenced by the Nile Delta area. Ultimately we compared the XCO2,fm with the LOESS smoothed OCO-2's XCO2 value at the receptor locations (XCO2,O) for each OCO-2 trajectory over study period (2014–2019) to estimate CO2 emissions based on the two inventory data.

Figure 3. STILT column-averaged footprints (unit of ppm·m2·s·µmol−1) for a location about 10 km (plus shape) and 30 km (cross shape) within the Nile Delta at 13:30 on 2014-09-23 (left) and 2016-02-15 (right). Footprints for the centroid location within the background section (circle shape) are also shown. The footprints (spatial resolution of is 1 km × 1 km) indicate the transport of air for the past 32 h and the upstream source locations which influence the XCO2 values at the receptor location.
Download figure:
Standard image High-resolution image3. Results and discussions
3.1. Spatiotemporal variation of XCO2 and SIF
We studied 62 d of OCO-2 measurements over the Nile Delta and desert area spanning five years of observations. We observed the expected steady seasonal cycle in XCO2 concentration over the delta (XCO2,del) and the desert (XCO2,des) from 2014 to 2019 (figure 4). About 80% of the measurements showed a mean XCO2,del of 1.11 (0.83,1.21) (95% confidence interval) ppm higher than mean XCO2,des with a maximum ΔXCO2 (XCO2,del—XCO2,des), of 2.2 ppm. Expectedly, consistent higher SIF values in the Nile Delta indicated the agricultural production (figure S4), with high SIF values during the months of peak of winter growing season (DJF) and summer growing season (JJA), but the latter season showed significantly lower ΔXCO2 values (figure 5). This seasonal pattern of ΔXCO2 can be attributed to the river flow dynamics and crops grown in the winter and summer season. The delta receives sediment and carbon-rich water during the winter season from the Aswan high dam (El Gamal and Zaki 2017), which is recycled and also used in the summer season. The emissions from newly arrived carbon-rich soil (carbon source) could result in high ΔXCO2. However in summer, high photosynthetic activity of well-irrigated maize and rice during the mid-day could be a significant carbon sink (Rana et al 2016, She et al 2017) with reduced CO2 emission from soil, thereby resulting in lower XCO2 values in the delta. A detailed study combined with cropping pattern and river flow dynamics could give insight that is more accurate. On average higher SIF values correlated with higher XCO2, which might not be expected for forest, but because of all the fossil fuel and soil CO2 emissions associated with the farming and irrigation in the Nile Delta (figure 5 and S5).

Figure 4. Variation of XCO2 from OCO-2 over the Nile Delta and desert from September 2014 to July 2019 with 62 d of measurement. The triangular/circular point and error lines shows mean and 95% CI of mean for the XCO2 measurements over the Nile Delta/desert. The observed ΔXCO2 in the secondary axis shows the difference between XCO2 from delta and desert (XCO2,del—XCO2,des). The OCO-2 soundings for Nile Delta and desert were selected based on the ESA-CCI land-cover map (figure 1). The ΔXCO2 data showed deviation from the normality at the higher and lower end of its quartiles as shown in the q-q plot.
Download figure:
Standard image High-resolution image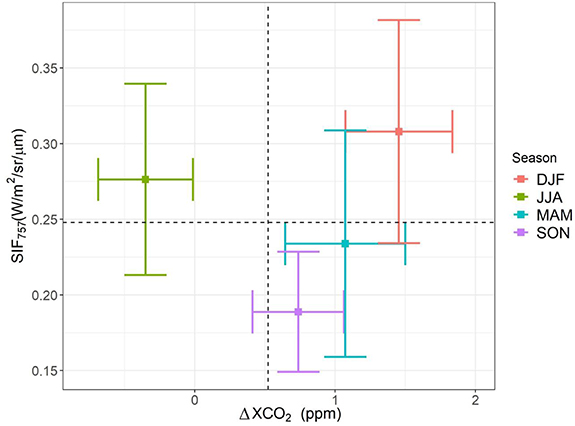
Figure 5. Seasonal decomposition of observed ΔXCO2 with respect to SIF for chosen four seasons. DJF seasons comprises of December, January, and February, and so on for other three seasons. The dashed vertical and horizontal lines represent the corresponding mean values of ΔXCO2 and SIF, respectively. The error bars are the 95% CI of the mean.
Download figure:
Standard image High-resolution imageThe OCO-2 clearly captured the latitudinal variation of XCO2 concentrations along its trajectory as depicted in figure 6. Transportation of CO2 plumes from emission sources in the delta region including Cairo city and Nile valley by the wind resulted in comparatively high XCO2 values in the downwind desert area. For example, on 2015-05-19 the CO2 emissions from Cairo results in as much as 3 ppm higher XCO2 values in the downwind desert area compared to the southern desert, with minimum influence from the Nile Delta or valley (figure 6). Furthermore, emissions from the Nile valley clearly resulted in elevated XCO2 values in the downwind desert area, for example on 2018-11-03 (figure 6, latitude: ∼26.5 deg.). Such wind transport of CO2 plume resulted in high XCO2 values in the desert region. Thus, OCO-2's XCO2 measurement clearly demonstrates the capability to measure local enhancement in XCO2 values.
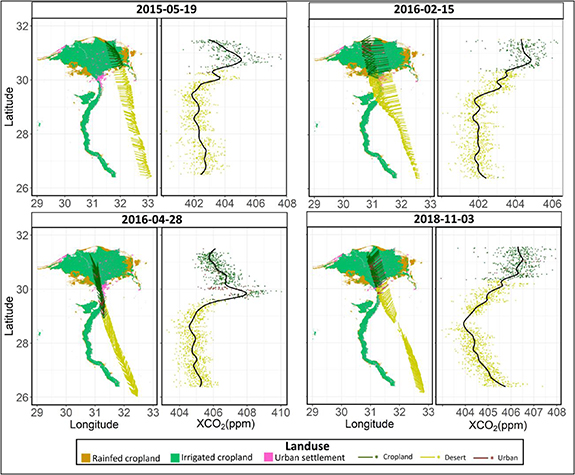
Figure 6. Latitudinal variation of XCO2 in the Nile Delta and desert and wind direction at 13:30 for a few selected dates. Black solid line is the local regression (loess) smoothed result with span = 0.15. The urban settlement in the lower end of the delta area is the Cairo megacity. The arrows represent the wind direction at the OCO-2 measurement points.
Download figure:
Standard image High-resolution image3.2. Forward modeling of emission inventories
Out of the 62 d of OCO-2 measurements, many days had sparse measurements over the Nile Delta and desert area, making it difficult to select background XCO2 values. Therefore, before performing the forward modeling of emission inventories to calculate XCO2,m, we applied a threshold criteria of minimum 100 and 200 measurements over the Nile Delta and desert area, respectively. Finally, 32 d satisfied the above criteria. Correspondingly, we performed forward modeling calculations on 5 locations at 32 different dates from 2014 to 2019. Two out of 32 d (2017-06-09 and 2018-07-07) showed consistently higher measurement values in the desert area resulting in higher XCO2,bkg values compared to the XCO2,O values at the receptor locations. These two dates occur during the peak of summer growing season and might indicate the agricultural crops grown (e.g. maize) in summer as a CO2 sink.
For all 32 dates at 5 locations (total 160 receptor locations), the observed enhancements (XCO2,O—XCO2,bkg) averaged 1.21 (1.05,1.36) ppm. The calculated enhancements were much lower, 0.27 (0.23,0.32) ppm and 0.36 (0.31,0.43) ppm based on EDGAR and ODIAC, respectively (figure 7). Very prominent enhancements of as high as 1.7 ppm and 4 ppm by EDGAR and ODIAC, respectively were obtained for receptor location in the Cairo city (figure 7).

Figure 7. Comparison of modelled/calculated XCO2 enhancements (XCO2,enh) using the EDGAR and the ODIAC emission inventories with the observed enhancements (XCO2,O—XCO2,bkg) for receptor locations. Red dots represents receptor location in Cairo megacity, whereas grey dots are for receptor locations at Nile Delta excluding Cairo megacity. The horizontal line inside the box plots represent the median value.
Download figure:
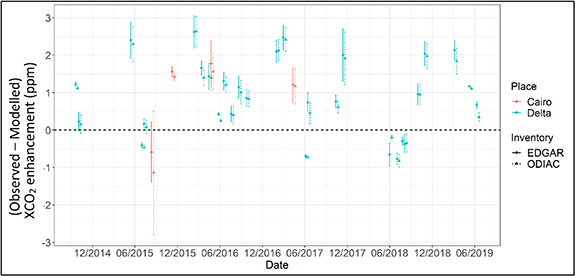
Standard image High-resolution imageOver the 32 d of study, 23 d showed underestimation of modelled enhancement (figure 8), which indicates high underestimation of CO2 emission by the emission inventories. Our calculations indicate an underestimation by a mean emission factor (MEF) (95% confidence interval) of 4.53 (4.34, 4.68) and 3.36 (3.19, 3.45) (calculated as a ratio of the mean observed enhancement over all the days, divided by the mean modelled enhancement for all days, and bootstrapped) for EDGAR and ODIAC, respectively. Based on these calculated MEFs we also estimated the CO2 emissions from the Nile Delta based on scaling up the two emission inventories. Our estimates of mean CO2 emission are about 489 Mt CO2/year and 457 Mt CO2/year based on EDGAR and ODIAC inventory over the study period (September 2014–July 2019).
Figure 8. Difference between observed and modelled enhancement. Only 4 dates of OCO-2 measurements passed through Cairo city (marked in red color).
Download figure:
Standard image High-resolution image
Our estimate compares relatively well with recent CO2 emissions of about 1500 Mt CO2/year estimated from Yangtze River Delta in 2013 based on remote sensing (nighttime light) and statistical data (socioeconomic indicators) by Zhou et al (2019) as shown in table 1. The Yangtze River Delta is about 4 times larger than Nile Delta and is similarly characterized by intense urbanization and agricultural activity. However, our emissions estimates are quite high as compared to values obtained for the Pearl River Delta (table 1). Xu et al (2018) used urbanization indicators (like land, population and economic urbanization) to estimate carbon emissions in Pearl River Delta and also highlighted uncertainties in emission estimates due to selection of indicators (Peng et al 2017). None of the above studies included emissions from exploited/degrading carbon-rich agriculture soils, which may be a significant source in Nile Delta.
Table 1. Comparison of CO2 emissions from Nile Delta with other river delta.
| Nile Delta | Pearl River Delta | Yangtze River Delta | |
|---|---|---|---|
| Country | Egypt | China | China |
| Area (km2) | ∼25 000 | ∼40 000 | ∼110 000 |
| Population (millions) | 39 | 56 | 96 |
| Year | 2014–2019 | 2014 | 2013 |
| Data | OCO-2 XCO2 | Urbanization indicators | City Panel remote sensing and statistical data |
| Emission estimate (Mt CO2/year) | 473 a | 151 | 1450 |
| Reference | Present study | Xu et al (2018) | Zhou et al (2019) |
Uncertainties in CO2 emission inventories have been reported for developing countries, e.g. India and China (Guan et al 2012, Xue and Ren 2012, Janardanan et al 2016), and have mostly been attributed to uncertainties in the national level energy statistics and human activity data used to construct inventory data sets. Furthermore, the plot of ΔXCO2 and SIF (indication of agriculture activity) in figures 5 and S5, clearly shows seasonal differences, especially for the two main growing season (winter and summer) with lower XCO2 for the Delta during the summer growing season. We also calculated the seasonal MEFs for each season and found that the factors for the JJA season (MEF ∼ 1.05) was significantly lower than MAM season (MEF ∼ 5–8), and SON season (MEF ∼ 6–11) (see table S1). However, for DJF season, only two OCO-2 measurements dates have sufficient observations over the Nile Delta and desert area for the emission assessments (2015-02-15 and 2017-02-03). There are very high differences between modelled and observed XCO2 enhancements (>2 ppm in figure 8), which resulted in very high MEF (∼30 to 50, see table S1), which may be biased due to less measurement samples. Nevertheless, such strong signal of seasonal variation of XCO2 can be attributed directly or indirectly to agricultural farming and irrigation activities associated with the sediment-rich river inflow that occurs during the winter season.
Direct agriculture emissions include tillage enhanced soil respiration and crop residue burning, whereas indirect emission comes from fossil fuel consumption by farm machineries for various intercultural activities like tilling, weeding, harvesting etc, and pumps for irrigation. In 2010, as per report from EAS (2014), irrigation pumps (mostly diesel pumps) were used in 75% of the cultivated area. El-Gafy and El-Bably (2016) measured an average emission of 6.55 tCO2/ha from on-farm diesel pumps used for irritation.
Apart from agricultural activities, anthropogenic emissions from transportation, industrial and household use (combined energy statistics) of various distributed cities in the Nile Delta might also be under-reported in these global emission inventories (Guan et al 2012). Gately and Hutyra (2017) argued that global emission inventories (like ODIAC) appear to deflect from spatial patterns in source activity in comparison to national scale inventories, and thus the former might not accurately represent anthropogenic emissions at subnational or urban scales. Our calculated delta emissions are based on yearly (for EDGAR) and monthly (ODIAC) average of CO2 emissions, whereas the OCO-2 XCO2 measurements are instantaneous, at 13:30 local time. This can result in under-/over-estimation of calculated enhancements as CO2 emissions vary diurnally, weekly and seasonally, especially for urban areas. Burri et al (2009) measured CO2 fluxes using the eddy covariance method at the University of Cairo and showed that the CO2 fluxes have a significant diurnal and weekly variation, with peak CO2 flux occurring between 14:00 and 16:00 and minimum flux on Friday (rest day due to Muslim prayer day on Friday). In our study, ODIAC performed a little better compared to EDGAR, as the former gives monthly average estimates and thus has the capability to capture the seasonal variability of CO2 emissions, which cannot be implied for the latter.
4. Conclusions
Our study assesses CO2 emissions from the Nile Delta, which is particularly characterized by anthropogenic activities such as agriculture and urbanization, using the OCO-2 satellite observations of atmospheric CO2 concentrations. We found that emission inventory-based modelled XCO2 values were significantly lower than the satellite-based observed XCO2 values in the Nile Delta (factor 4.53 [4.34, 4.68] for EDGAR and 3.36 [3.19, 3.45] for ODIAC), indicating underestimation of CO2 emissions reported in the emission inventory. We combined XCO2 data with SIF to relate CO2 emissions from agricultural production in the Nile Delta. Our emission estimate for the Nile Delta was about 1% of the global anthropogenic CO2 emission and was comparable to the scaled CO2 emissions estimated for the Yangtze River Delta considering the differences in size. Our results are particularly important in the context of uncertainties in national level reported energy/activity statistics for developing nations, which results in underestimation of their CO2 emissions by the state-of-the art emission inventories. Our study provides an approach for verification of bottom-up emission inventories using satellite-based XCO2 measurement over consistently emitting local and regional sources. The latest OCO satellite, OCO-3 (launched in May 2019 and data available since January 2020), which also measures XCO2 and SIF, captures data of larger area (100 km × 100 km) in a snapshot mode with the same high spatial resolution, thus providing the opportunity to assess spatial variability of carbon emissions of larger area based on our approach. Based on the findings of our study, we recommend eddy covariance flux measurements in such a carbon-rich delta to quantify the seasonality of CO2 emissions, which could be used to improve the emission inventories. Finally, we call for more research in estimating possible uncertainties and thereby improve the accuracy of the emission inventories especially for countries with intense agriculture activities.
Acknowledgments
The authors would like to extend their gratitude towards NASA and the OCO-2 team for publicly providing such a valuable data. This work was supported in part by the Institute for Advanced Study (IAS), Technical University of Munich, funded by the German Excellence Initiative and the European Union Seventh Framework Program under grant 291763 and German Research Foundation (DFG) under Grant 419317138. This work was conducted while Ankit Shekhar was with Professorship of environmental sensing and modeling, Technical University of Munich. Now he is at ETH Zürich. We are also grateful to two anonymous reviewers for their suggestions which improved the manuscript.
Data availability statement
The data that support the findings of this study are openly available at the OCO-2 data portal at https://co2.jpl.nasa.gov/#mission=OCO-2