

Abstract
Some actions intended to adapt to climate change may do more harm than good, especially when they consume energy, making it more difficult to shift to decarbonized energy, or when, in meeting the needs of one group of people, they increase the vulnerability of others. Heat wave risk provides a typical example: air conditioning (AC) equipment may trigger large energy consumption and worsen outdoor heat stress. Alternative adaptation strategies exist, but it is not clear whether they can prevent the massive use of AC. Here, with an interdisciplinary modeling platform, taking Paris as a case study, we provide a first quantified analysis of the efficiency of adaptation strategies (large scale urban greening, building insulation policy, and generalized behavioral changes in AC use) in reducing future potential AC need. We find that even ambitious strategies do not appear sufficient to totally replace AC and ensure thermal comfort, under a median climate change scenario. They can, however, reduce AC energy use by half during heat waves and compensate for the heat released to the outdoor environment. Our results show that adaptation actions, implemented early, may play a key role if we are to remain on a low-carbon pathway.

Original content from this work may be used under the terms of the Creative Commons Attribution 3.0 licence. Any further distribution of this work must maintain attribution to the author(s) and the title of the work, journal citation and DOI.
1. Introduction
Changes in the environment can incite a society to take actions that result in its becoming worse off; this has been a cause of collapse of several ancient societies [1–5]. Today, with climate change, such a maladaptation risk has already been identified. In particular, it can occur when adaptation measures consume energy, making it more difficult to shift to decarbonized energy, or when they improve conditions for part of the society by degrading them for another, more vulnerable part [5, 6–8]. Reliance on individual air conditioning (AC) equipment to respond to heat wave risk may be considered a typical example, for two reasons. First, the associated energy demand can be large [9–11]. Second, if AC systems release heat into the street, as is most often the case, the outside air is warmed and the heat wave worsens [12, 13]. Although it is an efficient solution for households that can afford it, AC makes the situation worse for households who cannot or do not want to adopt it [14].
According to the fifth IPCC report, it is almost certain that the risk of heat waves will increase over most land areas during the 21st century. Such an increase has already been observed in recent years [15] and constitutes one of the few cases where recent increases in mortality have been directly attributed to man-made climate change [16–22]. AC is a tool that is particularly efficient to reduce heat wave impacts on comfort and health, and is being used more and more [23, 24]. It is therefore important to understand how alternative adaptation options could be implemented to complement or replace AC, and to what extent.
A number of alternative adaptation actions have been identified in the literature [25, 26]. At the scale of individual buildings, for instance, several techniques aiming to insulate against outside heat have been proposed and discussed [27–31]. Neighborhood scale or city scale actions, such as creating parks and making different urban planning choices (street orientation or building density) can also help to decrease outside air temperature [32–36]. However, the potential of a combination of these measures, applied at the scale of a whole city, is not yet fully understood. It is especially true for large-scale options, because direct experimentation is not feasible. Due to inertia in the evolution of cities, several years or even decades may be needed to enable significant changes in urban shape or building characteristics. The speed of these evolutions is comparable to that of climate change, and this forces us to make decisions before their impacts can be observed.
Here, we use an interdisciplinary modeling platform to analyze such measures, testing the extent to which they could replace AC and provide, alone, thermal comfort to the urban population during future heat waves. Our analysis focuses on Paris, a city that was strongly affected by the 2003 heat wave (about 5000 casualties). AC use by people living in the city is rare at present as, so far, they seem to have relied mostly on solutions such as fans, and temporary behavioral changes (drinking more water, changing working hours, limiting physical activity, etc) to cope with extreme heat. However, following a succession of hot summers, the number of AC installations in homes is rising sharply (13% of French households had AC in 2016, compared to 5% in 2005) [37, 38]. Adaptation to heat waves is one of the key priorities of the climate change adaptation plans for the city and for the surrounding region [39, 40].
2. Data and methods
2.1. Future heat waves in Paris
We employed a future heat wave database developed by Lemonsu et al [41] and already used by several studies on heat wave risk in Paris (see section 4 of supplementary information is available online at stacks.iop.org/ERL/15/075006/mmedia) [42, 43]. This database implements a statistical method to extract the probability of the occurrence of heat waves in Paris, together with their characteristics (intensity and duration), from 9 regional climate model projections under a median greenhouse gas emission scenario.
Figure 1 presents results from this work. By the end of the century, the frequency and intensity of heat waves are projected to increase markedly. Whereas in 1960–1989, the period with which heat waves returned in the Paris region was about 9 years, at the end of the present century (2070–2099), one or two heat waves can be expected every year. Heat wave durations will also increase, from 5 to 8 d (interquartile range) in 1960–1989 to 6–12 d at the end of the 21st century. Heat waves with exceptional durations (e.g. of 5 weeks) can also be found in the simulations for the end of the century [41].
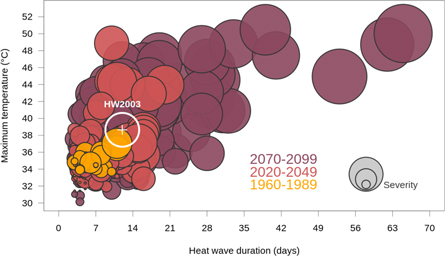
Figure 1. Cumulated number of heat wave (HW) days calculated per year over the control period (1960–1989) and two future periods (2020–2049 and 2070–2099) for the 9 regional climate model projections. The size of the circles corresponds to the mean intensity of the heatwaves.
Download figure:
Standard image High-resolution image2.2. Modelling framework
To simulate the heat island effect and potential future air temperature distribution in Paris during these heat waves, and for different city development scenarios, we use an integrated framework gathering together a physically based urban climate model, a building energy model and a land-use/transport interaction model (see Masson et al 2014, Lemonsu et al 2015 and Daniel et al 2016 for more information on this framework) [42–44]. This modelling chain is run over a 100 km by 100 km grid (1 km resolution) centered on the city of Paris.
The land-use/transport interaction model is Nedum-2D, a simulation model of urban expansion [45, 46]. Based on a demographic and a socio-economic scenario, and on two scenarios about future urban land-use regulations, it simulates scenarios of urban expansion and the distribution of the population in the Paris urban area over the 21st century. Here, as our reference scenario for urban development, we use a scenario assuming that city growth, from now until 2100, will follow current trends in terms of density decrease, and that population growth will be moderate (see supplementary information section 2 for more information on the model and the scenario).
The urban climate model is TEB-SURFEX (section 5 of supplementary information) [47]. It is a physical urban weather model that simulates heat and water exchanges between a city and the atmosphere. Taking land cover and building characteristics across the Paris urban area as inputs, it simulates the effect of the urban heat island on air temperature and humidity in the streets in the different scenarios. It is run at hourly resolution.
Finally, TEB-SURFEX includes a building energy model, based on Energy Plus, which simulates air temperature inside buildings and energy use for AC (section 5 of supplementary information) [44, 48, 49]. To obtain conservative estimates for AC consumption, we use optimistic assumptions for the efficiency of air conditioners. As limiting the use of low efficiency AC equipment is now widely advocated (e.g. by IEA or Worldbank) and as technical progress can continue, we decided to consider that everybody would be using AC systems with an energy efficiency ratio slightly higher than the best equipment available today (energy efficiency ratio between 12 and 15, see supplementary section 7.1).
Details of the models and the scenarios are presented in the supplementary information.
2.3. Consequence of heat on health and comfort
The consequences of heat on health and comfort can be estimated using indexes such as the universal thermal climate index (UTCI), which takes temperature, humidity and sunlight exposure into account [50]. Discomfort and impact on health differ widely between individuals, but they are statistically observed, generally, when this index becomes higher than 26 °C (medium heat stress conditions), and become notably more pronounced when this index rises beyond 32 °C (high heat stress conditions) [51]. The impact on health is especially related to the duration of the exposure to heat, and we therefore measure heat wave impacts by the duration, each heat wave day, spent under high heat stress conditions, averaged over the city population [52, 53].
3. Results
3.1. Air temperature in the streets and inside buildings if no AC is used
Figure 2 is an example of the simulation maps that we found. It shows simulated air temperature (at 2 m) in the streets at night (at 4 a.m.), for a heat wave corresponding to the average conditions that occurred during the 2003 heat wave, repeated over 9 d, and in our reference scenario for urban development in 2100. In this simulation, it is assumed that no AC is used in the city.
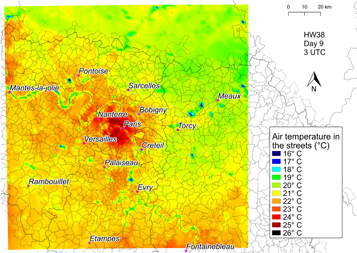
Figure 2. Example of a simulation map . The map represents air temperature in the streets (at 2 m) at 4 a.m., after 9 d of a heat wave similar to that of 2003 (HW38), if no AC is used. This temperature map was computed for a projection of what Paris could be in 2100. The urban heat island effect is clearly visible, with a 6 °C temperature difference between the center of Paris and the countryside.
Download figure:
Standard image High-resolution imageThis map presents a simulation for a given heat wave and similar maps were simulated for all the different heat waves that we extracted from the climate projections. When averaging over these future heat waves, considering their probability of occurrence at the end of the century, we find that, in the shade in the streets, almost 15 h of each heat wave day are expected to be spent under high heat stress conditions (see supplementary section 9 for all the results). We also find that, if no AC at all is used, the result inside buildings is almost 7.5 h per day under high heat stress conditions.
3.2. AC consequences on potential energy consumption and air temperature in the streets
If we now suppose that AC is used massively to cool buildings (to maintain a temperature of 23 °C in all buildings), with an optimistic assumption for air conditioner efficiency (energy efficiency ratio ranging from 12 to 15 according to the type of building), and if the heat generated by AC systems is released into the streets, the simulations show an increase of about 1.134 TWh of extra final energy consumption per year, on average.
This is equivalent to 2.4% of current (2017) yearly electricity consumption for offices and housing in the Paris region (see supplementary information section 7). So, over an entire year, the increase is moderate. However, this estimate implicitly supposes that AC is used only during heat waves, in order to prevent the impacts of heat on health and comfort. If, after installing AC, households also decide to use it during non-heat-wave days, the extra total energy consumption over the year due to AC will be much larger than this.
It should also be highlighted that, during the heat wave, the extra potential energy consumption is far from negligible, as it is equal to 105 GWh each day. This increase is equal to 81% of the current average daily electricity consumption for offices and housing in the Paris region. Such a momentary increase could be an issue for electricity production, as well as for electricity decarbonization, as, during heatwaves, renewable energy production from wind, and solar hydropower electricity generation is often less efficient [54].
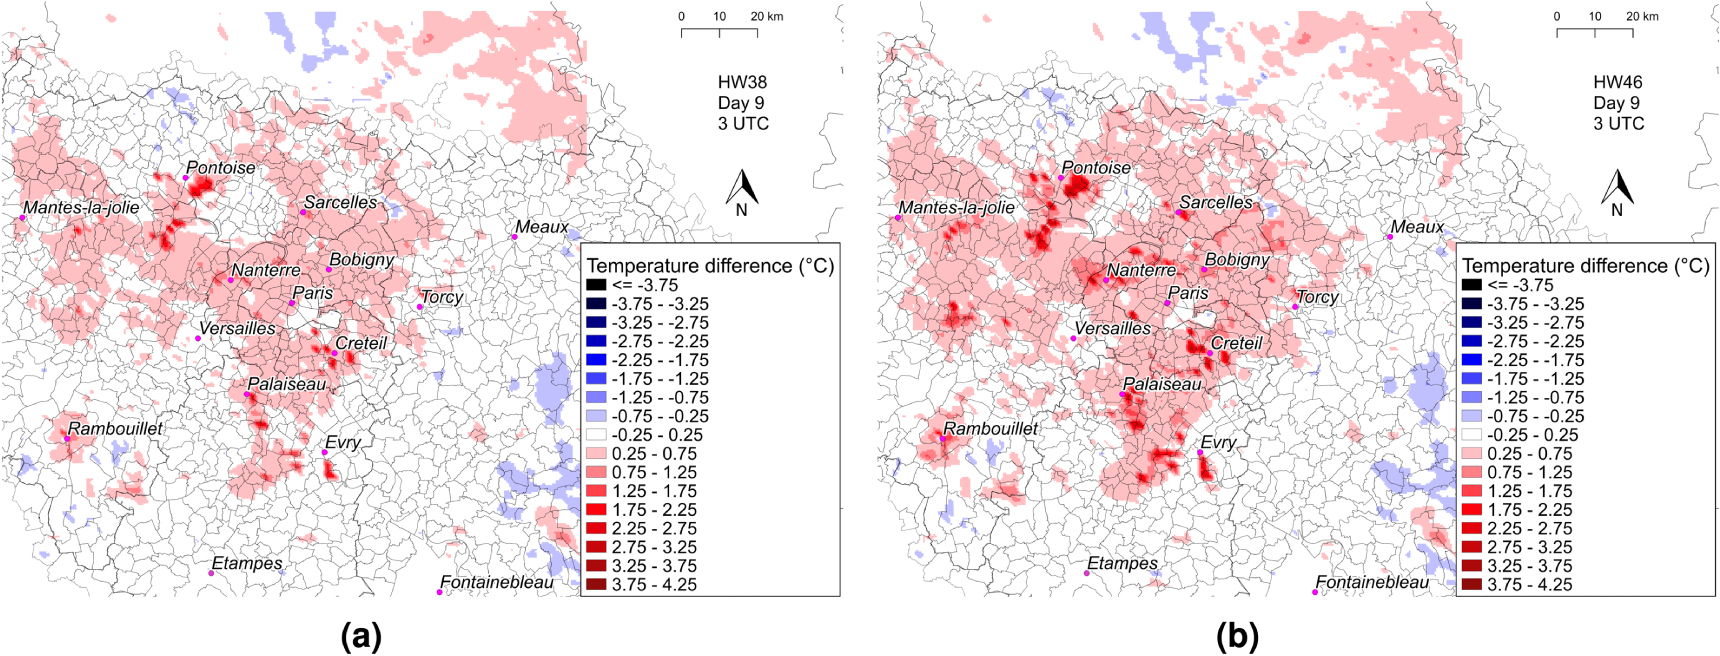
A significant degradation of external thermal comfort can also be seen in the simulations, as heat released by AC systems warms the outside air (see figure 3). The temperature increases due to AC depend on the time of day and on the characteristics of the heat wave, mainly its intensity. On average, the duration spent under high heat stress conditions in the streets is increased by about 20 min per day because of AC.

Figure 3. Impact of AC on air temperature: these maps show the temperature increase due to AC, under different heat wave conditions. The heat released by AC systems warms the outside air and worsens the heat wave. (a) Variations of air temperature in the streets because of AC heat release, at 4 a.m., after 9 d of a heat wave similar tothat of 2003 (HW38). Air temperature is increased by up to 2.4 °C. (b) Variations of air temperature in the streets because of AC heat release, at 4 a.m., after 9 d of the most intense type of heat wave that we consider in this study (HW46) (see section 4 of supplementary information). Air temperature is increased by up to 3.6 °C.
Download figure:
Standard image High-resolution imageThis illustrates the trade-off between indoor and outdoor air temperature: indoor air temperature can easily be kept low by AC but at the expense of outdoor temperature. Increased outdoor temperature could have many impacts on health and labor productivity for people with no AC or those working outside, and also for people working indoors in places with AC, if their homes and commuting trips are not cooled [55].
3.3. Could adaptation strategies replace AC?
To assess whether alternative adaptation strategies may help mitigate these issues, we first designed a group of ambitious adaptation actions representing a wide spectrum of potential policies. We then simulated their impact on AC use, related energy demand and external comfort degradation.
Adaptation actions can be grouped into various categories [56]. We considered actions corresponding to 3 categories (green infrastructure, physical infrastructure, and behavior) and acting at three scales (city-wide, individual building scale, and household level) (see supplementary information section 7). We did not consider actions related to crisis management, such as warning systems or targeted interventions towards particularly vulnerable people (e.g. relocation during summer time) but focused our analysis on actions aimed at improving the thermal comfort of the inhabitants.
The first action considered was a large scale urban reconfiguration policy leading to the addition of many parks and green spaces in the Paris urban area. Adding parks and green spaces is currently one of the main policies against heat waves in the climate change adaptation plans of both Paris and the surrounding region, even though such action is constrained by the high price of land in urban environments [39, 40]. To obtain an optimistic estimate of the consequences of such policies, we assessed an ambitious action, assuming that 10% of the surface of the city was devoted to new parks. We also supposed that they were sufficiently watered during the heat waves, so that the cooling effect of the vegetation due to evapotranspiration was optimal.
The second action was a building-scale policy. French construction standards for new buildings and, to a lesser extent, for existing buildings, include requirements for comfort during heat waves since 2012 [57]. These norms should be reviewed around 2020, and there are calls to make them more stringent over time [58], even if numerous economic and policy issues make this a complex subject [59]. We suppose that strict building insulation rules and the use of reflective materials for walls and roofs are applied to all buildings of the city, here, except for historical buildings in the center of Paris.
The third action deals with behavioral changes, i.e. changes in the way people use AC [60]. As a policy, it might take the form of effective recommendations. For instance, recommendations issued by Ademe (French Environment and Energy Management Agency) advise against lowering temperatures too much when using AC Although our reference scenario supposes that AC is used to maintain 23 °C in all buildings (see supplementary section 7.2), the adaptation action that we assess leads people to choose to maintain 28 °C in residential buildings and 26 °C in offices.
When implemented together, the three actions described above enable significant cooling of the outdoor air (by as much as 4.2 °C at night, see figures 4(a) and (b)). However, it seems difficult to rely on such actions to totally replace AC as we find that they only reduce the duration of strong thermal heat stress (UTCI temperature above 32 °C) inside buildings by about an hour and a half (1 h 23 min) per day. A little more than 6 h per day would still have to be spent in high heat stress conditions in buildings if no AC was used at all.

Figure 4. Impact of the combined three adaptation policies on air temperature in the streets at 4 a.m., after 9 d of a heat wave similar to that of 2003 (HW38). (a) Simulation with the three adaptation policies: this simulation is run with exactly the same conditions as for figure 2, except that AC is used in the city and the three adaptation actions (creation of parks, building insulation and use of reflective materials, effective recommendations for a moderate use of AC) are assumed to have been implemented. (b) Impact of adaptation actions. This map shows the difference between (a) and a simulation identical, except that the 3 adaptation actions are assumed not to have been implemented. Air temperature can decrease by up to 4.2 °C thanks to the adaptation actions
Download figure:
Standard image High-resolution imageOn the other hand, we also find that, when used together with AC, these actions enable its potential energy consumption to be reduced (by about 60%, see figure 5) and more than compensate for the degradation of external thermal comfort it creates in the city (see supplementary figure 12). Thus, although the actions do not seem sufficient to replace AC, they nevertheless allow large parts of its negative side-effects to be mitigated.

Figure 5. Comparison of adaptation action efficiencies. All values are per heat wave day. Reference case potential energy consumption for air conditioning is 103 GWh per heat wave day, so implementing all adaptation actions reduces this consumption by about 60%.
Download figure:
Standard image High-resolution image
3.4. Consequences of each adaptation action
Figure 5 compares the impacts of the actions with respect to potential final electricity consumption for AC and to air temperature in the city (measured as outdoor average duration of heat stress per day; indoors, by hypothesis, no heat stress is experienced if AC is present).
Creating parks and green spaces across the city decreases air temperature, mainly through a direct cooling effect due to evapotranspiration. However, this effect is not sufficient to have any significant impact on potential electricity consumption for AC (−2%). It should also be noted that the cooling effect is strongly dependent on the water available for the vegetation: if we suppose that no water is available for watering during heat waves, the cooling effect becomes negligible. (It is divided by 4 in our simulation.)
The quantity of water needed may be significant: in our simulations, an average of 12.2 × 10⁶ m3 d−1 is required on each heat wave day. This is of the same order of magnitude as the projected mean flow of the Seine river in 2100 (19.9 × 10⁶ m3 d−1) and larger than the current (2009) drinkable water consumption in the Paris Region (2.4 × 10⁶ m3 d−1) [43]. The environmental impacts of watering all the parks during all heat wave days may be significant and should be taken into consideration when assessing such an action, in addition to the numerous economic, social and environmental consequences—positive or negative—of the changes in urban fabric required to create more parks and green spaces [42, 61].
Improvements in building insulation have a much greater impact on potential energy consumption for AC in buildings (−17%). They also lead to a fall of air temperature in the city due to the decrease in AC use, and to the direct modification of the urban heat island effect by the reflective roofs. Beyond heat wave days, the impacts of such an action are difficult to assess simply. A better insulation of the buildings may indeed reduce heating demand over the whole year, but the reflective roofs have a more ambiguous impact. They may increase heating demand in winter because of a loss of the passive benefits of solar warming of the roof [25].
Finally, the behavioral change (increase in AC temperature set point) has the largest impact on potential AC energy consumption (−43%), and decreases outdoor air temperature significantly (20 min less per day spent under strong heat stress) because it cancels out a large part of AC heat release into the streets. The high impacts of this action, in line with other recent studies [60, 62], highlight the importance, beyond infrastructure changes, of actions targeting behavioral changes in climate policies [63].
All three actions have similar impacts on air temperature (each improves comfort time by about 15 min) but their impacts on potential electricity consumption differ widely. This points out that choosing one indicator rather than another leads to different messages: decreasing air temperature in the city is not equivalent to reducing AC use. Considering one or the other objective when prioritizing adaptation actions may therefore lead to different strategies.
4. Discussion and conclusion
To sum up, even though the actions that we have simulated are ambitious, they do not seem sufficient to cancel the heat stress caused by future heat waves if no AC is used. It should therefore be expected that AC will be widely used in the future in Paris and in cities with similar characteristics, if the population wants to maintain its thermal comfort during heat waves.
Over an entire year, the total energy consumed by AC during the heat waves is not extremely high, because the total duration of heat waves only represents a few weeks per year. However, during these days, the extra potential energy consumption is particularly large, and occurs at a time when wind energy production, for instance, may be difficult. It can also be reasonably expected that households will use AC during non-heat-wave days, once their house is equipped. To prevent this from leading to a future rise in greenhouse gas emissions, solutions need to be found to decarbonize the electricity used, and to globally limit AC energy use.
It should be noted that, in our simulations, we derived conservative estimates for potential energy consumption, assuming that all air conditioners would have a slightly higher efficiency than the best equipment available today. Similarly, we did not take account of the greenhouse gas emissions due to the fluids used in the air conditioners. If air conditioners were less efficient than our hypothesis or the occurrence of potential fluid leaks during air conditioner use was taken into consideration, the need to reduce AC use would be reinforced.
Although the adaptation actions analyzed here do not seem able to replace AC, they do enable the energy it requires during heat waves to be reduced by more than half. They also cancel out most of the outside air temperature increase due to the heat released by AC systems. Adequately planned adaptation strategies may thus help to limit both the reliance on AC and its negative effects. In the context of a progressively changing climate, they may also help to delay the year after which AC will be required to ensure thermal comfort and limit health impact for the majority of the population, hence limiting the cumulated energy consumption of AC. This highlights the profound link between adaptation and mitigation, and shows that adaptation may play an important role in securing a low-carbon pathway in the long term.
Data availability
The data that support the findings of this study are openly available at doi:10.5281/zenodo.2613879.
Code availability
The TEB model is an open source model, which can be downloaded from its website https://opensource.umr-cnrm.fr/projects/teb.
Acknowledgments
This study received funding from the French Agence Nationale de la Rercherche through the projects VURCA (ANR-08-VULN-013), MUSCADE (ANR-09-VILL-0003), VITE (ANR-14-CE22-0013-03) and DRAGON (ANR-14-ORAR-0005). The authors are grateful to Patrice Dumas and Gaetan Giraudet, who provided helpful comments, and to Jean François Toussaint and Samuel Somot for interesting insights.
Author contributions statement
All authors carried out the computational analysis. SH initiated the study. AL and VV continued and finalized its design. AL and VV both wrote the paper.
Competing financial interests
The authors declare no competing financial interests.