

Abstract
Robust, quantitative comparisons of environmental effects across energy sources can support development of energy planning strategies that meet growing demand while managing and minimizing undesirable effects on environmental resources. Multicriteria analyses of energy systems often use a suite of indicators to make such comparisons, but those indicators and their units of measure vary among studies. We reviewed 179 papers that described or applied energy indicators to compare environmental effects of different primary energy sources to answer four questions: (1) what environmental indicators have been used in multicriteria energy-source comparisons? (2) across studies, how consistently are these indicators used to quantify effects? (3) to what degree are different effects accounted for across energy sources and locations? and (4) how comprehensive are indicators in terms of assessing known environmental effects? For reviewed studies, we quantified the number of unique indicators and the diversity of indicators used to measure different effects. We also recorded the specific measurement units applied to quantify each indicator, the energy sources evaluated, and the continent where each study was conducted. While we found that many environmental effects of energy development have been analyzed across multiple sources, indicators were frequently measured, interpreted, and applied in ways that are not directly comparable, and some known environmental effects were infrequently assessed. We also found an emphasis on applying indicators to renewable energy sources; assessing current and potential energy sources, both renewable and nonrenewable, would greatly clarify the full suite of tradeoffs among sources and can inform energy development strategies that minimize adverse environmental effects. Overall, our review indicated that making comprehensive comparisons of the effects of energy development across sources may require efforts to standardize how effects are measured, synthesize effects literature into an open-source database, expand the range of environmental effects analyzed, and establish consistent frameworks for comparison.
Export citation and abstract BibTeX RIS

Original content from this work may be used under the terms of the Creative Commons Attribution 3.0 licence. Any further distribution of this work must maintain attribution to the author(s) and the title of the work, journal citation and DOI.
1. Introduction
Limited availability of nonrenewable resources and the need to minimize effects of climate change are driving global changes in energy systems from fossil fuels to renewable sources. While burning fossil fuels is a major cause of greenhouse gas emissions, energy production from any energy source can negatively affect other natural resources, including land, air, and water resources [1]. For example, extraction of unconventional natural gas can reduce water availability and quality [2], growing and harvesting bioenergy crops transform land resulting in altered ecosystem function [3], and fatalities from collisions with wind turbines and electricity transmission lines may affect populations of birds and bats [4, 5]. These and other effects of energy systems are linked to human health and quality of life via changes in ecosystems and the services they provide [6, 7] and also affect wildlife species through mortality and habitat loss [8]. Growth and exploration of energy development has brought attention to these potential negative repercussions, but methods of quantifying the environmental effects of different energy systems often vary among studies. Additionally, to fully assess tradeoffs among energy sources, the amount of energy produced, other technical constraints, and social and economic costs and benefits must be considered. The ability to make robust, quantitative comparisons of these effects across energy sources would support energy planning strategies that seek to meet growing demand while managing and minimizing undesirable effects on environmental resources [9].
Comparing environmental effects of different energy systems, particularly those with different primary energy sources, presents a significant challenge to scientists and decision makers. Comparisons across energy sources are common, but often report large degrees of uncertainty and variation, complicating the task of assessing tradeoffs [10–12]. This variation is driven by numerous factors, including inherent differences among energy sources and technologies in energy systems, differences in research and accounting methods, and the geographic and temporal context of the energy system [13–17]. For example, Ben Amor et al [18] used a suite of environmental, economic, and technical indicators to compare solar and wind technologies and found the most suitable development strategy depended on local climate. Ultimately, the environmental effects of particular energy sources (e.g. wind, coal, hydroelectric, geothermal) will be modulated by the broader context of the energy system. For example, if viable locations for placing solar energy installations overlap with endangered species habitat, while natural gas reserves are located outside this habitat, natural gas development may be considered a better option if maintaining habitat for the species is a key goal.
Despite the challenges of comparing environmental effects, multicriteria comparisons among energy systems are prolific [19–24]. These studies often use a suite of indicators to compare effects (e.g. comparing land area required for energy production from natural gas versus wind), identify suitable energy mixes, optimize energy systems based on various goals and constraints, and rank energy sources and/or systems by their overall sustainability. Similar indicators can also be used to compare or evaluate the progress of specific geographic regions toward the development of more sustainable energy systems [25–27]. The indicators used to quantify effects vary among studies, sometimes reflecting differences in research goals and data availability [27]. In addition, many studies focus on greenhouse gas emissions, potentially missing other important environmental effects [28–30]. While numerous studies have reviewed decision-analysis methods for energy planning (recent reviews include [20–24, 31–33]), an in-depth analysis of the indicators used to compare effects of different energy systems has not been previously conducted.
In this review, we surveyed studies that describe and apply energy indicators to compare environmental effects of different primary energy sources (figure 1). We focus on energy sources because energy systems are complex and difficult to categorize, consisting of a myriad of different energy sources, technologies, and economic activities that interact in a broader social-economic-political system. Energy sources, while not fully capturing the complexity of energy systems, are easily identifiable in the literature and represent broad categories that help differentiate energy systems, making them a primary unit of focus to begin understanding how different energy systems affect environmental resources. We collected data from reviewed articles to answer four questions: (1) what environmental indicators have been used in multicriteria energy-source comparisons? (2) across studies, how consistently are these indicators used to quantify effects? (3) to what degree are different effects accounted for across energy sources and locations? and (4) how comprehensive are indicators in terms of assessing known environmental effects? We note that while we investigated how indicators are measured, we did not formally review the methods used to estimate indicators (e.g. whether data were based on life-cycle analysis), as this would require its own review. Based on our analysis, we identify areas for future research and suggest a number of best practices for developing and using environmental indicators in comparisons of energy sources and systems.

Figure 1. Different primary energy sources affect the environment in different ways. We reviewed studies that apply indicators to quantify these effects for the purpose of comparing them across two or more energy sources.
Download figure:
Standard image High-resolution image2. Methods
2.1. Literature search
We sampled the literature that compared effects of different energy sources on the environment using the following search terms: (('energy' AND 'development') OR 'electrification' OR 'energy mix' OR 'energy alternative*' OR 'energy sustainab*' OR 'energy system*' OR 'electricity generation' OR 'energy source*' OR 'energy sector*' OR 'energy technolog*') AND (multicriteria OR 'multi criteria' OR multi-criteria OR indicator* OR 'multi objective' OR multi-objective OR multiobjective). These search terms were based on common language we had observed in the literature regarding energy effect comparisons. We limited this search to peer-reviewed English language articles in the 'Energy Fuels' or 'Environmental Sciences' categories on Web of Science to help eliminate irrelevant articles (e.g. those focusing on the technical aspects of energy production or energy flow in biotic systems). Our search on 2017-08-16 returned 2623 results. We also reviewed articles cited by and citing the top 5 most cited papers resulting from our review to check for gaps in our search; this included 799 articles, many of which overlapped the search results. We did not specifically target literature from individual energy sectors since our goal was to identify studies that compared effects across energy types.
We further screened the returned articles to limit our analysis to those that primarily focused on using indicators to compare the effects of different energy sources or guide decisions regarding energy choices in the design of energy systems. We excluded papers that solely focused on conversion and storage technologies, energy systems for a single entity (e.g. a building), and energy indicators geared toward an analysis of overall sustainable development of regions. We did this by first reading titles and discarding articles that were obviously not relevant. We then read abstracts and article texts; at this stage, many articles were discarded because they did not make comparisons across energy sources. This screening process narrowed our review to 179 articles.
2.2. Article-level data collection
For each of the 179 articles selected, we recorded the continents of the analyses if applicable, the types of energy sources compared, and whether the article focused on direct comparisons among energy sources or on comparisons of energy systems (energy generation plans that included input from multiple sources). Articles focusing on Turkey (n = 19) were recorded for the continent of Asia given that the majority of this country's land mass is generally categorized as part of that continent; we found no other studies that were geographically ambiguous.
2.3. Indicator-level data collection
For each article, we recorded all indicators defined for measuring effects of energy development, including environmental, social, economic, and technical indicators. Although our literature search strategy was designed to capture environmental indicators, recording all indicators used in the reviewed studies allowed us to explore how environmental indicators fit within multicriteria analyses of energy systems. We also recorded whether or not the studies used multicriteria indices to summarize overall effects from multiple indicators (e.g. sustainability indices that integrated effects from multiple indicators). We recorded the original name of the indicator as it was written in the study and also gave each indicator a revised name based on our interpretation of what it represented given the information provided (e.g. indicators with original names 'land use' and 'land requirement' in different studies were both given the revised name 'land area'). These revised indicator names grouped identical indicators that were differently labeled across studies, allowing us to identify a unique set of indicators across the reviewed literature. We also noted any specific measurement units used to quantify the indicator (including the numerator and denominator, if applicable and available), and whether the indicator was quantitative or qualitative.
After recording all indicators, we classified them into categories, subcategories, and types (table 1) that captured the effects each indicator intended to quantify, and summarized the number of indicators recorded for each classification level. These classifications were designed to maximize within-group homogeneity and between-group heterogeneity. For each indicator category and type, we calculated the number of unique indicators (based on the indicator name) and the Shannon–Wiener (S–W) diversity index, to understand the diversity of indicators used for measuring each indicator type or category. First published in 1948 [34], the S–W diversity index has since been widely used in information theory and ecology. In ecological applications, the index is generally used to quantify the diversity of species, but the index has also been used to quantify diversity and uncertainty more broadly across multiple fields [35]. In our case, we used the S–W index as a measure of uncertainty in predicting which indicator would be selected if randomly drawn from the full set of indicators used. Higher values of the index reflect a greater number of unique indicators, a greater evenness in application of that set of indicators, and therefore, a greater uncertainty in predicting which indicator would be randomly drawn. The S–W diversity index was calculated using the vegan package [36] in R version 3.5.1 [37].
Table 1. Hierarchy of indicator categorization and data collected for each indicator used in this review.
| Category | Overarching indicator category (i.e. environmental, social/economic, technical) |
| Subcategory | Refined indicator categorization (e.g. land, air, and water are subcategories nested within the environmental indicator category) |
| Type | Specific effect the indicators are intended to measure (e.g. all acidification potential indicators measure SOx emissions in some form) |
| Name | Revised indicator name based on information found in the study. This indicator name was used to identify unique indicators across all studies reviewed |
| Original name | Indicator name as reported in the article |
| Numerator | Units used in numerator of indicator, blank if measurement type = qualitative or units unspecified |
| Denominator | Units used in denominator of indicator, blank if measurement type = qualitative or units unspecified |
| Measurement type | Whether indicator is quantitative or qualitative |
3. Results and discussion
We summarized the indicators applied in multicriteria analyses that compared environmental effects of different energy sources. We found an emphasis on applying indicators to wind and solar energy sources, with additional focus on oil/gas, bioenergy, and hydropower, as well as predominant attention to Asia and Europe. The majority of environmental indicators recorded focused on air quality effects, consisting predominantly of greenhouse gas emission indicators, followed by effects to land area. We found insufficient coverage of known environmental effects of energy development and inconsistencies in the application of indicators across studies. These results suggest comprehensive comparisons of energy effects across sources will require efforts to standardize the definition and quantification of indicators and expand the range of environmental effects captured.
3.1. Overview of articles reviewed
The 179 reviewed articles (supplemental info-S1 is available online at stacks.iop.org/ERL/14/103002/mmedia) spanned 20 years (1997–2017), with a noticeable increase in qualifying articles after 2005 (figure 2(A)). The most common journals in which articles were published included Energy (n = 37), Renewable and Sustainable Energy Reviews (n = 27), Energy Policy (n = 25), Applied Energy (n = 15), and Renewable Energy (n = 15). Articles were approximately evenly split between those that focused on explicit comparisons or rankings of energy sources (n = 95) and those that focused on evaluating or optimizing energy systems or mixes (n = 82). Some papers that focused on energy systems also evaluated energy alternatives that are not primary energy sources (e.g. storage options, efficiency upgrades). Two papers focused on developing indicators but did not include an application. Article level data are provided as supplemental information (S2).
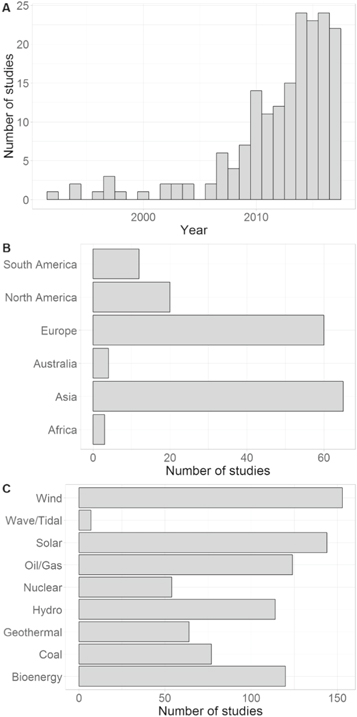
Figure 2. The number of studies reviewed (A) over time, (B) for each continent, and (C) related to each energy source (n = 179).
Download figure:
Standard image High-resolution imageThe majority of studies stating a specific geographic location were in Asia and Europe (figure 2(B)). Studies were lacking in Australia, Africa, and South America. Together with Asia, these locations are expected to experience the greatest increase in energy demand over the next 25 years [38] and may be particularly important for considering tradeoffs among different energy sources for future development. Relatively few studies focused on North America, where energy demand is historically high but may experience little proportional increase relative to other locations in coming years [38, 39].
The reviewed articles focused predominantly on wind (85% of studies), solar (80%), oil and gas (69%), bioenergy (67%), and hydropower (64%), with fewer studies including coal (43%), geothermal (36%), and nuclear (30%), and a very small proportion of studies including wave and tidal sources (4%) (figure 2(C)). Overall this demonstrates a focus on renewable energy sources, with greatest emphasis on wind and solar. This result is similar to previous studies [40, 41], though we found a somewhat larger share of papers focusing on hydropower and bioenergy than these past reviews. The strong emphasis on solar and wind may seem somewhat unexpected given the small fraction of the global energy supply that currently comes from these sources (0.2% and 0.5% respectively [42]). Bioenergy and hydropower make up a much greater share of the current global supply (9.4% and 2.5%, respectively), with energy from coal (28.1%) and oil/gas (53.4%) still dominating the energy market. A potential reason for these discrepancies in research is the emphasis on wind and solar as promising future energy sources [43]. While focusing on the future is a positive step, fossil fuels will continue to provide a large portion of the global energy supply for at least the next several decades [38].
3.2. Overview of indicators recorded
We recorded a total of 1902 environmental, social/economic, and technical indicators (hereafter 'recorded indicators'; see table 2) from the 179 reviewed papers. Of these indicators, 53% were defined quantitatively (though some did not include specific measurement units). We identified 505 unique indicators based on our interpretations of the recorded indicator names (hereafter 'unique indicators'); for example, indicators called 'land use' and 'land requirement' in different studies were both given the indicator name 'land area'. The indicator names provided by the studies and the exact units of measure used to evaluate these unique indicators varied (supplemental info—S3). If differences in measurement units were included, the number of unique indicators increased to 946, with 66% (n = 627) of these including specific quantitative units. Some of these measurements could be made directly comparable with simple unit conversions; for example, 88 of the 946 unique units of measure were based on a similar measurement system but with different orders of magnitude reported (e.g. grams versus kilograms). Other measurements may require more complex conversions or cannot be compared based on available information (e.g. tons/year to tons/kWh). Likewise, measurement units based on currency may be difficult to compare due to changes in monetary value over time, particularly if the time period is unspecified. A limited number of indicators were used for quantifying multiple indicator types. For example, toxicity indicator types, whether aquatic, terrestrial, or human, were often measured using a dichlorobenzene equivalent indicator. In addition, 55 articles implemented some type of multicriteria index or set of indices to synthesize multiple indicators in descriptions and or comparisons energy source and system characteristics.
Table 2. Tabulation methods for indicators.
| Recorded indicators | One record for every indicator found in every study |
| Unique indicators | One record for each unique indicator name |
| Indicator instances | One record for each time a recorded indicator is applied; a single recorded indicator may be applied multiple times in a single study to address different energy sources or to quantify effects observed on different continents |
| Measurement units | One record for each unique indicator/measurement unit combination; each unique indicator may be quantified using multiple measurement units |
Among the reviewed studies, which were selected based on their inclusion of environmental indicators, we also found indicators addressing other aspects of energy development. Specifically, of the 1902 indicators, 38% focused on environmental effects, 42% focused on social/economic effects, and 20% explicitly quantified technical aspects (20%) (figure 3). However, many environmental, social, and economic indicators indirectly included technical aspects of energy production by measuring effects per unit energy produced. Six additional indicators addressed effects that crossed category boundaries; these largely focused on site suitability in terms of environmental, social/economic, and technical costs, benefits, and constraints. We further classified each of the indicator categories into subcategories with the largest share of indicators addressing air quality, followed closely by market costs/benefits and human/economic development indicators.
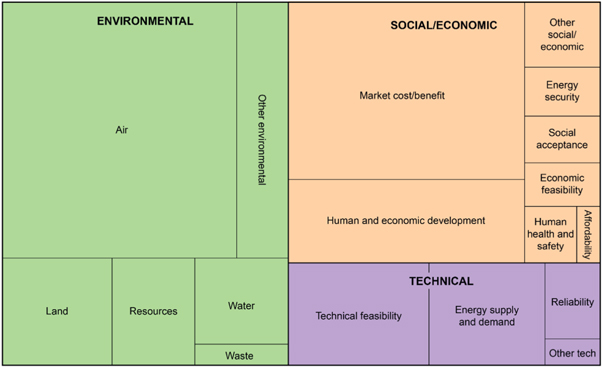
Figure 3. Relative contribution of indicator categories and subcategories to the total number of recorded indicators in studies that met our inclusion criterion of assessing environmental effects of energy. The relative size of each rectangle represents the proportion of total studies in each category or subcategory.
Download figure:
Standard image High-resolution image3.3. Application and consistency of environmental indicators
By classifying each indicator according to the effects measured, we identified 34 environmental indicator types across all reviewed studies (table 3). Definitions for each indicator type are in the supplemental information (S4); 'other' indicator types served as a catch-all for indicators that did not fit well into any particular type definition. Some indicator types were applied far more often than others. The indicators (and their measurement units) used to assess each type of effect were variable, indicating a potential lack of measurement consistency.
Table 3. Summary of environmental indicator types by subcategory, including the number of recorded indicators (in parentheses), overall rank in terms of the number of recorded indicators, the number of unique indicators, and the diversity (S–W) of indicators for each indicator type. Indicator types are sorted in order of increasing diversity within each subcategory.
| Subcategory | Type | Rank (recorded) | Unique indicators | Indicator diversity |
|---|---|---|---|---|
| Air (337) | NOx (44) | 3 | 3 | 0.29 |
| General emissions (24) | 7 | 3 | 0.34 | |
| Acidification potential (43) | 4 | 4 | 0.85 | |
| Ozone creation/smog (7) | 27 | 4 | 1.28 | |
| Particulate matter (23) | 8 | 6 | 1.38 | |
| GHG emissions (161) | 1 | 12 | 1.58 | |
| Ozone depletion potential (10) | 21 | 6 | 1.75 | |
| Aggregated emissions (8) | 26 | 7 | 1.91 | |
| Other emissions (17) | 11 | 11 | 2.23 | |
| Land (119) | Landscape pattern (2) | 37 | 1 | 0.00 |
| Terrestrial toxicity (4) | 32 | 2 | 0.30 | |
| Land area (88) | 2 | 9 | 0.79 | |
| Landscape quality (17) | 11 | 4 | 0.96 | |
| Soil quality (8) | 26 | 4 | 1.21 | |
| Other (81) | Noise (11) | 18 | 1 | 0.00 |
| Odor (2) | 37 | 1 | 0.00 | |
| Radioactivity (4) | 32 | 2 | 0.56 | |
| Climate (2) | 37 | 2 | 0.69 | |
| Other environmental (2) | 37 | 2 | 0.69 | |
| General environmental effect (42) | 5 | 9 | 1.07 | |
| General toxicity (4) | 32 | 4 | 1.39 | |
| Environmental management/policy (14) | 13 | 10 | 2.24 | |
| Resources (76) | Overall resources (9) | 22 | 3 | 0.68 |
| Biomass (5) | 29 | 3 | 1.05 | |
| Crops (5) | 29 | 3 | 1.05 | |
| Fossil fuels (37) | 6 | 7 | 1.54 | |
| Species (8) | 26 | 5 | 1.56 | |
| Minerals (12) | 15 | 10 | 2.25 | |
| Waste (33) | Overall waste (12) | 15 | 1 | 0.00 |
| Toxic/radioactive waste (10) | 21 | 2 | 0.50 | |
| Solid waste (11) | 18 | 3 | 0.60 | |
| Water (68) | General water (3) | 33 | 1 | 0.00 |
| General water quality (10) | 21 | 1 | 0.00 | |
| Water quantity (22) | 9 | 2 | 0.18 | |
| Aquatic toxicity (11) | 18 | 3 | 0.80 | |
| Eutrophication potential (14) | 13 | 8 | 1.83 | |
| Other water quality (8) | 26 | 8 | 2.08 |
Of recorded environmental indicators (n = 714), air quality indicators were the most frequently applied (47%), followed by indicators of land effects (17%). The most frequently applied indicator type by far was greenhouse gas emissions (n = 166), making up 23% of all environmental indicators and 48% of the air quality subcategory. Indicators of land area (n = 88) were also frequently used. These results are similar to those reported by Pang et al [20] who found that greenhouse gas emissions and other air pollutants were the primary environmental effects measured using energy system models; we also observed analogous trends across social/economic and technical indicators, where cost and efficiency indicators, respectively, dominated the spectrum, leaving other indicators underrepresented. Waste indicators were rarest among the reviewed studies.
We used unique instances of the indicator name to calculate the diversity index for indicator types; this index accounts for differences in naming conventions across studies but does not include variation in measurement units. Diversity at the level of indicator type indicates the overall level of consistency used to quantify a specific effect, with greater diversity equating to more indicator types applied less consistently. Diversity of environmental indicators by type was greatest among resource and air quality subcategories (average diversity4 = 1.36 and 1.17, respectively). Land (average diversity = 0.65), water (average diversity = 0.56), and waste (average diversity = 0.37) indicator types were less diverse. Low diversity indices indicated that direct effects such as those on water quantity, noise, or waste production were generally characterized using a small and consistent set of indicators. However, more complicated, environmental quality-related effects (e.g. ozone depletion potential, eutrophication potential, landscape quality, and toxicity) were quantified using a less consistent set of indicators. This may reflect the relative complexity of quantifying these quality-related effects.
Specific measurement units used to quantify indicators can also affect the comparability of results across different studies. We found 167 unique environmental indicators quantified using 418 different quantitative (n = 320) or qualitative measurement units (supplemental info—S5). For example, there were only four unique acidification potential indicators of 43 total recorded (direct SO2 emissions, SO2 equivalent emissions, all sulfur oxide emissions, and SO2 emissions reductions), resulting in a relatively low indicator diversity for this indicator type. However, there were 28 different measurement units used to quantify those four indicators (S5), potentially making comparisons across studies a challenge. Of the quantitative measurements, 52% (n = 165) estimated effect per unit of energy produced (e.g. kg CO2/kWh). In these cases, conversions may be possible to allow common units of measurement across energy types.
3.4. Application of indicators across energy sources and continents
Each indicator type was represented across multiple energy sources and, in some cases, across multiple continents; a single recorded indicator may have been applied to multiple sources or continents in a single study. We refer to these as 'indicator instances,' where the total number of instances is equal to the number of recorded indicators multiplied by the number of energy sources or continents where the indicator was applied.
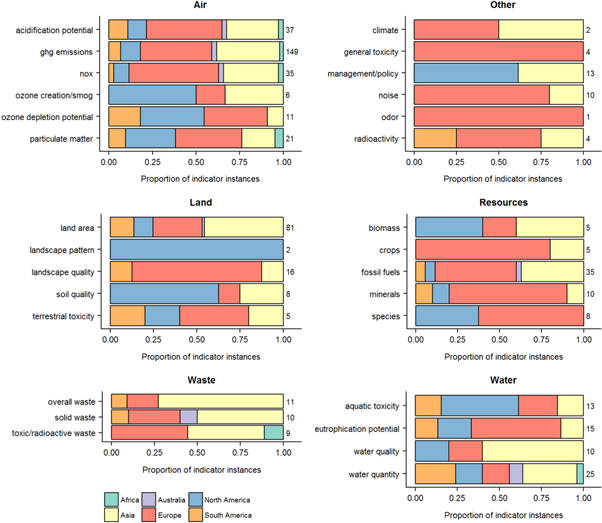
Many of the environmental indicator types were well represented across energy sources (figure 4), although we again note that the indicators and measurements units within these types were diverse (sections 3.3 and S5). Several indicator types lacked application to wave and tidal energy sources, which were generally not well represented in the reviewed studies. Landscape pattern indicators were underrepresented across sources—only being applied to wind, oil/gas, and bioenergy—and among land indicators overall. Emphasis on wind and oil/gas may stem from known effects of these developments on road network expansion which can cause landscape fragmentation [44], while bioenergy development has broader overall effects on land use [3, 45]. Other sources may seemingly have limited influence on landscape pattern, but the effects of electricity transmission lines from any source should be considered due to the extensive linear features they create [46].

Figure 4. The representation of environmental indicator types across energy sources for each indicator subcategory, shown as the proportion of total indicator instances (total instances labeled for each bar at right). Note that the total number of indicator instances does not depict the number of indicators recorded, as a single recorded indicator could have multiple instances if applied to multiple energy sources in a single study.
Download figure:
Standard image High-resolution imageEnvironmental indicator types were less well represented across continents (figure 5). Studies in Europe and Asia captured the broadest range of indicator types, and studies in Africa and Australia had a narrower focus, with North and South America falling in between. Few indicators had been quantified for all regions. Applications of species indicators were notably lacking in Asia while indicators of landscape quality were absent from North America, Africa, and Australia, and indicators of landscape pattern were only applied in North America. Indicators of noise, odor, and effects on crops were only applied for Europe and Asia. Potential geographic variation in effects due to differences in environmental and social systems underscores the importance of quantifying effects in different regions [13]. In cases where indicators are not geographically transferable, lack of indicator application may leave some regions underprepared to quantify effects and assess tradeoffs.
Figure 5. The representation of environmental indicator types across continents for each indicator subcategory, shown as the proportion of total indicator instances (total instances labeled for each bar at right). Note that the total number of indicator instances does not depict the number of indicators recorded, as a single recorded indicator could have multiple instances if applied to multiple continents in a single study.
Download figure:
Standard image High-resolution image
3.5. Comprehensiveness of environmental indicators
The environmental indicators we identified covered a wide range of energy effects. A review of the environmental effects of energy by Dincer [1] summarized 11 main areas of effect including major environmental accidents, water pollution, maritime pollution, land use and siting effect, radiation and radioactivity, solid waste disposal, hazardous air pollutants, ambient air quality, acid rain, ozone depletion, and global climate change. The indicators in this review covered some aspect of each of these effect areas, however the degree to which effects were addressed and consistently applied across energy sources was highly variable. Additionally, some effects noted in previous reviews went completely overlooked in the studies reviewed here. For example, in a summary of the effects of wind and oil/gas development, Jones et al [44] included habitat loss and fragmentation, noise pollution, wildlife mortality, light pollution, introduction of invasive species, carbon stock loss, impervious surfaces, and water consumption. Our review returned no indicators that addressed invasive species, light pollution, wildlife mortality, or carbon stock loss.
Overall, air quality indicators provided relatively broad coverage of known energy effects, addressing other types of emissions in addition to greenhouse gases (e.g. acidifying emissions, particulate matter). Some emission types were difficult to categorize due to multiple effects stemming from the same pollutant. For example, NOx emissions can contribute to smog formation and greenhouse gas emissions, so we categorized NOx emissions as a single distinct indicator type. Some emissions indicators were not frequently applied; many of these were grouped among our 'other emissions' type, including mercury, general non-methane volatile organic compounds, lead, and nitrous oxides. These indicators may deserve further attention in future studies. Some studies also aggregated multiple types of emissions, which allows a synthetic assessment but can make it more challenging to tease apart individual effects if they are not reported. Air quality indicator types had mixed levels of consistency; ozone/smog creation and particulate matter indicator types were more consistent than indicators of greenhouse gas emissions and ozone depletion.
Indicators that addressed energy effects on terrestrial systems (land subcategory) focused heavily on land area, with a fair number also focused on landscape quality. Land area alone is an insufficient indicator of the effects of energy development on landscapes. Many types of energy development generate linear disturbances such as pipelines and roads that can have additional detrimental effects, particularly on wildlife, that go beyond the surface disturbance caused by those features [46]. However, only two indicators were recorded that focused on landscape patterns and none mentioned roads specifically despite their well-documented effects [47, 48]. Also underrepresented were effects on soils and terrestrial toxicity. The permanence of landscape effects (e.g. reversibility of effects, life cycle of the source) also varies across energy sources [49] but was not mentioned by any of the indicators in the review. While the land indicators applied were relatively consistent (low S–W diversity), fully understanding and comparing effects of energy sources on landscapes require the inclusion of indicators that capture a broader view of the landscape than a simple land area metric.
Indicators examining aspects of water and other natural resources were less well represented overall. Among water indicators, water quantity, aquatic toxicity, and eutrophication potential indicators were most frequently applied. Water quality indicators were somewhat inconsistent, particularly in terms of eutrophication and other effects such as water flow and temperature changes. These areas would benefit from additional attention and standardization, when possible. One notable environmental effect on water quality that was missing from the review was mercury contamination, of primary concern in hydropower systems [50] and a potential contaminant in wastewater from geothermal power [51]. Mercury is also emitted during the burning of fossil fuels, yet only one recorded indicator specifically focused on mercury emissions. Heavy metals were not generally well represented among the indicators. Other natural resources used during, or affected by, energy development were also not extensively evaluated by the indicators. Most of these indicators focused on quantity of fossil fuel use, with some limited examination of effects on crops, biomass, and other mineral resources. Indicators of effects on mineral resources varied widely (high diversity and many unique indicators).
Indicators representing effects on waste were uncommon, but those recorded were relatively consistent. Indicators reflecting toxic wastes may also be captured by air and water quality indicators. For example, water quality indicators may be based on potential risk posed by chemical wastes from energy production. Precisely defining the indicators and the specific cause of the effects identified, as well as taking a life-cycle approach to energy effect analysis, would improve transparency in effects captured. Effects captured by the reviewed indicators grouped in the 'other environmental' subcategory included noise, odor, and radioactivity. These indicators were consistent but were not frequently applied. Noise and odor were frequently assessed qualitatively; therefore, despite their consistencies, indicators for these effects may have limited use for quantitative comparisons among energy sources.
Notably, indicators of effects to species and biodiversity were limited and indicators of direct wildlife mortality were entirely lacking. Energy development can have both direct and indirect effects on species [8]. Direct effects are immediate, such as bird fatalities from wind turbine blades, or fish mortality in hydroelectric turbines, while indirect effects happen through secondary processes and effects [52] (e.g. roads, pipelines, and pads from oil wells causing habitat loss and fragmentation, which may then affect species populations [44]). Our review suggests that indicators related to indirect effects, such as land area, landscape pattern, and water quality, may be useful as measures of energy effect on biodiversity, while indicators of direct effects on species are rare. In fact, although there are well known direct wildlife mortality effects from energy production [8], we found no indicators that were applied to comparisons of these effects among energy sources. This may be due to the lack of wildlife mortality studies for most energy sources and inconsistencies in how mortality indicators are applied [53]. Only eight recorded indicators addressed species losses and these focused primarily on biodiversity and species populations. The indicators themselves were also relatively inconsistent. One option for advancing biodiversity indicators could be to standardize them as much as possible. For example, instead of generating a list of all possible species affected, emphasis could be placed on estimating direct and indirect effects to a subset of high-importance species, such as those that are threatened, endangered, harvested for recreation or subsistence, or otherwise of substantial ecological, cultural, and/or economic value.
3.6. Review limitations and caveats
Several limitations may have influenced the results of our literature review. We frequently found ambiguity in indicator descriptions and definitions as described in the reviewed papers. For example, some indicators were described by name only, without any definition or reference to further explain what the indicator was meant to represent. Based on our review of similar works, we used our best judgment to name and categorize these indicators, although some uncertainty surely exists in these interpretations. Similar issues were found in descriptions of measurement units; some studies listed precise units for the indicators, while other were ambiguous. These issues not only affected our review but represent a significant general limitation across the energy indicators literature. Without transparent definitions and methods, reproducing results and applying those results in future comparisons of energy sources will be impossible and may contribute to further disagreements regarding optimal energy futures [54–59].
Our overall analysis and interpretation of the reviewed indicators were also largely dependent on the classification scheme we applied. While we believe we identified indicator types that were representative of the literature we reviewed, we expect the results could be somewhat different if alternative categories and types were chosen to classify the recorded indicators. We do not expect, however, that such differences would affect our conclusions regarding the comprehensiveness and consistency of the indicators applied. Further, while our literature search was thorough and transparent, we acknowledge that our reviewed articles were not an exhaustive account of the research in this area, but rather a representative sample of studies focusing on environmental effects of energy sources. We also note that our search criteria excluded studies that only examined a single energy source; review of studies using indicators to quantify effects from single sources could reveal additional indicators relevant to multicriteria energy systems analysis.
3.7. Recommendations for indicators
Our review suggests many environmental indicator types were applied across most, if not all, of the nine energy sources we analyzed. Of the 33 indicator types in figure 4, 22 were applied across all nine energy sources, while 10 of the remaining indicators were only missing applications for ocean wave and tidal power. On the surface, this promising result suggests a large suite of environmental indicators could be used to compare energy sources. However, the diversity indices indicate considerable inconsistency in the actual indicator used within an indicator type, and the variation in measurement units suggests that comparisons across energy sources are currently difficult for at least some environmental effects.
While we recognize that the choice of indicators, methods of estimation, and analysis approaches may depend on the energy system, the particular spatiotemporal context, and the question or decision being addressed, our review leads us to make a number of general recommendations for 'best practices' when selecting and using indicators of energy's environmental effects.
Best Practice #1. Clearly define the indicator(s) being used.
A surprisingly high number of studies simply named an indicator but never described what it measured, how it was estimated, and the units of measurement. This lack of transparency weakens the individual study and also limits its contribution to comparisons of results across studies, including in literature syntheses such as ours.
Best Practice #2. Clearly define methods and information sources.
While our review was not focused on reviewing the methods used for quantifying effects, a lack of specificity was apparent among some of the reviewed papers. For example, we attempted to record whether the study obtained the data for quantifying indicators from a life-cycle analysis, but this was not possible as many papers did not indicate their methods or cite information sources. Results of effect analyses conducted using indicators will vary depending on the data used to make the estimates, including the time period and location of data collection, the characteristics of the broader energy system, the technical specifications of the energy source (e.g. wind turbine height or capacity), and the accounting methods (e.g. whether the data were collected using life-cycle analysis). These factors need to be considered when conducting comparisons and therefore need to be explicitly defined.
Best Practice #3. Use quantitative indicators when possible.
In our review, 42.5% of the 1902 indicators were qualitative. While qualitative variables have merit in certain instances and are sometimes unavoidable, they are often measured without units, which greatly limits comparisons of results to other studies. Using qualitative indicators exacerbates issues associated with best practices #1 and #2; in addition, qualitive variables often have no associated measure of uncertainty, which can hinder harmonization approaches and limit their utility in decision making contexts.
Best Practice #4. For multicriteria indices, identify constituent indicators and follow best practices 1–3.
Synthetic, multicriteria indices (e.g. a sustainability index) are useful because they condense information from multiple indicators into a single value. However, understanding and applying multicriteria indices is challenging when the separate indicators used to create them are not clearly reported and measured. The indicators and their weights should be transparent and sufficiently described such that the index is reproducible and the underlying indicator values can be determined.
3.8. Future directions for comparisons of environmental effects among energy systems
Peters [60] criticized the fields of ecology and environmental science for putting forth unanswerable questions. At first consideration, asking if one energy source has a bigger environmental effect than another may seem to be an unanswerable question because energy systems are complex, and the effects of a technology and energy source depend on the social-ecological system within which it functions. Nonetheless, comparisons of specific environmental effects across energy systems (e.g. the amount of water used or the number of wildlife killed) can begin to help countries, cities, and other entities make decisions, analyze tradeoffs among energy systems, and plan the development of energy infrastructure in ways that balance production with minimization of undesirable effects. Our review suggests a broad community of scientists is actively moving toward such comparisons, and our recommended best practices suggest next steps to generate better and more efficient comparisons.
Our review also suggests areas for future research that will improve our ability to understand how energy systems effect, and interact with, the environment.
3.8.1. Standardize indicators to the extent possible
Our analysis showed high levels of variability in both the indicators used to assess the same effect and the units of measure for the same indicator. If practitioners in the energy-environment nexus seek to incorporate information about comparisons across energy sources, or across energy systems with the same underlying energy source, then standardization of the indicators and measurement units will be necessary. Attempts to standardize effect measurement, such as efforts to review and harmonize indicators from specific energy sources [16, 61] will be even more valuable and applicable if the same indicator is standardized across energy types. For example, Whitaker et al [62] and Hsu et al [63] both harmonized CO2-eq/kWh for coal-fired and photovoltaic energy sources respectively as part of the Life Cycle Assessment Harmonization Project [61].
While we encourage increased standardization of energy indicators, we also recognize the limitations encountered when attempting to compare the effects of energy development across sources. Quantifying energy development effects across a wide range of social, economic, and environmental effects is a daunting task, particularly when research describing those effects may be lacking. The resources available to researchers can limit the number of indicators that can be applied, in which case it is likely that those perceived as most relevant and quantifiable for a particular case will be chosen. Ultimately, energy systems and environmental science research, management, and policy may benefit if key professional societies from each field collaboratively develop a list of core indicators and preferred units of measure.
3.8.2. Develop an energy-environment data repository
Many researchers agree that the rise of global, open-access data repositories can and have advanced science [64]. A well-structured repository focused on energy-environment interactions would allow rapid access to the types of information we spent months gathering and synthesizing, make meta-analyses possible, and increase the efficiency of harmonization studies. This database should include both single and multi-energy source studies and life-cycle studies on energy effects. This would facilitate synthesis of single energy source indicators across multiple energy sources. It would also generate transparency when controversies arise because the data associated with a study could be easily found. As an example, the data and results of the LCA Harmonization Project are freely available online at https://openei.org/apps/LCA/ [61].
3.8.3. Synthesize studies of environmental responses to energy
We surmise that the lack of application of certain indicators could be caused in part by the unique manner in which different energy sources affect the environment. This may be most apparent when considering effects on wildlife species. For example, when considering effects of wildlife collisions with energy infrastructure, hydropower is most likely to affect fish (via collisions with hydropower turbines at dams), while wind energy is most likely to affect birds and bats (via collisions with wind turbines). Furthermore, even when affecting similar terrestrial ecosystems, different energy sources may be located in different areas and thus affect a different suite of species. Thus, consistently measuring and comparing effects of energy sources on biodiversity, species, or other source and location specific effects, is challenging.
While we can, with some certainty, estimate kilograms of CO2 per unit of energy produced, currently available methods limit the accurate estimation of numbers of raptors, fish, and other taxa killed per unit of energy produced [53]. Likewise, land-cover change associated with energy production is reasonably well measured, but the effects of wildlife habitat loss associated with land-cover change varies greatly across the globe, resulting in variable effects on biodiversity. Ecologists are studying species responses to energy development and patterns of response and hypothesized mechanisms are beginning to emerge in some cases. However, more research in this area is needed, including syntheses of the results of field studies into robust metrics that can be used in energy system analyses, which could be facilitated by an energy-environment data repository.
3.8.4. Establish frameworks for comparison
Some of the disagreements about future energy mixes likely stem from differences in how effects are measured and an emphasis on certain effects over others. For example, Brook and Bradshaw [65] considered land use, costs, and emissions when comparing energy types, while detractors disagreed with some of their estimates (a standardization issue) and emphasized different indicators, such as the environmental effects of radioactivity [66, 67]. Disagreements also exist around Jacobsen's recommendations for renewable energy adoption [68, 69]. This debate largely stems from differences of opinion regarding how to perform the analyses and what effects of renewables to measure [58, 70]. Resolution of these debates will likely require acceptance of a framework (a combination of methods and choice of indicators) that is accepted by the majority of the community of practice and research.
Considering energy systems within the conceptual framework of socio-ecological systems is one potential option [71]. Energy systems already include energy resources, technologies, and socio-economic processes, while socio-ecological systems more explicitly include governance systems, and actors, in addition to resource systems (energy, water, air, land, biodiversity) and their units [72]. Considering energy in the context of socio-ecological systems may generate new insights, such as the role of policies affecting household consumption, energy demand, and climate change [73–75].
4. Conclusions
To facilitate comprehensive comparisons of the environmental effects of energy systems and sources, indicators must be applied using a standard set of effects, definitions, and measurements applied across all sources. While we found that many of the environmental effects of energy development were analyzed across multiple sources, they were frequently interpreted and applied in ways that cannot be easily compared, and some effects were not assessed commonly or consistently. We also found an emphasis on applying indicators to renewable energy sources; including current and potential energy sources, renewable and nonrenewable, is essential to analyze the full suite of tradeoffs among energy sources and systems and to minimize adverse effects. We hope that drawing attention to recommended best practices and future research will facilitate improved selection and application of indicators and support decision making regarding future energy development strategies in diverse landscapes.
Acknowledgments
Any use of trade, product, or firm names is for descriptive purposes only and does not imply endorsement by the US Government. We thank M Merrill for aiding in the development of this work, S Beck for feedback on the manuscript, and J Havens for assistance with figure 3. We also thank three anonymous reviewers for their comments which led to a substantially improved manuscript. This research was funded by the US Geological Survey Energy Resources and Land Change Science Programs, and SRL received additional support from NIFA and USDA Hatch Grant funds administered by the Oklahoma Agricultural Experiment Station (OKL0-2915). The authors declare no conflicts of interest.
Data availability statement
Any data that support the findings of this study are included within the article (see supplemental information).
Footnotes
- 4
Average diversity calculations at the subcategory level do not include indicator types labeled 'other' as these were intended as catchall categories and therefore were intentionally diverse.