

Abstract
Reducing greenhouse gas (GHG) emissions from agriculture has become a critical target in national climate change policies. More than 80% of the countries in Sub-Saharan Africa (SSA) refer to the reduction of agricultural emissions, including livestock, in their nationally determined contribution (NDC) to mitigate climate change. The livestock sector in Kenya contributes largely to the gross domestic product and to GHG emissions from the land use sector. The government has recently pledged in its NDC to curb total GHG emissions by 30% by 2030. Quantifying and linking the mitigation potential of farm practices to national targets is required to support realistically the implementation of NDCs. Improvements in feed and manure management represent promising mitigation options for dairy production. This study aimed (i) to assess mitigation and food production benefits of feed and manure management scenarios, including land use changes covering Kenya's entire dairy production region and (ii) to analyse the contribution of these practices to national targets on milk production and mitigation, and their biophysical feasibility given the availability of arable land. The results indicate that improving forage quality by increasing the use of Napier grass and supplementing dairy concentrates supports Kenya's NDC target, reduces emission intensities by 26%–31%, partially achieves the national milk productivity target for 2030 by 38%–41%, and shows high feasibility given the availability of arable land. Covering manure heaps may reduce emissions from manure management by 68%. In contrast, including maize silage in cattle diets would not reduce emission intensities due to the risk of ten-fold higher emissions from the conversion of land required to grow additional maize. The shortage of arable land may render the implementation of these improved feed practices largely infeasible. This assessment provides the first quantitative estimates of the potential of feed intensification and manure management to mitigate GHG emissions and to increase milk yields at sectoral-level and at a high spatial resolution for an SSA country. The scientific evidence is tailored to support actual policy and decision-making processes at the national level, such as 'Nationally Appropriate Mitigation Actions'. Linking feed intensification and manure management strategies with spatially-explicit estimates of mitigation and food production to national targets may help the sector to access climate financing while contributing to food security.
Export citation and abstract BibTeX RIS

Original content from this work may be used under the terms of the Creative Commons Attribution 3.0 licence.
Any further distribution of this work must maintain attribution to the author(s) and the title of the work, journal citation and DOI.
1. Introduction
Greenhouse gas (GHG) emissions from 'Agriculture, Forestry and Other Land Uses' (AFOLU) are estimated to contribute 24% of total anthropogenic GHG emissions (Smith et al 2014). The global livestock production as a sub-sector of AFOLU emits between 10%–14.5% of total GHG emissions, of which 4% are due to dairy production (Gerber et al 2010, 2013, Westhoek et al 2011). Total GHG emissions from dairy production are projected to increase by 82% under 'business as usual' (BAU) trajectories until 2050 compared to 2000, as production expands to keep up with the milk demand of a growing human population (O'Mara 2011).
Current food insecurity in many low-income countries, especially in Sub-Saharan Africa (SSA), and sustained population growth call for assessments that contribute to both the mitigation of AFOLU emissions and the improvement of food provisioning from agricultural systems (Smith et al 2013). The development of schemes that mitigate AFOLU emissions such as 'Nationally Appropriate Mitigation Actions' (NAMAs) have recently gained attention from governments that ratified the Paris climate agreement under the 'United Nations Framework Convention on Climate Change' (Grassi et al 2017, UNFCCC 2011). Countries express their mitigation targets in the 'Nationally Determined Contributions' (NDCs). Kenya's NDC targets to limit the increase in total GHG emissions projected in the national BAU scenario by 30% between the base year of 2010 and 2030 (Government of Kenya 2015b). Reliable estimates of sectoral baseline emissions and effective mitigation options are still missing and required urgently to develop NAMAs that help achieve the NDC targets. Focussing on livestock production in Kenya is highly relevant since it is responsible for about 30% of its total GHG emissions and contributes about 45% to the agricultural gross domestic product (Government of Kenya 2015a, McDermott et al 2010).
The dairy sector in Kenya sustains the livelihood of about two million smallholder households, who contribute approximately 80% to the 3.4 Mt of milk produced in the country (Udo et al 2016). In addition, dairy products supply a range of valuable nutrients and therefore contribute to the human population health. Culturally, milk is a vital component of agro-pastoralists diets in East Africa (Rufino et al 2013). The population of dairy cattle has increased by about 31% to 4.3 M heads from 1998–2014 (Government of Kenya 2014, Muriuki 2011), whereas feed inputs for dairy cattle have increased by about 32% from 1998–2006 (Muriuki 2011). Increased animal numbers and the additional demand for feeds contribute largely to emissions of non-carbon dioxide GHGs, namely methane (CH4) and nitrous oxide (N2O) through enteric fermentation, manure and soil management. In addition, the trend of increasing livestock numbers leads to emissions from degraded rangelands and forests (Bosire et al 2016, Kumar et al 2009, O'Mara 2011).
The dairy sector has to increase production sustainably by 2030 to be able to meet the projected milk demand estimated in the national policy framework for the development of the dairy sector, called 'Kenya's national dairy master plan' (Government of Kenya 2010). Several initiatives such as the East Africa Dairy Development program, the Smallholder Dairy Commercialization Programme supported by the International Fund for Agricultural Development (IFAD) and the Kenya Dairy Sector Competitiveness Program supported by the United States Agency for International Development are actively engaged in the development of the dairy sector in East Africa. These initiatives are increasingly looking for development outcomes that realise climate change mitigation benefits at the same time. A challenge to realise the projected growth of the dairy sector is that to date, a large share of cattle diets consists of low quality roughage from overstocked grazing land and crop residues (McDermott et al 2010). Improving feed quality is needed to increase milk yields (Lukuyu et al 2012). However, the conversion of land to grow higher quality fodder and the GHG emissions resulting from land use change (LUC) may compromise expected reductions from changes in feeding practices advocated in national policies (Valin et al 2013). In addition, the shortage of arable land may constrain the implementation of feeding practices that increase the demand for cropland.
This study aimed to answer the question: to what extent the improvement of feed quality and manure management may contribute to the milk productivity target of Kenya's national dairy master plan and to the national mitigation target (NDC) given the availability of arable land. The objectives were: i) to quantify total GHG emissions and GHG emission intensities under current feed and manure management conditions, and alternative feed intensification scenarios, including manure management, ii) to assess the potential of these scenarios to meet the national targets and the biophysical feasibility to implement the practices, and iii) to map total baseline GHG emissions, milk production, and the potential changes for the dairy sector. Such analyses are relevant to inform the development of climate mitigation policies.
2. Material and methods
2.1. Study area
The main dairy region of Kenya is characterized by rainfed (71%) and irrigated (29%) mixed crop-livestock production systems covering the Central and Western highlands as well as humid areas in the West of Kenya with an area of approximately 65 000 km2 and 24 counties (figure S1 available at stacks.iop.org/ERL/13/034016/mmedia). The delineation of the study area was based on Herrero et al (2014) who assessed smallholder development trajectories in mixed crop-dairy production systems. Dairy production takes place in a region with high agricultural potential, where about 68% of the total human population lives (Herrero et al 2014). Typical smallholder farms are small with an average size of 0.47 ha (Lowder et al 2014).
2.2. Calculating GHG emissions and milk production
The emission source categories (IPCC 2006) included in this analysis are: CH4 emissions from enteric fermentation, CH4 emissions from manure management, direct and indirect N2O emissions from manure management, direct and indirect N2O emissions from managed soils, and N2O and carbon dioxide (CO2) emissions from LUC converting grazing land to cropland using data from Don et al (2011) and Hengl et al (2015). This study followed the IPCC tier 2 approach for most categories. For a detailed description of emission parameters see table S1. All emission source categories were quantified separately for dairy cattle using a classification of livestock production systems (LPS, figure S2): mixed rainfed system in arid areas (MRA), mixed rainfed system in humid areas (MRH), mixed rainfed system in tropical highlands (MRH), mixed irrigated system in arid areas (MIA), mixed irrigated system in humid areas (MIH) and the mixed irrigated system in tropical highlands (MIT). This LPS classification, developed by Robinson et al (2011), has been used to analyse different environmental and economic aspects of livestock production (Herrero et al 2013, Rufino et al 2014, Thornton and Herrero 2010). GHG emissions that result from dairy concentrate supplementation, including the cultivation of feed ingredients were calculated using an emission factor from Weiler et al (2014). This factor was used in a dairy life cycle assessment at farm level in the Kenyan highlands, assuming that the concentrate ingredients originate from Kenya and Uganda (table S1).
Conversion factors (expressed as CO2 equivalents) for CH4 and N2O were applied according to the most recent global warming potentials (GWP) from the 5th assessment report of the Intergovernmental Panel on Climate Change (IPCC 2014). GHG emissions are reported as total GHG emissions and emission intensities. The later notion is expressed on product basis and converted into kg CO2eq per kg fat and protein corrected milk (FPCM). Both notions were selected to relate the mitigation potential of the scenarios to the NDC target (total emissions) and to communicate efficiency gains for each scenario, relevant for a NAMA (emission intensity).
2.3. The Livestock Simulator: LivSim
The dynamic production model LivSim was used to simulate milk yields, and faecal and urine excretion for individual dairy cattle on a monthly basis (Rufino et al 2009). The HeapSim model, coupled with LivSim, was used to integrate the dynamics of manure decomposition during storage, including the nutrient losses, and manure application (Rufino et al 2007). For more model details see figure S3. LivSim was extended with a GHG emission module to compute GHG emissions from the different source categories (table S1) following IPCC (2006). The models were run using the open source language for numerical computations GNU Octave (v.4.0) (Eaton et al 2015). Each run simulated a dairy cow over the maximum lifetime of 13 years and was replicated 100 times for each LPS to account for stochasticity in calving and mortality.
LivSim was calibrated with information derived from literature and feed datasets (Anindo et al 1994, Castellanos-Navarrete et al 2015, Herrero et al 2013, Katiku et al 2011, Rufino et al 2009, Weiler et al 2014), cattle breeds and emission parameters (Herrero et al 2013, IPCC 2006, Kategile et al 1985, Monfreda et al 2008, Potter et al 2010, Rufino et al 2009, Stares et al 1991) representing the baseline conditions for each LPS in Central and Western Kenya (table S1).
Emission uncertainties were estimated using a twofold approach. First, Latin hypercube sampling (LHS) (Xu et al 2005) was applied to the baseline simulations sampling the ranges of 23 emission parameters. One parameter at a time was sampled through LHS while keeping all others constant at the mean of their ranges (ten Broeke et al 2016) (table S1). Second, the emission uncertainties of the modelled scenarios were calculated one parameter at a time sampling at the minimum and the maximum of the parameter ranges.
2.4. Spatial upscaling of GHG emissions and milk production
Spatially-explicit datasets on LPS and cattle density, at a spatial resolution of 1 × 1 km per grid cell (Robinson et al 2011, 2014), were used to upscale and to map output tables of GHG emissions and milk production derived from LivSim (figure 1). Since this study focused on GHG emissions from dairy production, the density of dairy cattle was calculated using sub-national county level data on cattle types excluding cattle used for beef production (Government of Kenya 2014). Moreover, herd composition data were applied to reflect the proportion of productive and non-productive animals in dairy herds according to Bebe et al (2002). The spatial upscaling procedure was implemented using the statistical computing language R (v. 3.2.3), including the R library 'raster' (v. 2.5) (Hijmans 2016, R Core Team 2015). Feeds were assumed to be grown locally within one grid cell. Therefore, no transport emissions were included.

Figure 1. Flowchart shows the model framework applied in this study consisting of a dynamic livestock modelling approach to compute output tables of GHG emissions and milk production. Subsequently, these tables were upscaled based on livestock production systems and mapped using data on herd composition, cattle category and density.
Download figure:
Standard image High-resolution image2.5. Feed and manure management
2.5.1. Baseline feeds
Feed composition and quantity data used to model the baseline reflected typical diets for dairy cattle kept by smallholders across the Kenyan highlands. Feed data were obtained from Castellanos-Navarrete et al (2015), Herrero et al (2013), Katiku et al (2011), Rufino et al (2009), Weiler et al (2014). Agro-climatic conditions present in the various LPS used were taken into account leading to differences in dry matter intake (DMI). Annual DMI ranged between 2414–2475 kg per tropical livestock unit (TLU). The baseline diet was composed of native grass from grazing land (36%–52%), Napier grass (Pennisetum purpureum) (24%–42%), maize stover (21%–27%), and dairy concentrate (1%) (table S2). Feed quality data, including quality differences due to seasonal variation were derived from Rufino et al (2009) and from the 'Sub-Saharan Africa feed composition database' (Anindo et al 1994).
2.5.2. Feed intensification scenarios
Feeds with high energy and protein density increase feed digestibility and milk yields (Hristov et al 2013a). Thus, using these feeds would reduce the demand for feeds from the low productivity and low quality natural pastures. Dairy farming in Kenya relies primarily on these natural pastures as main source of feed. Different regional estimates show that 41%–90% of the dairy farmers use native grass as main feed resource (Katiku et al 2011 Lukuyu et al 2011, Njarui et al 2011). Feeds of high quality pass the rumen faster, which reduces anaerobic fermentation and methanogenesis due to post ruminal digestion and, thus, results in lower production of CH4 (Eckard et al 2010, Knapp et al 2014). Highly degradable feedstuffs with high protein and starch contents reduce ruminal pH and shift the fermentation process from acetate to propionate formation increasing the consumption of H2, which is consequently unavailable for CH4 production (Dijkstra et al 2011, Soren et al 2015). However, increased protein content in diets may cause higher N excretion leading to potential trade-offs between CH4 and N2O emissions (Dijkstra et al 2011). Feed intensification scenarios developed in this study were based on plausible strategies that can improve milk yields and reduce GHG emission intensities:
Improved forage quality (Fo): Increasing forage digestibility improves the efficiency of milk production and can reduce CH4 emissions per unit FPCM ranging from 2.5%–21% (Boadi et al 2004, Knapp et al 2014, Trupa et al 2015). Napier grass is a perennial fodder crop with higher quality than native grass and is widely grown as fodder crop by dairy farmers in Kenya (Kariuki et al 1999, Muia et al 2001). It is estimated, that 21%–93% of the farmers plant Napier grass in the region (Katiku et al 2011, Lukuyu et al 2011, Njarui et al 2011). Hence, there is potential to increase the proportion of Napier grass in the dairy diet (Lukuyu et al 2012, Owen et al 2012).

Figure 2. Feed intensification scenarios based on combinations of three feed intensification strategies at medium and high level of intensification (DMI = dry matter intake). Dairy concentrates supplementation was increased during the first 150 d of lactation. For details on the baseline diet, see table S2.
Download figure:
Standard image High-resolution imageFeed conservation and increased grain content (Fe): Ensiling fresh fodder such as whole maize plants is proposed as feed conservation strategy for dairy farmers to reduce feed scarcity during the dry season (Lukuyu et al 2012). CH4 emissions can be reduced by up to 33% per unit FPCM replacing grasses with maize silage (Boadi et al 2004, Brask et al 2013, Chagunda et al 2010). Increasing the proportion of grain in the diet leads to higher starch concentration, lower fibre content and decreased ruminal pH, which reduces methanogenesis and CH4 emissions per unit feed (Beauchemin et al 2008, Dijkstra et al 2011). Crop residues such as maize stover are also commonly fed to dairy cattle by 33%–100% of the Kenyan dairy farmers (Katiku et al 2011, Njarui et al 2011). Since maize is an important food crop, additional maize and arable land are required to produce silage and to avoid compromising food security. The conversion of grazing land to cropland causes N2O and CO2 emissions, which are henceforth defined as emissions from LUC (de Boer et al 2011, Don et al 2011).
Dairy concentrates supplementation (Co): Higher proportion of concentrates in the diet especially during the first half of the lactation can increase milk productivity by 8%–37% (Agle et al 2010, Richards et al 2016). Higher concentrate proportion in the diet, replacing roughage can decrease CH4 emissions by 15%–39% (Chagunda et al 2010, Hristov et al 2013b, Knapp et al 2014). About 10%–88% of dairy farmers in Kenya supplement dairy concentrates, although at very low rates (Katiku et al 2011, Lukuyu et al 2011, Njarui et al 2011).
The scenarios were derived through combinations of the three feed intensification strategies (figure 2) and are henceforth called: 'forage quality and concentrate supplementation (FoCo)', 'feed conservation and concentrate supplementation (FeCo)', 'forage quality and feed conservation (FoFe)', and 'forage quality, feed conservation and concentrate supplementation (FoFeCo)'. Each scenario was developed at medium and high level of intensification (figure 2). For the Fo and Fe strategies, baseline feeds were replaced by 25% and 50% with higher quality alternatives. The supplementation of dairy concentrates was increased for the Co strategy by 3 and 6 kg day−1 during the first 150 d of lactation.
2.5.3. Manure management
Direct and indirect N2O emissions result from nitrification and denitrification of ammonium and nitrate contained in manure, the leaching of nitrate, and the volatilization of ammonia (NH3) (IPCC 2006). Manure management can prevent the loss of N during the storage. Manure that is rich in nutrients can be used to improve soil fertility and farm productivity (Tittonell et al 2009, 2010). Covering manure heaps can reduce leaching and volatilization and, thus, N2O and NH3 emissions by about 30% and 90% respectively compared to uncovered heaps (Chadwick 2005, Hou et al 2015). However, CH4 emissions can be increased due to anaerobic conditions (Montes et al 2014). Covering heaps is considered a feasible practice for smallholders in SSA compared to other options such as the separation and cooling of slurry or anaerobic digestion (de Boer et al 2011). It is uncommon for smallholders to cover manure heaps (Tittonell et al 2010), thus uncovered heaps were assumed for the baseline (table S1). For all scenarios, the covering of heaps reduced the baseline factor for direct N2O emissions by about 1% for arid LPS and by about 0.25% in the humid and highland LPS. The volatilization and leaching fractions were lowered by 5% and 10% respectively, across LPS in relation to the baseline (IPCC 2006).
2.6. Scenarios, national targets and their biophysical feasibility
Feed intensification and manure management scenarios were analysed in terms of: (i) milk yield increases in relation to the dairy master plan target, (ii) total GHG emission increases and the NDC target, and iii) the demand for arable land. Scenario increases in milk yield (Xi) were re-scaled (0%–100%) to the baseline milk yields (Xmin) and the projected relative increase in milk yield per dairy cow between 2010–2030 (Xmax = dairy master plan target) using equation (1). Scenario increases in total GHG emissions (Xi) were re-scaled (0%–100%) to the baseline total GHG emissions (Xmin) and the projected relative increase in total GHG emissions between 2010–2030 (Xmax = national BAU scenario). The relative GHG emission increase of the BAU scenario and the tolerable increase according to the NDC target, which reduces the increase in total GHG emissions by 30% in relation to the BAU scenario, were calculated using SI equations (1–5).
Vres = re-scaled scenario values of increases in milk yield (%) and total GHG emissions (%)
Xi = original scenario values of increases in milk yield (%) and total GHG emissions (%)
Xmin = minimum values derived from the baseline model for milk yield and total GHG emissions representing 0%
Xmax = maximum values derived from the dairy master plan and Kenya's national BAU scenario representing 124.1% of milk yield increase and 95.9% of total emission increase between 2010–2030.
The biophysical feasibility of the scenarios was assessed comparing their demand for arable land and its availability. Only current grazing land was considered suitable for the conversion to grow Napier grass and maize, as the remaining forests in Kenya are protected and the expected GHG emissions from deforestation would be high (Carter et al 2015, Don et al 2011). A spatially-explicit dataset on current grazing land was used to analyse the availability of arable land for dairy cattle (Velthuizen et al 2007). The demand for cropland was calculated for each scenario based on the crop-specific feed intake per cow, density of dairy cattle, and expected yields per feed type (table S3, SI equations 6–7). The shortage of arable land was calculated for each scenario based on the proportion of grid cells, throughout the study area, where the demand for land exceeds the amount of grazing land available (minimum = 0%, maximum = 100%). The multivariate measure of Euclidean distances was calculated (Crawley 2007) to quantify how close each scenario approaches the theoretical optimum for the three dimensions included. The optimum is hereby defined as 100% milk yield increase, 0% total emission increase and 0% shortage of arable land.
3. Results
3.1. Effects of feed intensification and manure management on total GHG emissions and emission intensities
Across all scenarios, the simulations showed an average increase in total GHG emissions of 39.5% ± 23.0% (standard deviation, SD) per TLU compared to the baseline. The lowest increase was shown for the FoCo scenario at medium level of intensification and the highest increase was indicated for the FoFeCo scenario at high level of intensification. The increase in total emissions throughout the scenarios was largely caused by higher emissions from manure management (35.6% ± 32.9%), emissions from soils due to the cultivation of feeds including concentrates (206.1% ± 163.4%), and LUC emissions resulting from the conversion of grazing land to cropland (figure 3(a)). The increase in emissions from these sources outweighed the reduction of CH4 emissions from enteric fermentation (9.5% ± 6.7%) achieved through substituting low quality feed ingredients by higher quality alternatives. This effect was most pronounced for scenarios that included maize silage at high level of intensification. The reduction of CH4 emissions from enteric fermentation achieved in these scenarios was 11.2% ± 8.6%, whereas the increase of N2O emissions from feed cultivation (mainly dairy concentrates) was on average four times higher compared to the baseline. Feed conservation caused on average three times higher CO2 emissions from LUC compared to scenarios that did not include this strategy at high intensification level. Throughout the scenarios, the covering of manure heaps reduced the increase of related direct N2O emissions due to elevated N excretion on average by 77.0% ± 1.0% when compared scenarios without this management option. Indirect N2O emissions from N leaching and volatilization (NH3) were on average reduced by 15.3% ± 3.0%.
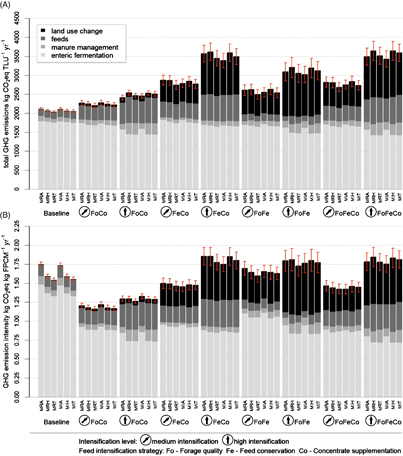
Figure 3. For the baseline and scenarios (a) shows total GHG emissions per TLU (tropical livestock unit) for different LPS (livestock production systems, figure S2) and (b) indicates GHG emission intensities per kg FPCM (fat and protein corrected milk). CH4 and N2O emissions were converted to kg CO2eq. Barplots represent (i) CH4 emissions from enteric fermentation, (ii) CH4 and N2O emissions from manure management, iii) N2O emissions from soils, including manure deposition on pasture, manure application to fodder crops, crop residues from fodder crops and fertilizer application to fodder crops and emissions from concentrate supplementation, and iv) N2O and CO2 emissions from land use change (LUC), including N mineralization and loss of soil organic carbon. Error bars indicate standard deviations of calculated total GHG emissions derived from Latin Hypercube Sampling (baseline) and sampling the minimum and maximum of the parameter ranges (scenarios).
Download figure:
Standard image High-resolution image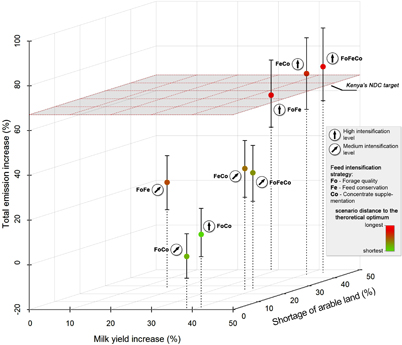
Figure 4. Scenarios (filled circles) are shown in 3 dimensional space marked by the increase in milk yield relative to the baseline and the milk yield target of Kenya's dairy master plan (x-axis), the increase of total GHG emissions in relation to the national BAU scenario of the NDC (y-axis), and the shortage of arable land (z-axis). Colours show the Euclidean distance of each scenario to the theoretical optimum (defined as 100% milk yield increase, 0% total emission increase and 0% shortage of arable land). The dark grey plane indicates the threshold of tolerable total emission increases according to the NDC target. X and z-axes are cut at 50% to improve visualization. Error bars reflect the range of relative emission increases due to the overall uncertainty in emission parameters at 95% confidence levels.
Download figure:
Standard image High-resolution image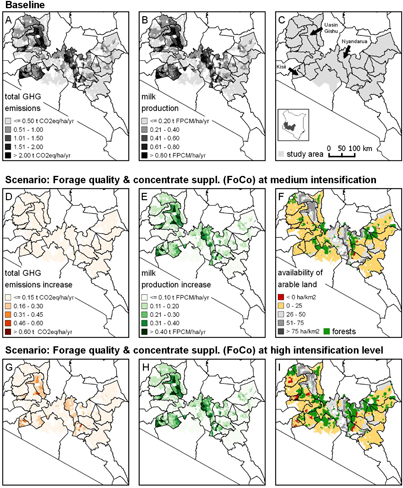
Figure 5. Baseline results were mapped for (a) total GHG emissions from dairy production and (b) milk production. Scenario changes relative to the baseline were mapped for increases in (b) and (g) total emissions and (e) and (h) milk production. Maps (f) and (i) illustrate the availability of arable land that could be converted to cropland required to grow additional maize and Napier grass (red = shortage of arable land). Only the two scenarios that complied with Kenya's NDC target and showed the smallest shortage of arable land are indicated.
Download figure:
Standard image High-resolution image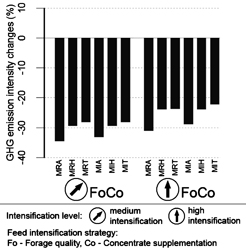
Figure 6. Mean GHG emission intensity changes, relative to baseline model, of the two scenarios that complied with Kenya's NDC target. Bars represent the different LPS (figure S2).
Download figure:
Standard image High-resolution image
Variability in emissions (shown by SD) among LPS for the baseline and scenarios ranges between 1.6%–5.1% for CH4 emissions from enteric fermentation, 6.5%–20.3% for CH4 and N2O emissions from manure management, 2.1–23.8% for soil emissions from feed cultivation, and 6.2%–13.7% for LUC emissions. This variability resulted from differences in feed quality across LPS (1%–2%) leading to variation in N excretion rates (2.3%–28.3%). Differences between the yields for Napier and maize (6.6%–12.9%) also influenced the demand for additional cropland among the LPS.
Four scenarios showed a decrease in emission intensities in relation to the baseline, namely FoCo at medium (27.2%) and high intensification (20.4%), FoFeCo at medium intensification (11.2%), and FeCo at medium intensification (9.1%) (figure 3(b)). Scenarios that included the use of silage, especially at high intensification level, did not reduce emission intensities, largely due to high LUC emissions. Higher milk yields were achieved, yet LUC emissions increased largely due to the conversion of cropland needed to grow additional maize. These emissions were on average ten times higher than those of the high intensification scenario using Napier instead of silage, outweighing the reductions in CH4 emissions from enteric fermentation by 8.4% ±6.2.
3.2. National targets and biophysical feasibility of scenarios
Two scenarios met Kenya's NDC target, increased milk yields considerably associated with a marginal shortage of arable land throughout the study region (figure 4). The FoCo scenarios at medium and high level of intensification increased total GHG emissions by 3.6 and 12.6% respectively. Taking into account the emission uncertainties, total emissions increased by 13.7 and 24.3% respectively at the upper 95% confidence limit. For the NDC, an increase of total emissions by 67.1% by 2030 relative to the base year 2010 would be tolerable. Only 0.5% (medium intensification) and 2.8% (high intensification) of the study region would not have enough arable land to implement these two scenarios. Through productivity increases in the same scenarios, the projected annual milk yield by 2030, as targeted in Kenya's dairy master plan was on average achieved by 38.3%–40.5%. Euclidean distances to the theoretical optimum were also shortest for the FoCo scenarios at medium and high level of intensification (figure 4).
3.3. Baseline and mitigation scenarios at landscape level
Three Kenyan counties (Nyandarua, Uasin Gishu, and Kisii) within the dairy production region show the highest total GHG emissions and milk production ranging between 1.3 ±0.5–1.6 ±1.2 t CO2eq ha−1 yr−1 and 0.6 ±0.2–0.7 ±0.5 t FPCM ha−1 yr−1 respectively (figures 5(a)–(c)). These counties have the highest densities of dairy cattle ranging from 0.7 ±0.5–0.9 ±0.6 TLU ha−1. Increases in total GHG emissions, milk production, and the availability of grazing land were mapped for the two scenarios that complied with Kenya's NDC target and showed a marginal shortage of arable land (figure 4), namely FoCo at medium (figures 5(d)–(f) and high level of intensification (figures 5(g)–(i)). The total emission increases ranged between 3.4 ±3.3–12.1 ±4.5%. Milk production increases ranged between 47.6 ±7.2–50.2 ±5.6%.
The mean baseline emission intensity across LPS was 2.4 ±0.13 kg CO2eq kg FPCM−1. Mean emission intensities decreased in relation to the baseline across LPS for the FoCo scenarios at medium (30.6 ±1.7%) and high level of intensification (25.7 ±1.6%) ranging from 1.7 ±0.03 to 1.8 ± 0.03 kg CO2eq kg FPCM−1 respectively (figure 6).
3.4. Uncertainties
Overall variability in total GHG emissions and emission intensities (pixel-based SD across LPS) due to uncertainties in emission parameters was smallest for the baseline (±1.9%) and highest for the FoFe scenario at high level of intensification (±7.8%) (figures 3(a)–(b)). The emission parameters used to quantify the baseline GHG emissions following the IPCC methodology had different impact on the variability of emissions. The methane conversion factor (Ym), with a range of 5.5%–7.5% was the parameter that showed the strongest influence on the variation in baseline total GHG emissions with ±7.2% relative to the mean total GHG emissions across LPS (figure S4). The SOC emission factor applied to calculate LUC emissions caused the largest uncertainty in total GHG emissions of the FoFe scenario at high intensification level. Total GHG emissions varied by ±47.5% across LPS (figure S5).
Uncertainty in livestock densities (expressed as mean SD across LPS) had the largest effect on CH4 emissions from enteric fermentation (figure 5). The smallest effect was indicated for the baseline (±1.8%), whereas the largest was shown for the FoFe scenario at high intensification level (±4.4%). The mean SD of milk production was lowest for the baseline (±1.8%) and was highest for the FoFeCo scenario at high intensification level (±4.2%).
4. Discussion
4.1. Baseline emission intensities and mitigation potential of scenarios
In this study, the mean baseline emission intensity was 2.4 ± 0.13 kg CO2eq kg FPCM−1 per grid cell. Most recent estimates for smallholder dairy production in Kenya report similar emission intensities ranging from 2.4–3.1 kg CO2eq kg milk−1 for semi-intensive and extensive production (Government of Kenya 2017). Emission intensities derived from life cycle assessments calculated for smallholder farms across the Kenyan highlands range from 1.8–2.0 kg CO2eq kg milk−1 for free grazing farms (Udo et al 2016, Weiler et al 2014). Baseline emission intensities calculated in this study were within the range estimated in other studies for Kenya. Emission intensities can vary due to different feed quality values used to calculate CH4 emissions from enteric fermentation and manure management based on the IPCC tier 2 methodology (IPCC 2006). For this study, these values were obtained from the East-African feed database and literature (Anindo et al 1994, Rufino et al 2009).
Total GHG emissions were higher for all scenarios in relation to the baseline, with the lowest increases of 3.4%–12.1% for the FoCo scenarios at medium and high level of intensification respectively. However, the reduction of emission intensities by 30.6% (1.7 ± 0.03 kg CO2eq kg FPCM−1) and 25.7% (1.8 ± 0.03 kg CO2eq kg FPCM−1) was achieved through improvements in forage quality by increasing the proportion of Napier grass in the diet and through supplementing dairy concentrates during early lactation. In addition, emission intensities were reduced by covering manure heaps. The overall reduction of N2O emissions from manure management by 68% is in line with the reduction potential reported in the literature on management of cattle manure (Chadwick 2005, Hou et al 2015). Mottet et al (2016) estimated the potential to reduce emission intensities by up to 14% through the improvement of feed quality alone in East Africa at a regional scale. Bryan et al (2013) reported a potential to reduce emission intensities (CH4 emissions only) by up to 60% through the increase of feed quality in a modelling study covering highland areas in Kenya, yet omitting likely emissions from LUC. With reductions of 26%–31%, this study ranks moderately compared to these findings, yet is more robust as detailed feed data and LUC emissions were included.
The FoCo scenarios at medium and high intensification level led to relatively high achievement rates of the national dairy master plan target (Government of Kenya 2010) increasing milk yields by 38.3% and 40.5% respectively. These scenarios led to the lowest increase in total GHG emissions by 3.4% and 12.1% respectively, complying with the NDC target (Government of Kenya 2015b), while facing the smallest shortage of arable land across the dairy region (0.5% and 2.8% respectively) (figure 4). Thus, these two scenarios present the lowest trade-offs between national level targets.
4.2. Synergies from implementing the most beneficial mitigation scenario
Average milk yield increases of the two FoCo scenarios were 47.6–50.2% higher than the baseline, which are modest increases compared to estimates by Rufino et al (2009) of 63%–79% for single dairy cows fed with similar diets. Experimental studies conducted in Kenya estimated gains in milk yield of 37% and 63% supplementing 3 kg day−1 and 7.8 kg day−1 of dairy concentrates during lactation (Moran 2005, Richards et al 2016). Growing Napier grass can have further positive effects on farm productivity for instance as effective vegetative barriers preventing soil erosion and nutrient losses (Guto et al 2011, Owino et al 2006). In addition, Napier grass can be a lucrative feed alternative. Compared to diets of lower quality, Napier increased the net revenue for milk production in Central and Western Kenya most at medium intensification level (by 0.08–0.12 USD l milk−1) (Bryan et al 2013). A medium level of intensification was also the most profitable choice (573 USD yr−1) for smallholder dairy farmers when compared to low and high intensification levels (473 and 360 USD yr−1 respectively) (Bebe et al 2002). Dairy concentrates are relatively expensive for smallholders, which seems to be the reason for low adoption rates associated with fluctuations in milk prices (Lukuyu et al 2011, Owen et al 2012). Therefore, the FoCo scenario at medium intensification would be the most viable, with lower adoption barriers due to relatively high gains in milk yield, and lower financial risks for smallholders compared to the high intensification scenario.
4.3. Supporting the development of sectoral and national mitigation plans
As quantified in this study, the total land use based GHG emissions from dairy production in Kenya represent 12.9% of the total emissions from the agricultural sector. Agriculture is the largest contributor to GHG emissions in Kenya, totalling 30 Mt CO2eq in 2010 (Government of Kenya 2015a), which emphasises the significance of sectoral mitigation actions. Kenya's national mitigation target defined in the NDC sets the scene for mitigation actions such as a dairy NAMA (Government of Kenya 2017). The findings of this study fill several knowledge gaps. First, it provides for the first time transparent quantifications of baseline emissions and milk yields and changes in emissions and productivity resulting from intensification scenarios at a sectoral scale. Increases in productivity of smallholder dairy farms through feeding practices is one of the main objectives of Kenya's dairy NAMA (Government of Kenya 2017). This study identified promising mitigation practices such as the improvement of forage quality and supplementation of dairy concentrates at medium intensification level. Second, the mitigation potential of specific practices was assessed against the NDC, enabling an evaluation of their performances to contribute to national mitigation targets. Demonstrating the technical potential of certain practices to fulfil mitigation and productivity targets opens the door for climate financing schemes that require reliable estimates to monitor the achievement of targets (Government of Kenya 2010, 2015b). Building a business case to finance climate mitigation, e.g. through NAMAs, requires quantitative information about the mitigation potential and productivity gains of specific practices in regions where these practices are feasible and an evaluation of inherent uncertainties (Grassi et al 2017) as provided by this study. Third, considering changes in land availability and demand for land resulting from mitigation actions before their actual implementation is crucial to achieve effective mitigation. That is minimizing the risk of negative spillover effects such as GHG emissions from indirect LUC. GHG emissions from the conversion of arable land required to grow additional high quality feeds can be substantial (figure 2). Increasing the grain content in cattle diets, e.g. through ensiling maize can compromise the effective mitigation potential of feed intensification due to the relatively high demand for additional cropland.
Information provided by this study is required for measurement, reporting and verification of agricultural mitigation actions and could guide the targeting of specific practices at the sub-national level (Lipper et al 2011). For instance, the baseline emissions mapped in this study could aid in prioritizing pilot projects in areas (e.g. counties) that show the highest total emissions (figure 4).
4.4. Climate-smart options that increase the mitigation potential for Kenya's dairy sector
At herd level, emission intensities can be reduced through improved reproduction such as lowering the proportion of unproductive animals by artificial insemination (Hristov et al 2013a, Knapp et al 2014). Vaccination programmes ameliorate animal health, lower mortality rates and increase lifetime productivity of cattle (Mottet et al 2016). De-stocking of animals with low productivity and replacement by breeds showing higher productivity would, in conjunction with improved feed management, decrease emissions and maintain or increase production (Herrero et al 2016).
Low productivity due to nutrient depleted soils is common in Kenya (Tittonell et al 2009). Improving the retention and recycling of available nutrients through the management of manure and application to soils as organic fertilizer is important to sustain soil fertility and to increase crop yields (Castellanos-Navarrete et al 2015, Rufino et al 2007, Tittonell et al 2010). Covering manure heaps, included in this study, is one option to minimize the loss of N during the manure storage phase (de Boer et al 2011). In addition, the combination of organic and mineral fertilizer is proposed to compensate relatively small amounts of available animal manure in smallholder dominated production systems (Tittonell et al 2010). A modelling exercise at global scale demonstrated that closing yield gaps could reduce LUC emissions, including deforestation, in Africa effectively outweighing potential increases in N2O emissions associated to fertilizer application (Valin et al 2013).
4.5. Uncertainty implication and data limitations
In this study, the methane conversion factor (Ym) was the largest source of uncertainty for CH4 emissions from enteric fermentation in the baseline. Data from laboratory measurements on cattle breeds and feeds managed under conditions that represent tropical production systems, especially from SSA, are required to derive improved estimates. Feeding trials on native cattle breeds from Kenya, currently conducted by the International Livestock Research Institute to estimate CH4 emissions from enteric fermentation are promising efforts (Pelster et al 2016). The loss of SOC due to the conversion of grazing land to cropland for additional feed crops influenced the uncertainty of scenario emissions most. High impact of LUC on total emissions due to the production of feeds by up to 877% were shown by van Middelaar et al (2013). Dynamic land use models simulating soil-vegetation dynamics in response to LUC could reduce the uncertainty. However, a comprehensive parameterization based on empirical data is required, which might prove difficult in data deficient regions such as SSA (Kim et al 2016). Cattle density data were an additional source of uncertainty for upscaled emissions and milk production since the spatially-explicit dataset was derived from predictive modelling to match a very high resolution at sub-county level (Robinson et al 2014). More detailed census data at sub-location level could reduce the related uncertainty in cattle densities.
Feed intensification scenarios can be further improved by more comprehensive feed quality information, including empirical data on pastures and fodder trees. This would allow exploring alternative feed strategies and scenarios such as improved pasture and silvopastural management options.
5. Conclusions
This study demonstrated that specific farm-level practices focusing on feed intensification and manure management can improve the efficiency in smallholder dairy production by improving productivity significantly while increasing total GHG emissions only marginally. At the same time, these practices can contribute to national targets reducing the impact of the agricultural sector on the climate system and safeguarding food security through sustainable intensification in dairy production. Quantitative spatially-explicit estimates showing win-win situations resulting from gains in agricultural productivity and climate change mitigation at sub-national level are crucial to implement climate change policies successfully.
Assessing demand for land due to the intensification of feed production is essential to obtain realistic estimates of how effective certain mitigation practices are at landscape scale and to support tailor-made, location-specific mitigation planning at sub-national level. Otherwise, mitigation planning could neglect the risk of GHG emissions from LUC triggered by feed intensification, outweighing potential gains from promising practices. Governments and the private sector could design financing instruments for farmers that seek to increase milk yields in compliance with mitigation targets through feed intensification and manure management using the findings of this study.
Acknowledgments
This study was funded by the CGIAR program on Climate Change, Agriculture and Food Security (CCAFS) and the IFAD program on 'Greening livestock: Incentive-based interventions for reducing the climate impact of livestock production in East Africa'. Additionally, the research was supported by the Norwegian Agency for Development Cooperation (NORAD) and Germany's International Climate Initiative (IKI) through CIFOR's Global Comparative Study on REDD+, and the CGIAR Research Program on Forests, Trees and Agroforestry (CRP-FTA) with financial support from the CGIAR Fund.