

Abstract
Applying biochar to soil is thought to have multiple benefits, from helping mitigate climate change [1, 2], to managing waste [3] to conserving soil [4]. Biochar is also widely assumed to boost crop yield [5, 6], but there is controversy regarding the extent and cause of any yield benefit [7]. Here we use a global-scale meta-analysis to show that biochar has, on average, no effect on crop yield in temperate latitudes, yet elicits a 25% average increase in yield in the tropics. In the tropics, biochar increased yield through liming and fertilization, consistent with the low soil pH, low fertility, and low fertilizer inputs typical of arable tropical soils. We also found that, in tropical soils, high-nutrient biochar inputs stimulated yield substantially more than low-nutrient biochar, further supporting the role of nutrient fertilization in the observed yield stimulation. In contrast, arable soils in temperate regions are moderate in pH, higher in fertility, and generally receive higher fertilizer inputs, leaving little room for additional benefits from biochar. Our findings demonstrate that the yield-stimulating effects of biochar are not universal, but may especially benefit agriculture in low-nutrient, acidic soils in the tropics. Biochar management in temperate zones should focus on potential non-yield benefits such as lime and fertilizer cost savings, greenhouse gas emissions control, and other ecosystem services.
Export citation and abstract BibTeX RIS

Original content from this work may be used under the terms of the Creative Commons Attribution 3.0 licence.
Any further distribution of this work must maintain attribution to the author(s) and the title of the work, journal citation and DOI.
Introduction
Biochar is a heterogeneous combination of pyrogenic compounds with varying physical and chemical properties that interact with soil [8], economically valuable crops, and aquatic organisms [9] and their environment, in a variety of ways [5, 10]. The range and extent of such interactions, in turn, determines the consequences for ecosystem functions and services. It is often claimed to address multiple environmental problems simultaneously, while also benefitting agriculture. Biochar has been shown to increase soil carbon storage, soil fertility, and soil water holding capacity [1, 5, 6, 11, 12], effects that are often described as consistent and universal [13, 14]. However, there is evidence to the contrary: biochar can suppress plant growth [5, 15] and reduce nutrient availability [16]. While some management actions are reversible [17], biochar application to soil is not, which urges caution.
Past syntheses have quantified the effects of biochar application to soil on crop productivity [5, 6, 14, 15, 18], but under-representation of certain environmental variables and crop types [5, 6, 18], along with restrictive inclusion criteria [5, 6, 14], call into question the generality of their conclusions. Here, we compile 1125 observations from 109 independent studies of the effects of biochar on yield (See supplementary information for reference list and table S1, available at stacks.iop.org/ERL/12/053001/mmedia for attribution of papers to each category for analysis), to produce a substantially larger and more representative database than used in past syntheses, spanning temperate and tropical regions and a wide range of soil conditions, to test whether the effect of biochar is driven by interactions with soil pH and the introduction of nutrients in the biochar. Gaining such an understanding of the mechanism underlying biochar's observed effect on crop productivity is vital to allow effective predictions as to the probably longevity of such effects. Here we focus on soil pH effects and potential fertilisation effects as our previous work has indicated these as likely drivers of observed yield effects [5, 7, 15]. If yield increases are due to a fertilisation effect of nutrients available from the applied biochar, such increases will only last for the duration of increased nutrient availability. Conversely, if yield increases are due to a pH effect, they should only be expected to last for as long as the soil pH is ameliorated, expected to be measured in years rather than decades to centuries as for the residence time of the biochar C in soils [13, 19].
Overall, biochar increased crop yield by a grand mean of 13% (figure 1), similar to previously reported meta-analyses, which were 10% [5] and 11% [6]. However, without geographical consideration these global averages may belie important variation. Previous studies had a strong numerical bias towards the tropics [5, 6, 14, 15]. This current analysis allows geographical partitioning because it has similar numbers of pairwise comparisons from the two main climatic zones: ≤35th degree latitude including the tropics and subtropics (hereafter called 'tropics') and >35th degree latitude including the temperate and the boreal (hereafter called 'temperate') (figures 1 and
What causes the disproportionate yield increase in the tropics? We found that the yield stimulation was highest for soils with lower initial soil pH, prior to biochar application, and the effect systematically declined as initial soil pH increased (figure 1 and sup supplementary figure 14(a)). However, this pattern was observed for tropical data and not for temperate soils. This suggests that, to a large extent, the yield-stimulating property of biochar derives from an effect of soil liming, similar to that found for natural chars in wildfire-affected ecosystems [23]. The pH of biochars applied in the studies we synthesized was high (median pH = 9.0), consistent with a larger liming effect on the acidic tropical soils (median pH = 5.7) compared to the more neutral temperate soils (median pH = 6.9). As soil pH was unlikely causing yield penalties in temperate soils, as suggested by the neutral median pH, it should be expected that application of any material applied with the aim of ameliorating acidic soil pH would have little to no effect in such soils.
In temperate soils, crop yields are often already near their maximum potential [24, 25]. Nevertheless, the general expectation has been that biochar could improve crop yields by further improving soil fertility by a range of posited mechanisms [22] (see also Supplementary Information). In contrast, data presented here suggest no effect or potentially a negative effect on yields in temperate soils. A possible mechanism for this observed effect may be that biochar raised the soil pH too much (i.e. over-liming) leading to immobilisation of key (micro)nutrients, such as manganese, iron, boron, and phosphorus. Most studies did not report the change in soil pH following biochar application, which indicates that the liming effect was often not considered in the experimental design. However, the addition of biochar with a pH that is two units higher than that of the soil, at the median biochar application rate (30 t ha−1), is very likely to have increased the pH beyond the optimum for soil fertility in many cases.
To gain further insight into the mechanisms underlying biochar's influence on crop yield, we sub-divided the feedstocks used to produce biochars into two categories: 'Nutrient' such as manures and biosolids, which have a strong potential to provide a fertilising effect; and 'Structure' such as wood and straw, which are likely to have negligible fertilisation effects, but may provide a soil structural effect (i.e. increasing water retention [26], decreasing bulk density or providing refugia for soil organisms [8, 26]; supplementary table 2). In the generally nutrient-poor tropical soils, addition of Nutrient biochars produces more than three times the increase in crop yield than that by addition of Structure biochars, i.e. 70% vs. 19% (figure 1). This contrasts with temperate soils where yields show no stimulation following application of either Structure (−3%) or of Nutrient biochars (−1%). This indicates that biochar's effect on crop yield under nutrient-limited conditions derives largely from a fertilisation effect from nutrients that are co-introduced with the biochar, possibly acting in combination with a liming effect due to biochar's high pH. However, it should be noted that in all cases, treatments with biochar are compared to controls without biochar. As we have argued previously, it is necessary to be able to compare the impacts of biochar application to the impacts of application of the feedstock from which the biochar is made [7]. This would allow identification of biochar effects per se, i.e. beyond those that would have been expected from the application of the feedstock in unpyrolysed form. However, currently there are not sufficient published studies utilising such an experimental set up to allow such a meta-analysis to be performed. Further research is needed with appropriate use of experimental controls. Such application of positive controls will also allow the empirical verification as to whether the mechanisms suggested by this analysis are indeed the key mechanisms. No other biochar properties previously found to be key drivers for other biochar impacts were found to modulate the yield response, including maximum production temperature [27] (supplementary figure 6) or H:Corg [28] (supplementary figure 8).
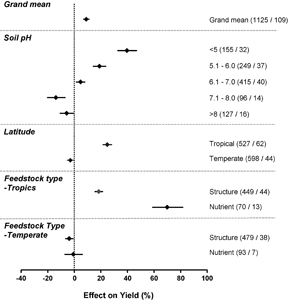
Figure 1 Influence of initial soil pH, latitude, and feedstock type on crop yields following biochar application. Biochar feedstock was categorised by its main contributing property: predominantly structural (e.g. wood) or nutrient (e.g. manure). See online supplementary table 3 for more details on this categorisation. Points show means, bars show 95% confidence intervals. The numbers in parentheses show the number of pairwise comparisons on which that statistic is based (left) and the number of independent publications from which the data were drawn (right).
Download figure:
Standard image High-resolution imageOur results show that biochar can be a useful tool to improve crop yield in nutrient-poor and acidic soils. The implication of this finding is crucial considering that approximately 30% of the world's soils are acidic, including more than 50% of potential arable land [29]. In the tropical zone, adoption of biochar as a management technique may be driven by farmers' considering yield benefits as well as potential reductions in liming and fertiliser costs, also depending on the eventual market price of biochar compared to agricultural lime [30]. In the temperate zone, biochar may also contribute to reduced fertiliser and liming costs, if applied periodically at low application rates, rather than the one-off applications used in the studies in our database. The economic returns from using biochar in these soils may be higher than those from using lime after accounting for non-yield-related effects, such as carbon sequestration [3, 18]. A meta-analysis on tree growth responses following biochar amendment, based on 17 studies, found a 10% growth increase in temperate regions compared to 38% in tropical regions [23]. Forests are mostly located in the more naturally-constrained areas in the temperate zone, which is likely to explain the positive effect. However, the current study's overall no-effect of biochar on arable crop yield in the temperate zone is a step further, which highlights the need for more careful consideration of the interactions between biochar and soil properties [31] for soils that are yielding near their maximum crop productivity.
Biochar has been linked to important potential environmental benefits (e.g. carbon sequestration, N2O mitigation, soil remediation, crop disease and pest suppression, soil water retention, etc.) [4, 10, 32, 33], which are beyond the scope of the current study. Future research should investigate the generality of these claims. If proven to be true for temperate soils, these benefits may justify the application of biochar when weighted against potential yield penalties. However, in light of this comprehensive analysis, the widespread hype of biochar use for crop yield effects must be questioned. Others have suggested that the global biochar research community needs to match biochars to soils and socio-economic conditions and have come up with 'tailored treatments [10, 31, 32]. Our results indicate that, even for a basic and well-known agronomic factor such as liming, this matching has thus far mostly not happened, particularly in the temperate zone. We expect that our results will contribute to a compatibility system of the properties between biochars and soils to maximise its potential to enhance multiple ecosystem services and minimise trade-offs [5]. It is also crucial to identify the socio-economic conditions and options for biochar incentive mechanisms for climate change mitigation, particularly in instances where yield gains are likely to be minimal at best. Biochar is not always a win-win-win technology [7, 33, 34].
Methods
Web of Science, Scopus and Google Scholar were searched using 'biochar AND crop productivity OR crop production OR crop yield'. The cut-off date for inclusion of studies in the database was 31 December 2014. To maximise the number of publications on which this analysis was based, all studies that reported quantitative results and fulfilled the following criteria were included (i.e. both pot and field experiments): i) report means and a measure of variance from which standard deviation could be calculated (when no measures of variance were given, efforts were made to obtain these from the corresponding authors); ii) the study design had to include replication (n ≥ 3) and randomisation; iii) only treatments from each study were included if a 'control' could be identified in which all factors, such as soil amendments, were the same as the biochar 'treatment', but without the application of biochar. All reported auxiliary variables for both soil and biochar properties were recorded in the database. A total of 111 publications, giving 1135 pairwise comparisons fulfilled these requirements and were included in the analysis. When contacted authors did not reply variances were interpolated as the coefficient of variance of all experimental means from that paper multiplied by the treatment mean. Each variance was then doubled to reduce the weighting of studies containing interpolated data in the final analysis.
A database validation exercise was conducted whereby each co-author was randomly assigned three articles for which they had not entered the data. All appropriate cells in the database corresponding to these papers were then double checked. The error rate was found to be ∼1%, usually consisting of typing input errors. With each of these errors now corrected, the database is assumed to have an error rate <1%.
As previously discussed [5, 27, 28], data required pre-grouping before the MA could be conducted. Categorisations can be identified in the figures and were based on those used previously [5, 24, 25]. A categorical meta-analysis was applied using a random effects model with 9999 iterations using MetaWin Version 2 statistical software. The effect size was calculated by unlogging the calculated response ratio, which was calculated using the equation [35].
Where  represents the mean of the experimental treatment and represents the mean of the control.
Meta-analyses using this metric can have issues whereby the use of multiple pairwise comparisons means that the number of replicates that the statistic is based on may be artificially high; replicates from the control treatment may be used more than once in pairwise comparisons. This can lead to overconfidence in a reported statistic due to artificial reduction of the size of calculated 95% confidence intervals. Steps which can be taken to account for this bias [36, 37] have been shown to have little effect and sacrifice too much information [38, 39, 40]. As such, results from this analysis are reported on the level of single comparisons [41].

Figure 2 Map showing the global distribution of the 107 experimental sites included in the meta-analysis database for which data location data were available. Note that each marker may represent several studies published by the same research institute.
Download figure:
Standard image High-resolution image
Acknowledgments
We gratefully acknowledge the Marie Curie Career Integration Grant (no. GA 526/09/1762) of Simon Jeffery and the Portuguese Foundation for Science and Technology (FCT) for the postdoctoral fellowships of Frank Verheijen (SFRH/BPD/107913/2015) and Ana Catarina Bastos (SFRH/BPD/98231/2013) as well as the PhD fellowship of Marija Prodana (SFRH/BD/89891/2012).
We are also grateful to all of those who replied to data requests: Dr R D Lentz, Dr B Nzanza, Dr P Tammeorg and Dr J A Alburquerque.